| Param | Original file | Final file |
|---|---|---|
| Filename | modeM0/AS1C09_004T08_9000006514_54208cztM0_level2.fits | modeM0/AS1C09_004T08_9000006514_54208cztM0_level2_quad_clean.evt |
| Size (bytes) | 481,763,520 | 90,305,280 |
| Size | 459.4 MB | 86.1 MB |
| Events in quadrant A | 2,952,492 | 617,572 |
| Events in quadrant B | 3,084,739 | 667,084 |
| Events in quadrant C | 3,327,404 | 562,360 |
| Events in quadrant D | 7,959,001 | 431,101 |
| Mode M0 | |||
|---|---|---|---|
| Quadrant | BADHDUFLAG | Total packets | Discarded packets |
| A | 0 | 13761 | 1 |
| B | 0 | 13874 | 1 |
| C | 0 | 14975 | 1 |
| D | 0 | 28160 | 1 |
| Mode M9 | |||
|---|---|---|---|
| Quadrant | BADHDUFLAG | Total packets | Discarded packets |
| A | 0 | 10 | 0 |
| B | 0 | 10 | 0 |
| C | 0 | 10 | 0 |
| D | 0 | 10 | 0 |
| Mode SS | |||
|---|---|---|---|
| Quadrant | BADHDUFLAG | Total packets | Discarded packets |
| A | 0 | 130 | 0 |
| B | 0 | 130 | 0 |
| C | 0 | 130 | 0 |
| D | 0 | 130 | 0 |
| Quadrant | Total seconds | Saturated seconds | Saturation percentage |
|---|---|---|---|
| A | 6548 | 71 | 1.084301% |
| B | 6549 | 93 | 1.420064% |
| C | 6549 | 263 | 4.015880% |
| D | 6549 | 1657 | 25.301573% |
Noise dominated data is calculated using 1-second bins in cleaned event files. If a bin has >2000 counts, and if more than 50% of those come from <1% of pixels, then it is considered to be noise-dominated and hence unusable.
| Quadrant | # 1 sec bins | Bins with >0 counts | Bins with >2000 counts | High rate bins dominated by noise | Noise dominated (total time) | Noise dominated (detector-on time) | Marked lightcurve |
|---|---|---|---|---|---|---|---|
| A | 7478 | 6548 | 23 | 23 | 0.31% | 0.35% | 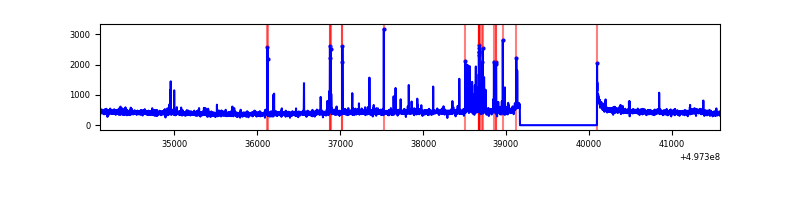 |
| B | 7479 | 6549 | 23 | 23 | 0.31% | 0.35% | 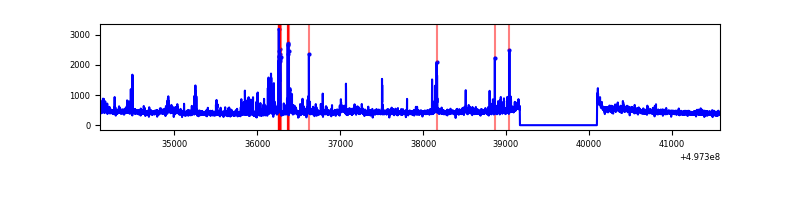 |
| C | 7479 | 6549 | 202 | 202 | 2.70% | 3.08% | 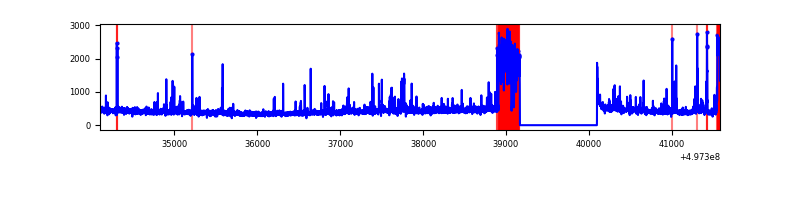 |
| D | 7479 | 6550 | 1648 | 1648 | 22.04% | 25.16% | 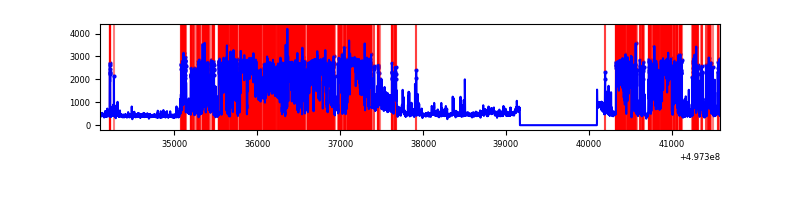 |
Top three noisy pixels from each quadrant. If the there are fewer than three noisy pixels in the level2.evt file, extra rows are filled as -1
| Pixel properties | Quadrant properties | ||||||
|---|---|---|---|---|---|---|---|
| Quadrant | DetID | PixID | Counts | Sigma | Mean | Median | Sigma |
| A | 0 | 8 | 105125 | 605.47 | 691 | 673 | 172.5 |
| A | 15 | 174 | 52263 | 299.05 | 691 | 673 | 172.5 |
| A | 4 | 3 | 34977 | 198.85 | 691 | 673 | 172.5 |
| B | 4 | 67 | 127865 | 869.37 | 684 | 658 | 146.3 |
| B | 15 | 20 | 51975 | 350.71 | 684 | 658 | 146.3 |
| B | 0 | 213 | 49407 | 333.16 | 684 | 658 | 146.3 |
| C | 15 | 215 | 375436 | 2100.86 | 648 | 643 | 178.4 |
| C | 15 | 216 | 122164 | 681.17 | 648 | 643 | 178.4 |
| C | 12 | 252 | 64304 | 356.84 | 648 | 643 | 178.4 |
| D | 8 | 176 | 5025166 | 30197.47 | 581 | 554 | 166.4 |
| D | 2 | 252 | 281164 | 1686.44 | 581 | 554 | 166.4 |
| D | 11 | 176 | 146286 | 875.84 | 581 | 554 | 166.4 |
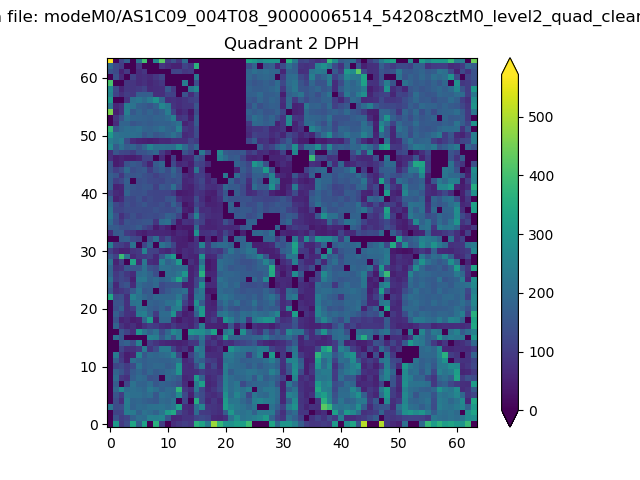
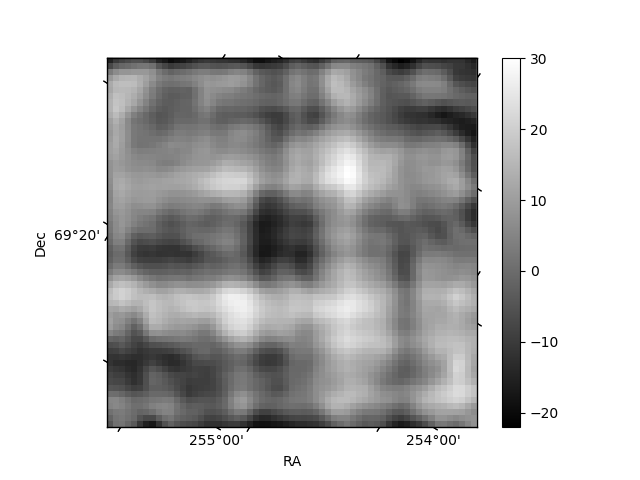
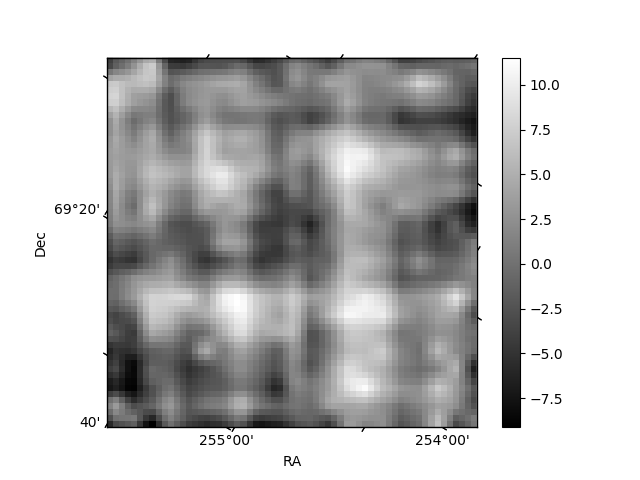
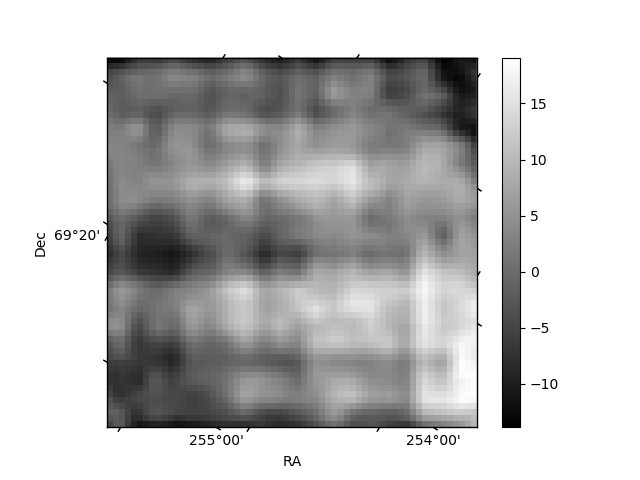
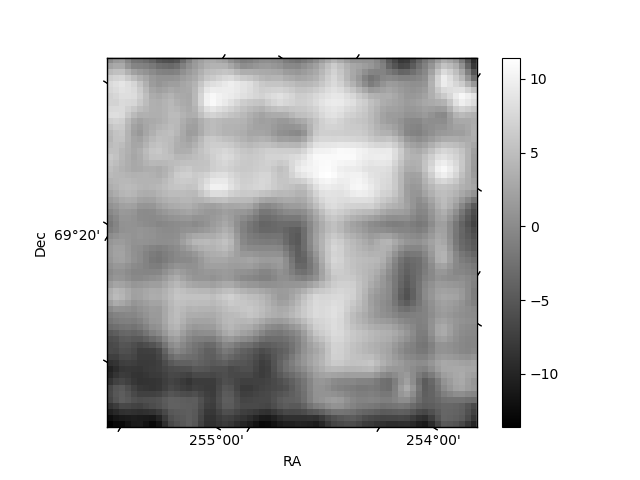
Histogram calculated using DETX and DETY for each event in the final _common_clean file
| Quadrant A | 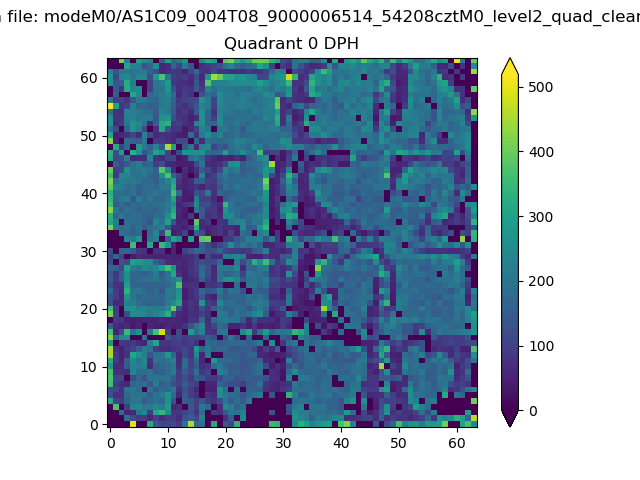 |
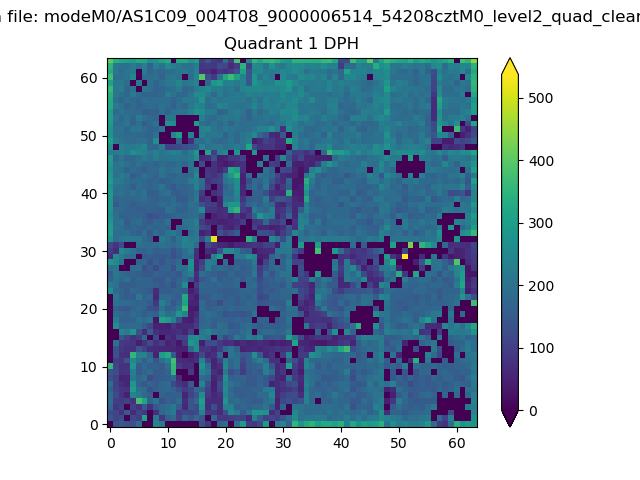 |
Quadrant B |
|---|---|---|---|
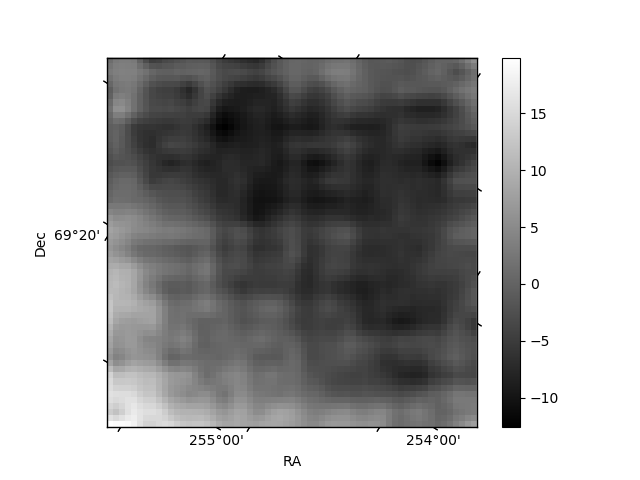
| Quadrant D | 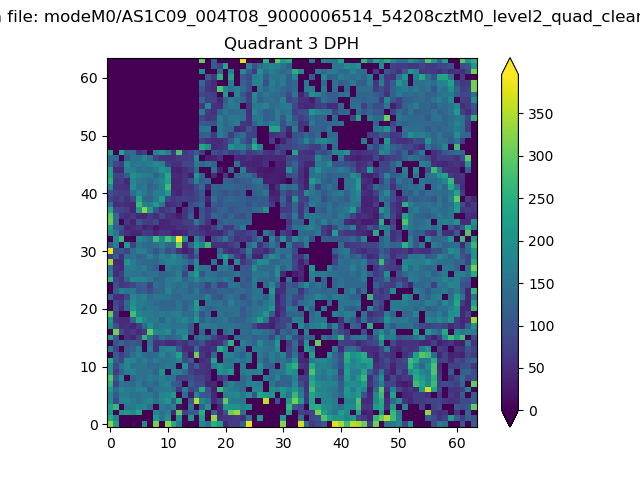 |
 |
Quadrant C |
| Plot type | Count rate plots | Images |
|---|---|---|
| Comparison with Poisson distribution Blue bars denote a histogram of data divided into 1 sec bins. Red curve is a Poisson curve with rate = median count rate of data. |
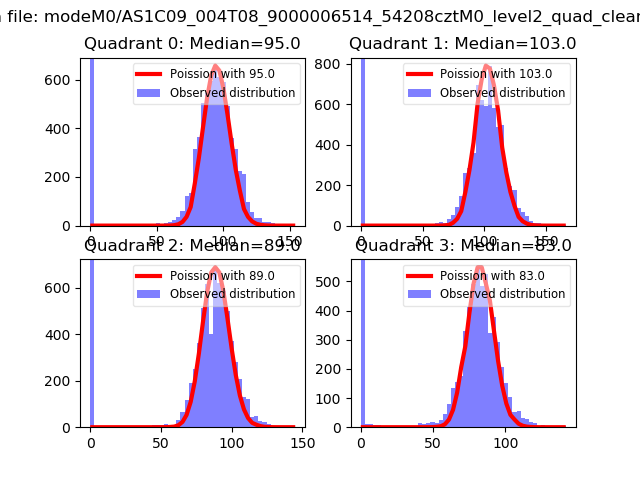 |
 |
| Quadrant-wise count rates Data is divided into 100 sec bins |
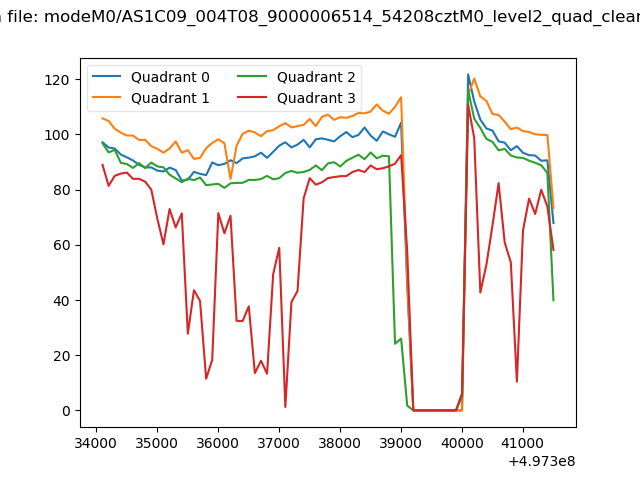 |
|
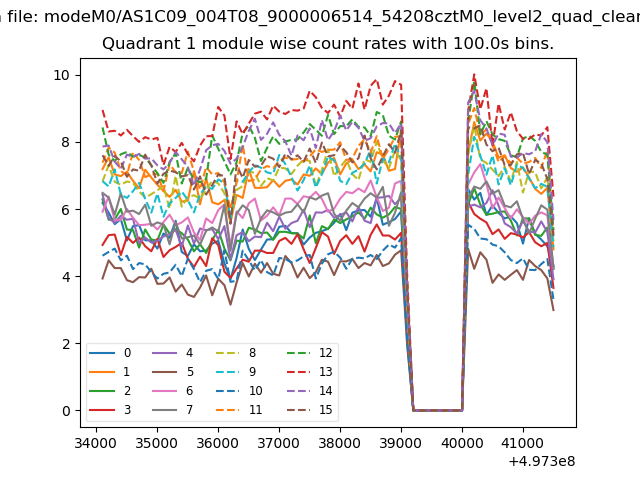
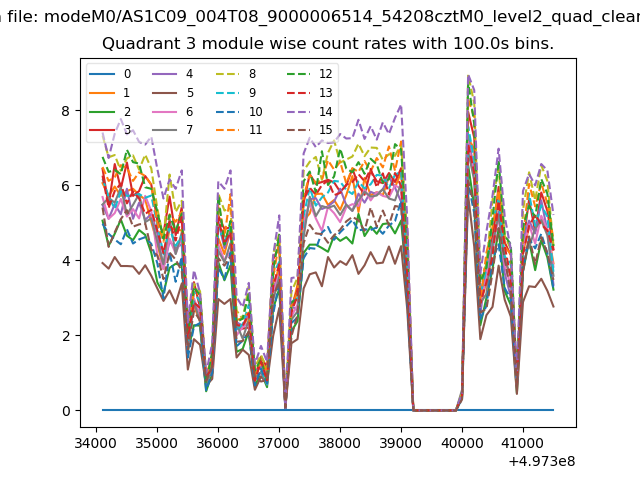
| Module-wise count rates for Quadrant A Data is divided into 100 sec bins |
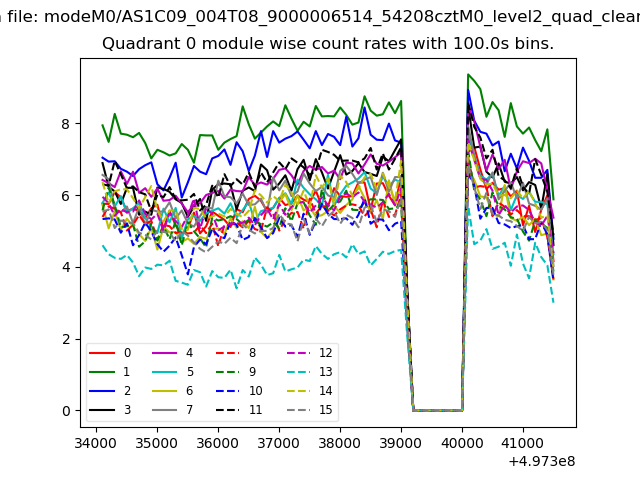 |
 |
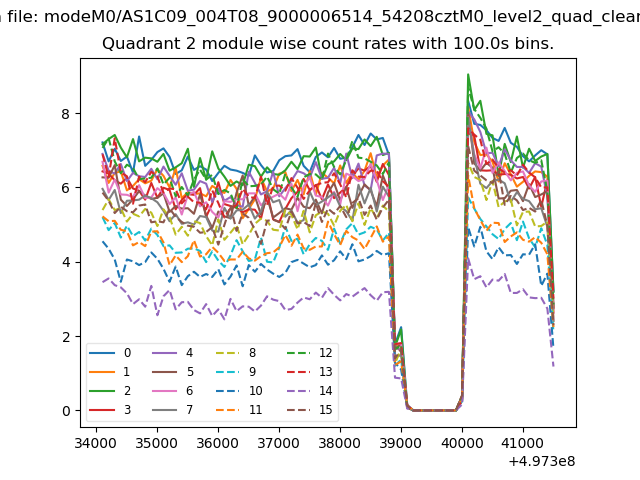
| Module-wise count rates for Quadrant B Data is divided into 100 sec bins |
 |
 |
| Module-wise count rates for Quadrant C Data is divided into 100 sec bins |
 |
 |
| Module-wise count rates for Quadrant D Data is divided into 100 sec bins |
 |
 |
| Parameter | Plot |
|---|---|
| CZT HV Monitor | 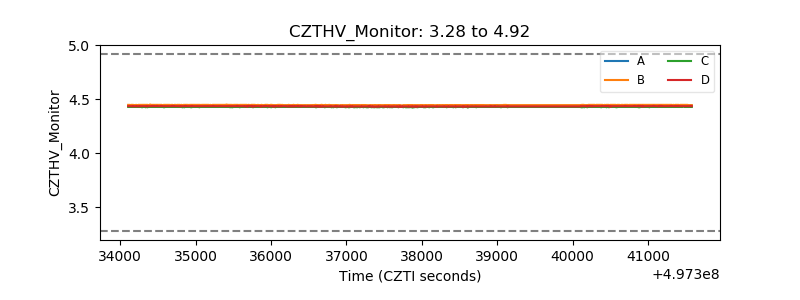 |
| D_VDD | 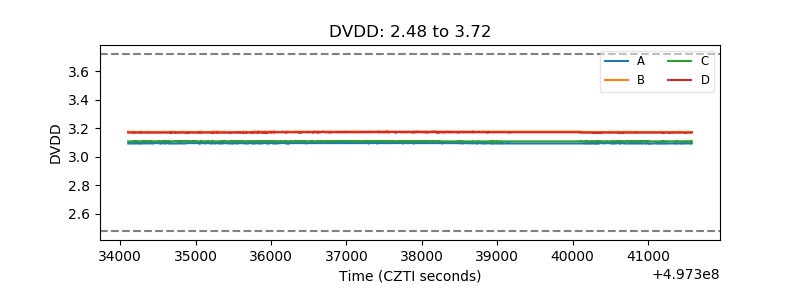 |
| Temperature 1 | 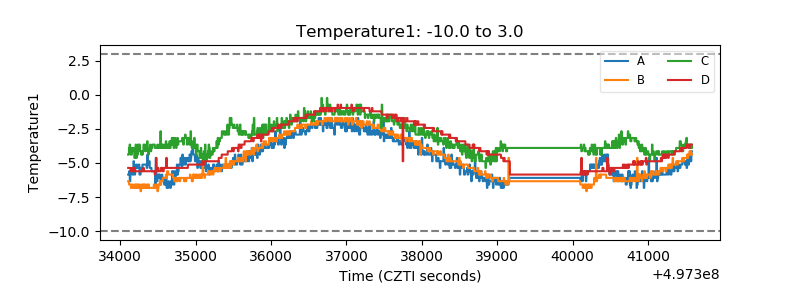 |
| Veto HV Monitor | 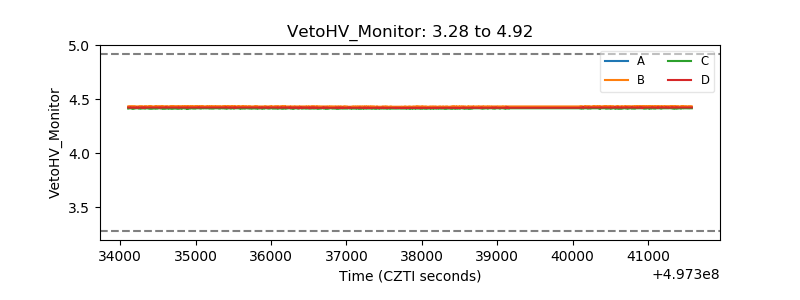 |
| Veto LLD | 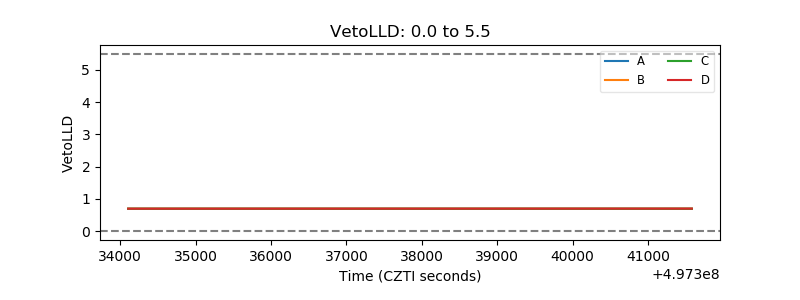 |
| Alpha Counter | 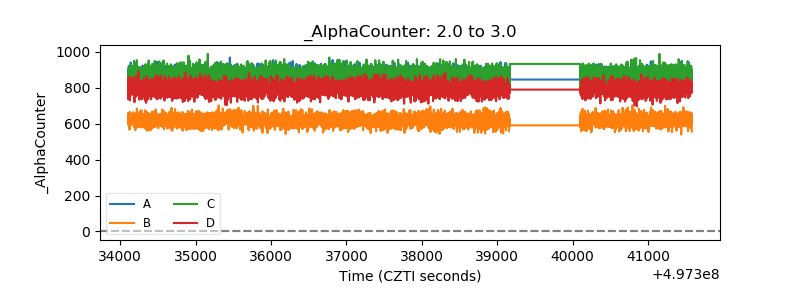 |
| _CPM_Rate | 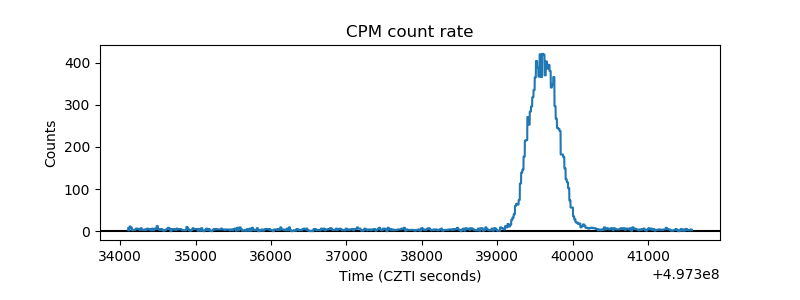 |
| CZT Counter | 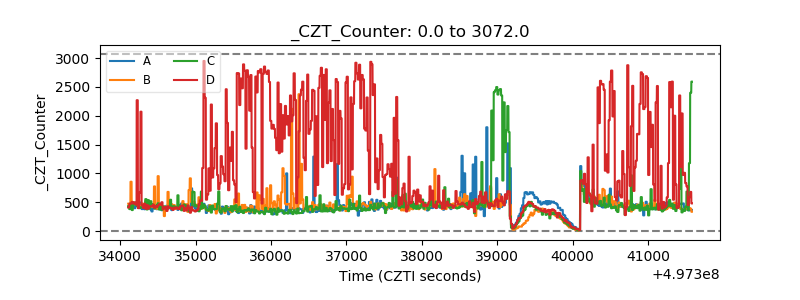 |
| +2.5 Volts monitor | 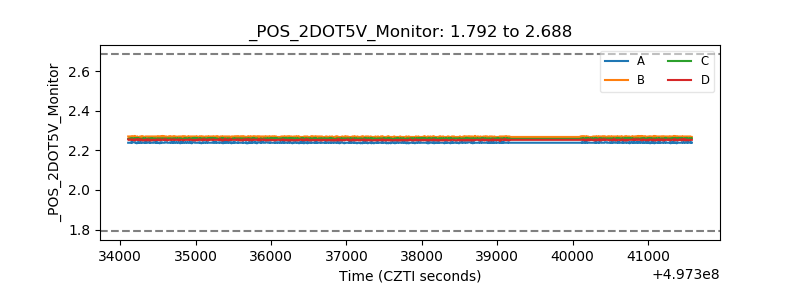 |
| +5 Volts monitor | 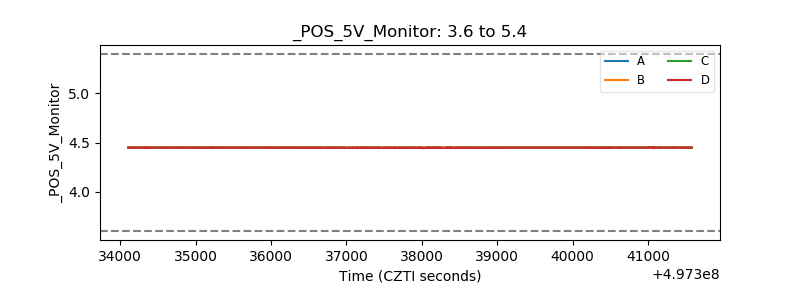 |
| _ROLL_ROT | 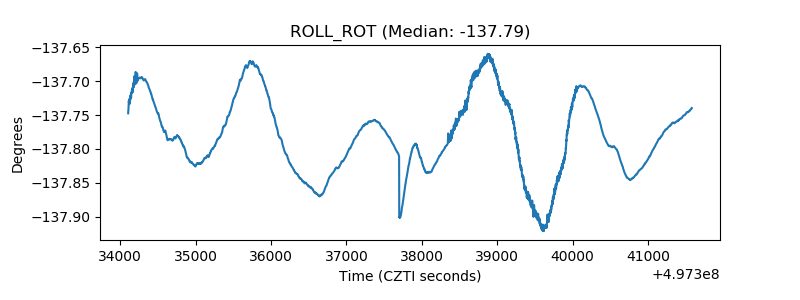 |
| _Roll_DEC | 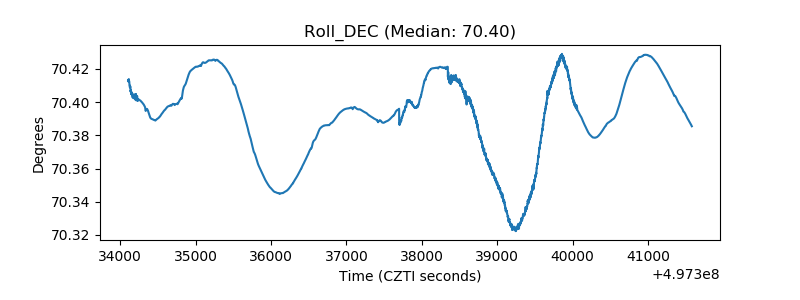 |
| _Roll_RA | 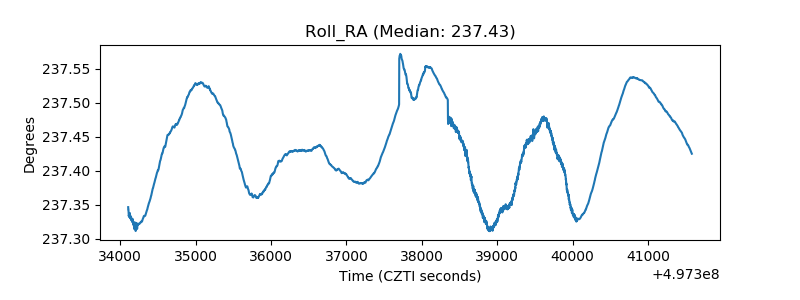 |
| Veto Counter | 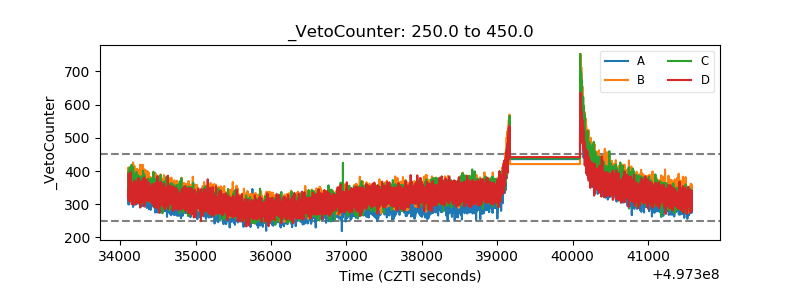 |