| Param | Original file | Final file |
|---|---|---|
| Filename | modeM0/AS1C09_004T08_9000006514_54209cztM0_level2.fits | modeM0/AS1C09_004T08_9000006514_54209cztM0_level2_quad_clean.evt |
| Size (bytes) | 531,325,440 | 92,453,760 |
| Size | 506.7 MB | 88.2 MB |
| Events in quadrant A | 3,229,873 | 642,309 |
| Events in quadrant B | 3,033,346 | 704,146 |
| Events in quadrant C | 3,434,753 | 600,930 |
| Events in quadrant D | 9,453,158 | 388,658 |
| Mode M0 | |||
|---|---|---|---|
| Quadrant | BADHDUFLAG | Total packets | Discarded packets |
| A | 0 | 14422 | 2 |
| B | 0 | 13872 | 2 |
| C | 0 | 15217 | 2 |
| D | 0 | 32638 | 2 |
| Mode M9 | |||
|---|---|---|---|
| Quadrant | BADHDUFLAG | Total packets | Discarded packets |
| A | 0 | 10 | 0 |
| B | 0 | 10 | 0 |
| C | 0 | 10 | 0 |
| D | 0 | 10 | 0 |
| Mode SS | |||
|---|---|---|---|
| Quadrant | BADHDUFLAG | Total packets | Discarded packets |
| A | 0 | 136 | 0 |
| B | 0 | 136 | 0 |
| C | 0 | 136 | 0 |
| D | 0 | 136 | 0 |
| Quadrant | Total seconds | Saturated seconds | Saturation percentage |
|---|---|---|---|
| A | 6641 | 152 | 2.288812% |
| B | 6642 | 81 | 1.219512% |
| C | 6641 | 167 | 2.514682% |
| D | 6641 | 2378 | 35.807860% |
Noise dominated data is calculated using 1-second bins in cleaned event files. If a bin has >2000 counts, and if more than 50% of those come from <1% of pixels, then it is considered to be noise-dominated and hence unusable.
| Quadrant | # 1 sec bins | Bins with >0 counts | Bins with >2000 counts | High rate bins dominated by noise | Noise dominated (total time) | Noise dominated (detector-on time) | Marked lightcurve |
|---|---|---|---|---|---|---|---|
| A | 7676 | 6641 | 90 | 90 | 1.17% | 1.36% | 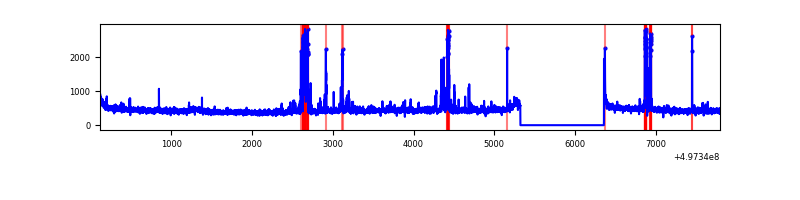 |
| B | 7677 | 6642 | 4 | 4 | 0.05% | 0.06% | 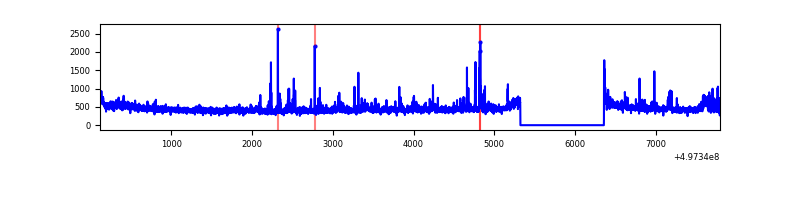 |
| C | 7676 | 6642 | 151 | 151 | 1.97% | 2.27% | 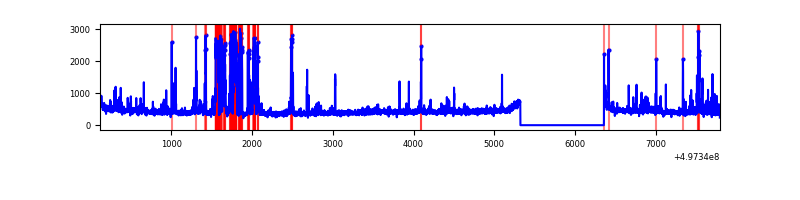 |
| D | 7676 | 6641 | 2337 | 2337 | 30.45% | 35.19% | 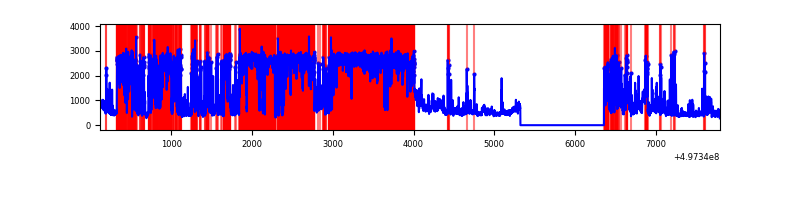 |
Top three noisy pixels from each quadrant. If the there are fewer than three noisy pixels in the level2.evt file, extra rows are filled as -1
| Pixel properties | Quadrant properties | ||||||
|---|---|---|---|---|---|---|---|
| Quadrant | DetID | PixID | Counts | Sigma | Mean | Median | Sigma |
| A | 15 | 174 | 247476 | 1384.87 | 713 | 694 | 178.2 |
| A | 0 | 8 | 96346 | 536.77 | 713 | 694 | 178.2 |
| A | 4 | 3 | 45960 | 254.02 | 713 | 694 | 178.2 |
| B | 4 | 67 | 85579 | 557.89 | 709 | 683 | 152.2 |
| B | 7 | 252 | 28222 | 180.97 | 709 | 683 | 152.2 |
| B | 5 | 185 | 26539 | 169.91 | 709 | 683 | 152.2 |
| C | 15 | 215 | 376967 | 1983.12 | 681 | 674 | 189.7 |
| C | 12 | 252 | 120671 | 632.4 | 681 | 674 | 189.7 |
| C | 15 | 216 | 83767 | 437.91 | 681 | 674 | 189.7 |
| D | 8 | 176 | 6588414 | 41570.09 | 550 | 525 | 158.5 |
| D | 2 | 252 | 323674 | 2039.1 | 550 | 525 | 158.5 |
| D | 1 | 3 | 153261 | 963.78 | 550 | 525 | 158.5 |
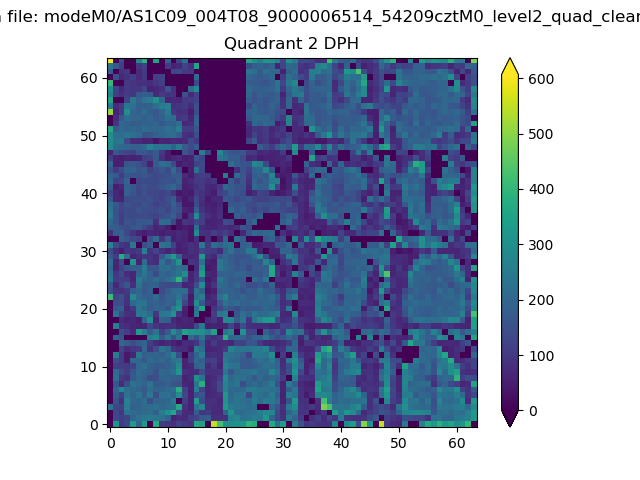
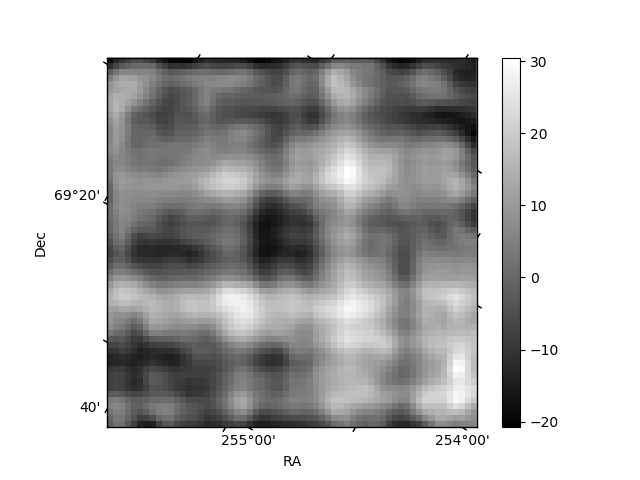
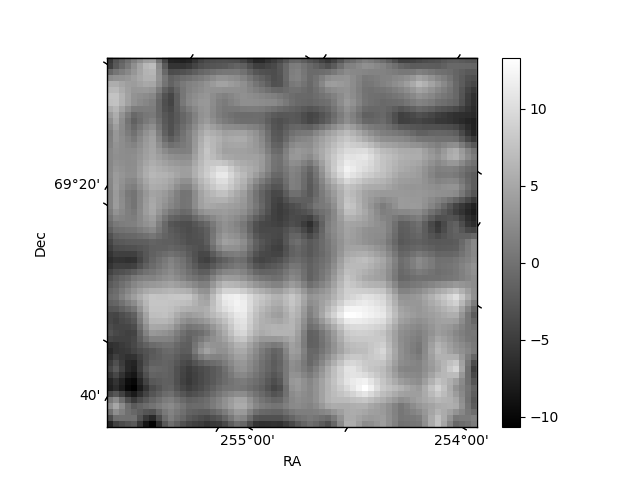
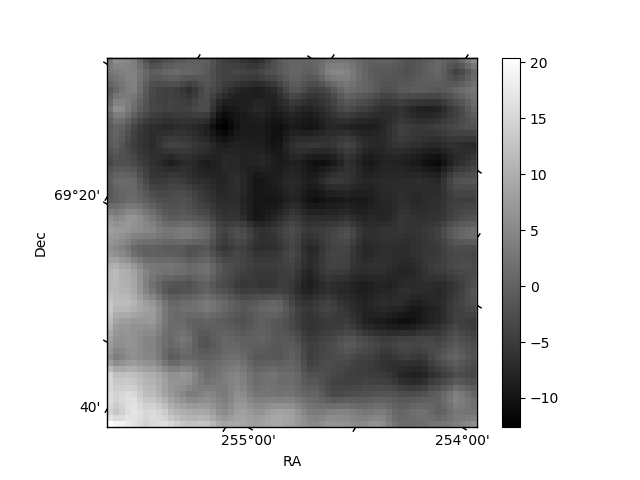
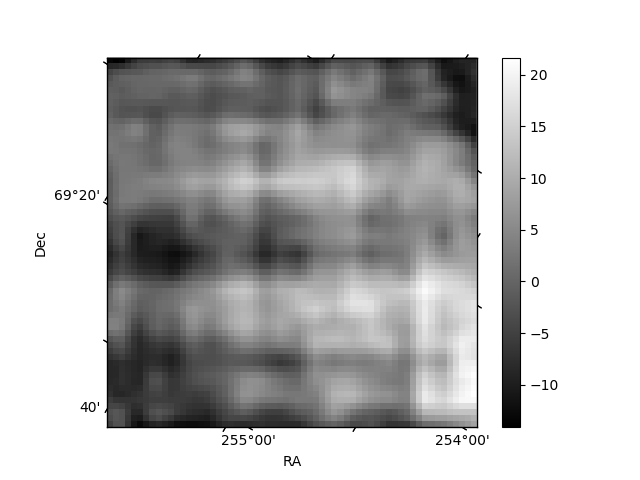
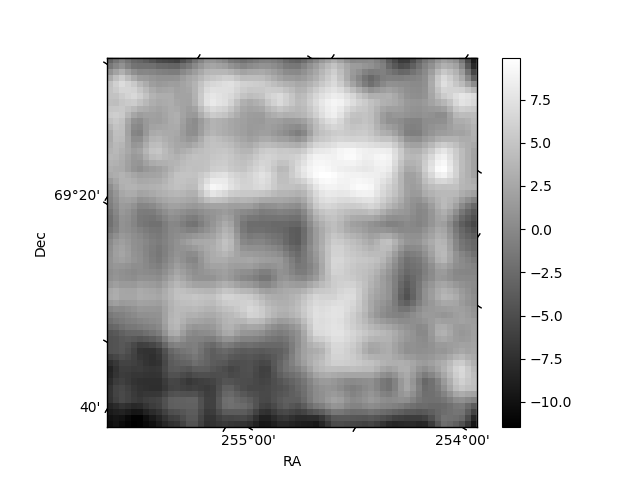
Histogram calculated using DETX and DETY for each event in the final _common_clean file
| Quadrant A | 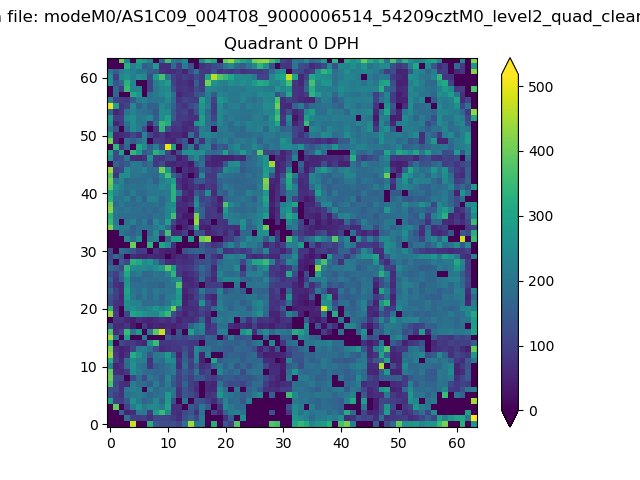 |
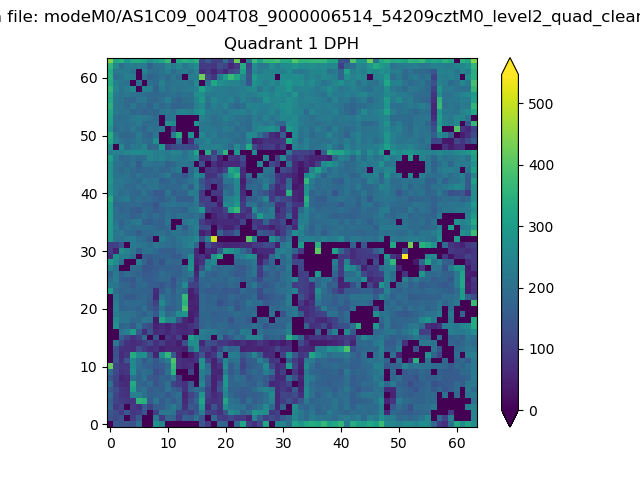 |
Quadrant B |
|---|---|---|---|
| Quadrant D | 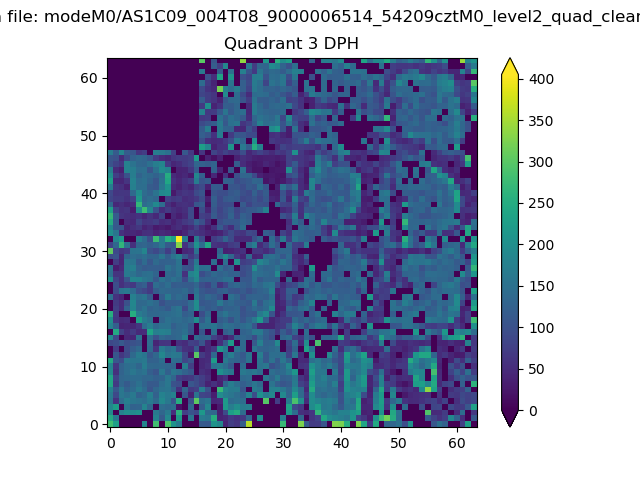 |
 |
Quadrant C |
| Plot type | Count rate plots | Images |
|---|---|---|
| Comparison with Poisson distribution Blue bars denote a histogram of data divided into 1 sec bins. Red curve is a Poisson curve with rate = median count rate of data. |
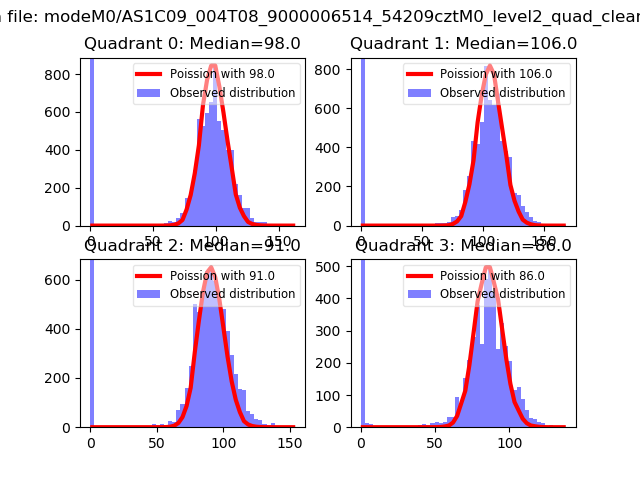 |
 |
| Quadrant-wise count rates Data is divided into 100 sec bins |
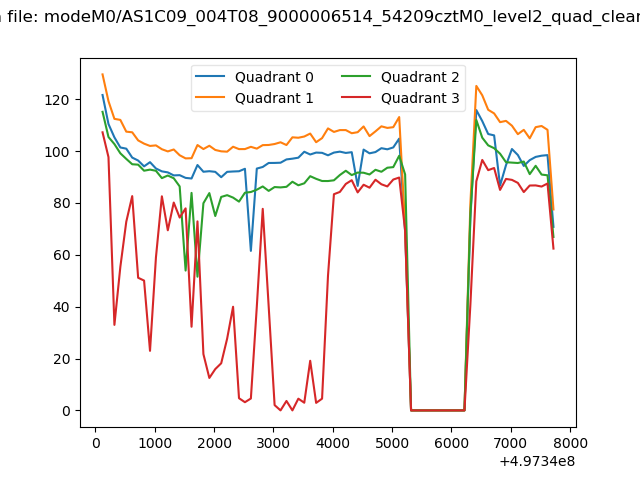 |
|
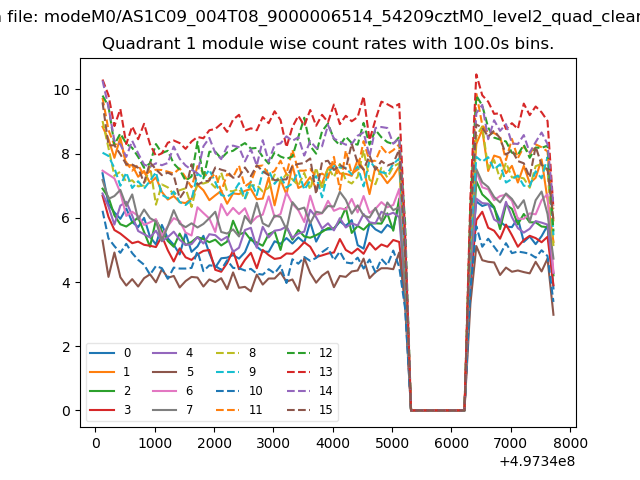
| Module-wise count rates for Quadrant A Data is divided into 100 sec bins |
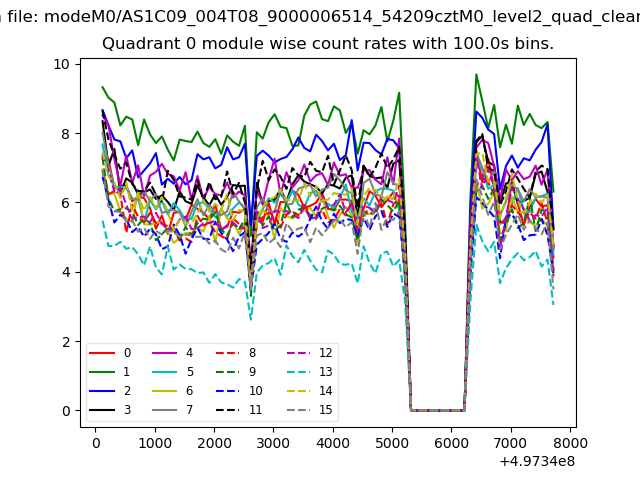 |
 |
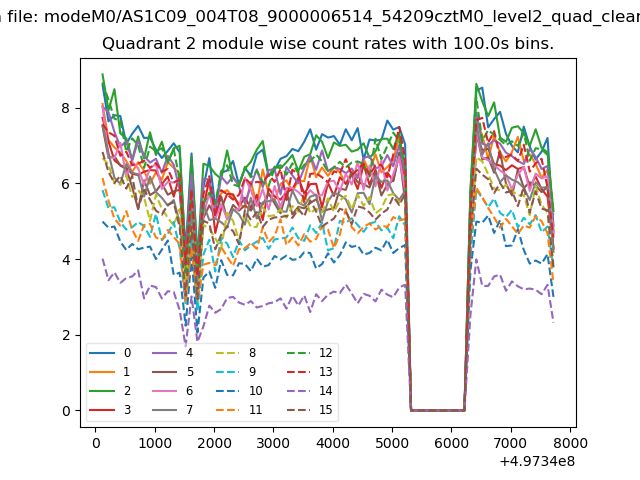
| Module-wise count rates for Quadrant B Data is divided into 100 sec bins |
 |
 |
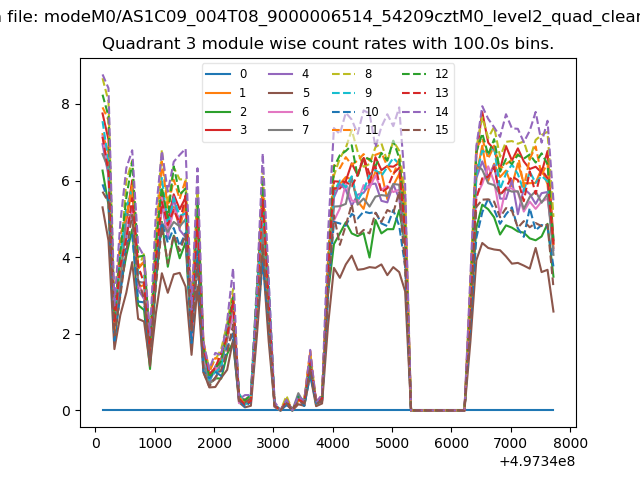
| Module-wise count rates for Quadrant C Data is divided into 100 sec bins |
 |
 |
| Module-wise count rates for Quadrant D Data is divided into 100 sec bins |
 |
 |
| Parameter | Plot |
|---|---|
| CZT HV Monitor | 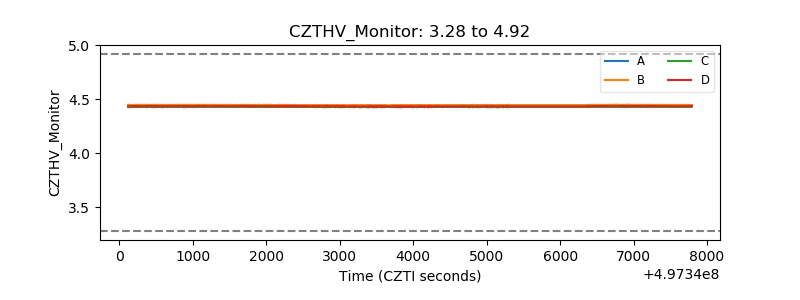 |
| D_VDD | 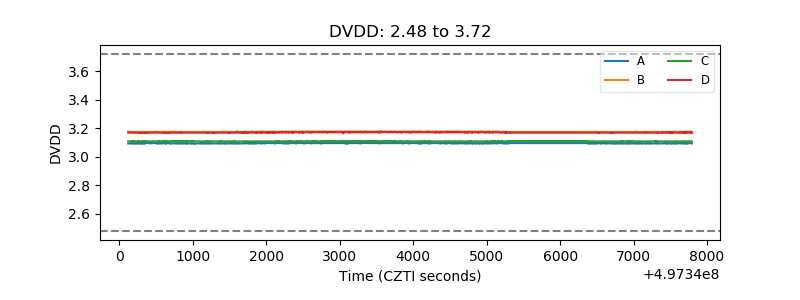 |
| Temperature 1 | 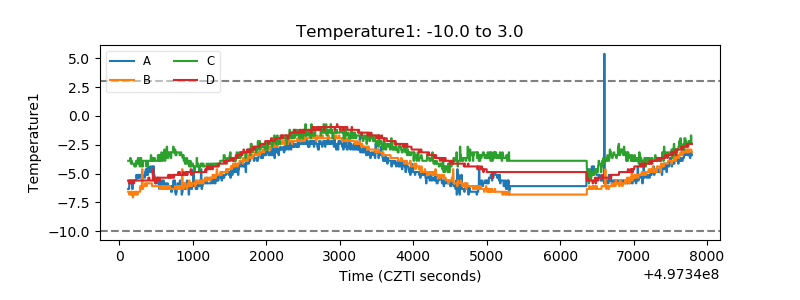 |
| Veto HV Monitor |  |
| Veto LLD | 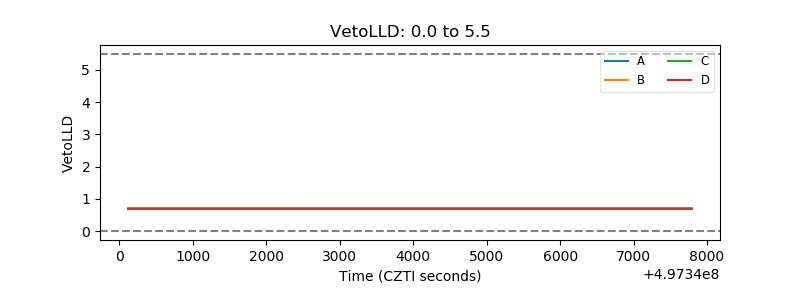 |
| Alpha Counter | 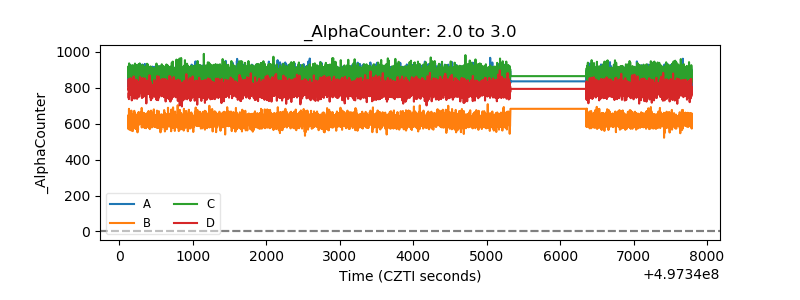 |
| _CPM_Rate | 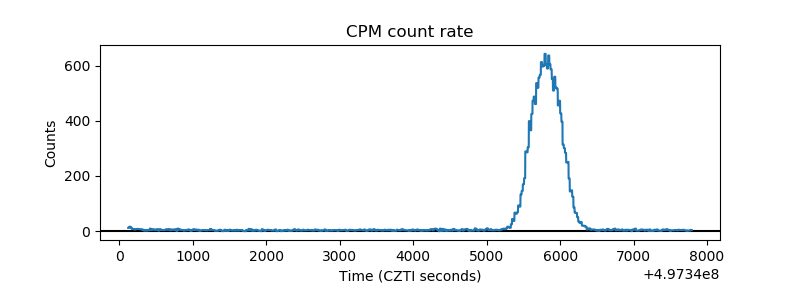 |
| CZT Counter | 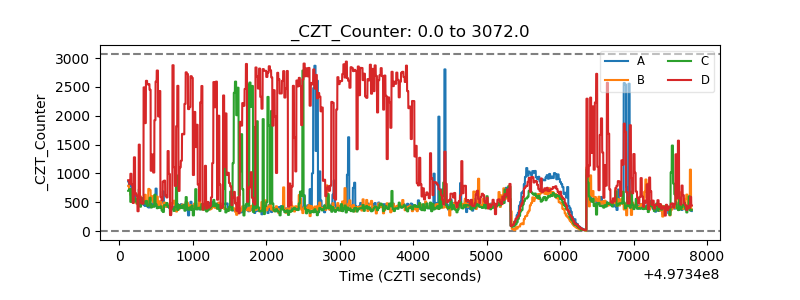 |
| +2.5 Volts monitor |  |
| +5 Volts monitor |  |
| _ROLL_ROT | 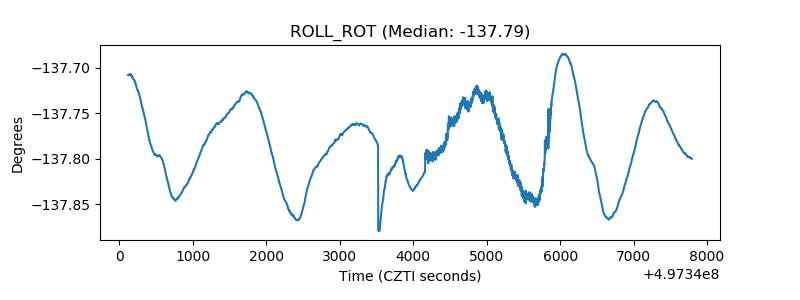 |
| _Roll_DEC | 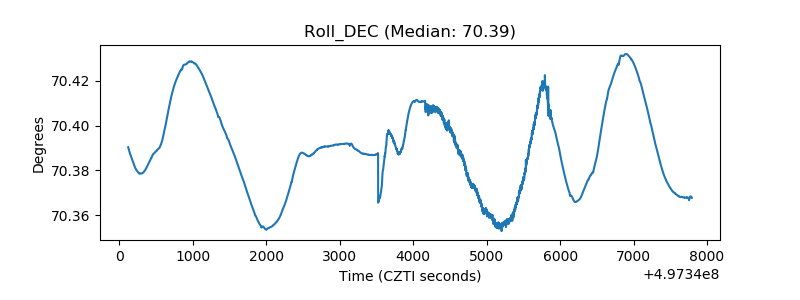 |
| _Roll_RA | 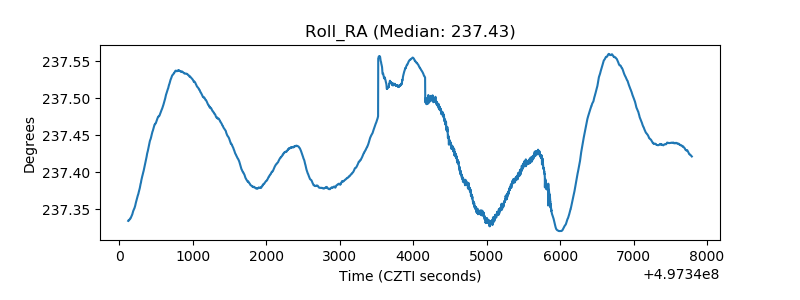 |
| Veto Counter | 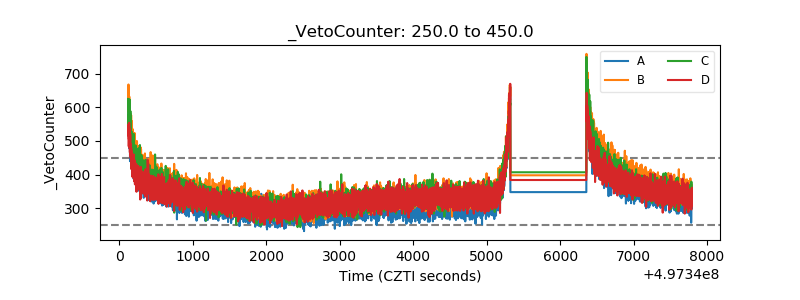 |