| Param | Original file | Final file |
|---|---|---|
| Filename | modeM0/AS1C09_004T08_9000006514_54210cztM0_level2.fits | modeM0/AS1C09_004T08_9000006514_54210cztM0_level2_quad_clean.evt |
| Size (bytes) | 438,338,880 | 88,358,400 |
| Size | 418.0 MB | 84.3 MB |
| Events in quadrant A | 2,987,001 | 597,744 |
| Events in quadrant B | 2,867,204 | 654,471 |
| Events in quadrant C | 2,945,062 | 559,422 |
| Events in quadrant D | 6,956,804 | 441,920 |
| Mode M0 | |||
|---|---|---|---|
| Quadrant | BADHDUFLAG | Total packets | Discarded packets |
| A | 0 | 13204 | 1 |
| B | 0 | 12865 | 1 |
| C | 0 | 13362 | 1 |
| D | 0 | 24812 | 1 |
| Mode M9 | |||
|---|---|---|---|
| Quadrant | BADHDUFLAG | Total packets | Discarded packets |
| A | 0 | 11 | 0 |
| B | 0 | 11 | 0 |
| C | 0 | 11 | 0 |
| D | 0 | 11 | 0 |
| Mode SS | |||
|---|---|---|---|
| Quadrant | BADHDUFLAG | Total packets | Discarded packets |
| A | 0 | 124 | 0 |
| B | 0 | 124 | 0 |
| C | 0 | 124 | 0 |
| D | 0 | 124 | 0 |
| Quadrant | Total seconds | Saturated seconds | Saturation percentage |
|---|---|---|---|
| A | 6036 | 132 | 2.186879% |
| B | 6037 | 53 | 0.877919% |
| C | 6037 | 84 | 1.391420% |
| D | 6037 | 1207 | 19.993374% |
Noise dominated data is calculated using 1-second bins in cleaned event files. If a bin has >2000 counts, and if more than 50% of those come from <1% of pixels, then it is considered to be noise-dominated and hence unusable.
| Quadrant | # 1 sec bins | Bins with >0 counts | Bins with >2000 counts | High rate bins dominated by noise | Noise dominated (total time) | Noise dominated (detector-on time) | Marked lightcurve |
|---|---|---|---|---|---|---|---|
| A | 7146 | 6036 | 80 | 80 | 1.12% | 1.33% | 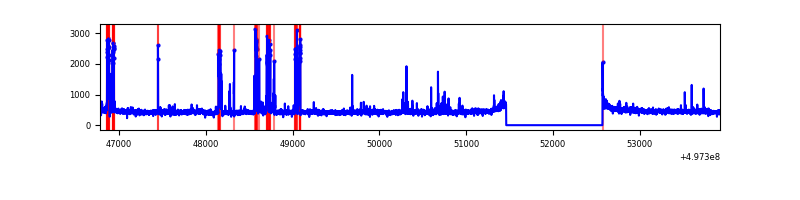 |
| B | 7147 | 6037 | 5 | 5 | 0.07% | 0.08% | 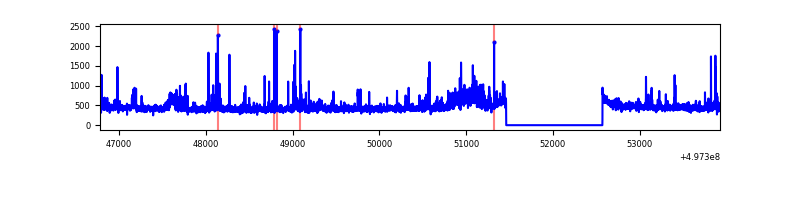 |
| C | 7147 | 6038 | 72 | 72 | 1.01% | 1.19% | 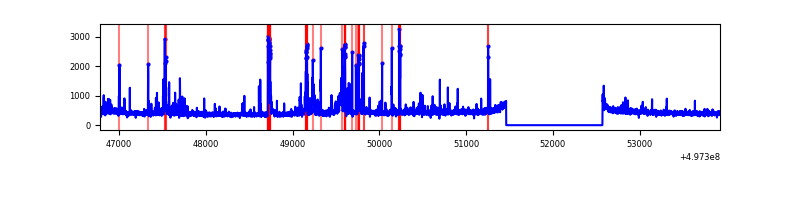 |
| D | 7147 | 6038 | 1247 | 1247 | 17.45% | 20.65% | 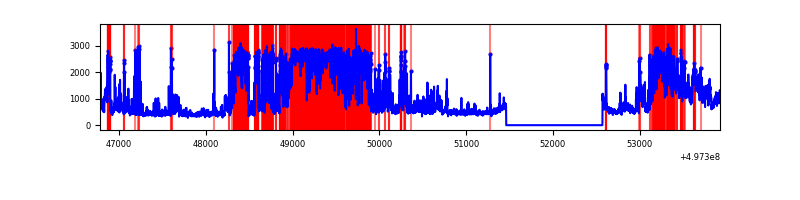 |
Top three noisy pixels from each quadrant. If the there are fewer than three noisy pixels in the level2.evt file, extra rows are filled as -1
| Pixel properties | Quadrant properties | ||||||
|---|---|---|---|---|---|---|---|
| Quadrant | DetID | PixID | Counts | Sigma | Mean | Median | Sigma |
| A | 15 | 174 | 150037 | 920.62 | 650 | 635 | 162.3 |
| A | 0 | 8 | 91349 | 558.98 | 650 | 635 | 162.3 |
| A | 8 | 253 | 74804 | 457.03 | 650 | 635 | 162.3 |
| B | 4 | 67 | 154361 | 1117.23 | 641 | 620 | 137.6 |
| B | 0 | 213 | 40853 | 292.37 | 641 | 620 | 137.6 |
| B | 4 | 81 | 21155 | 149.23 | 641 | 620 | 137.6 |
| C | 1 | 241 | 156816 | 915.48 | 618 | 611 | 170.6 |
| C | 12 | 2 | 139371 | 813.24 | 618 | 611 | 170.6 |
| C | 1 | 44 | 62985 | 365.56 | 618 | 611 | 170.6 |
| D | 8 | 176 | 3594949 | 21892.02 | 574 | 548 | 164.2 |
| D | 11 | 247 | 565605 | 3441.53 | 574 | 548 | 164.2 |
| D | 2 | 172 | 161830 | 982.3 | 574 | 548 | 164.2 |
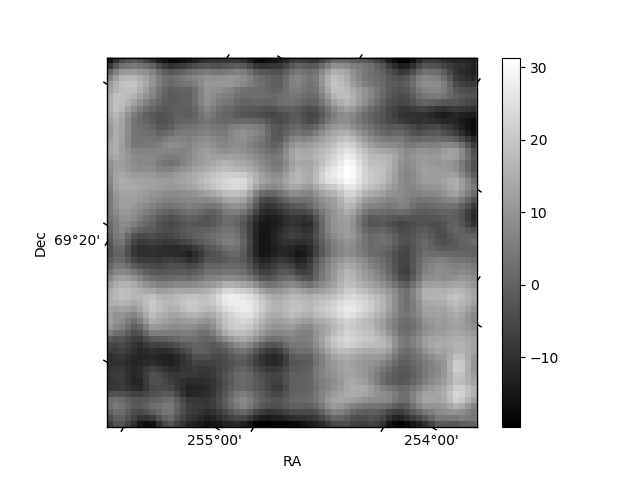
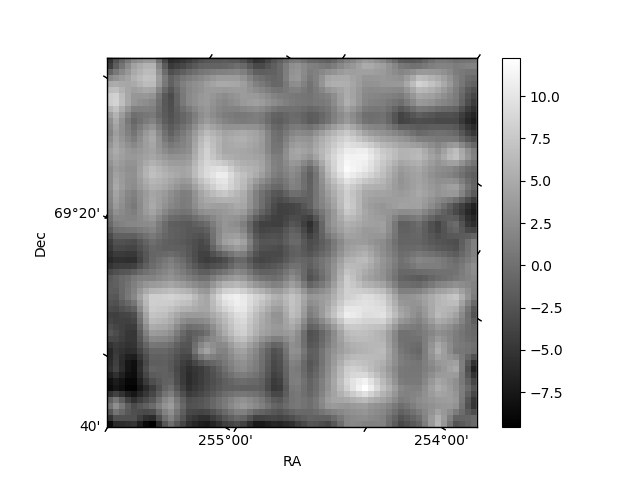
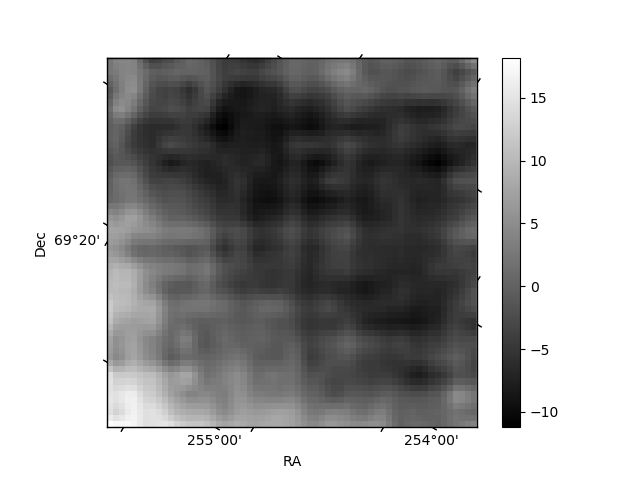
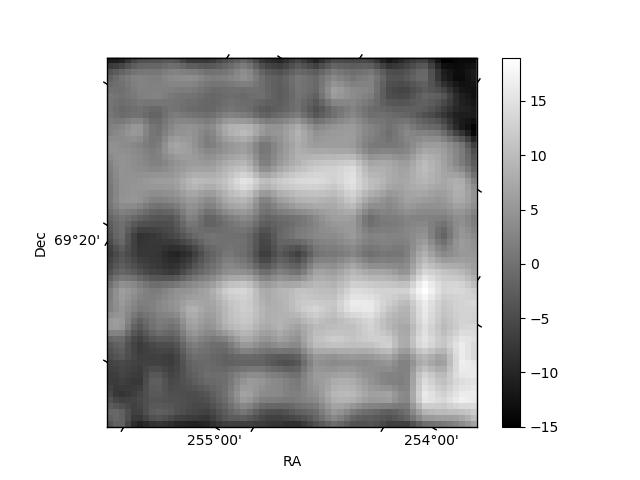
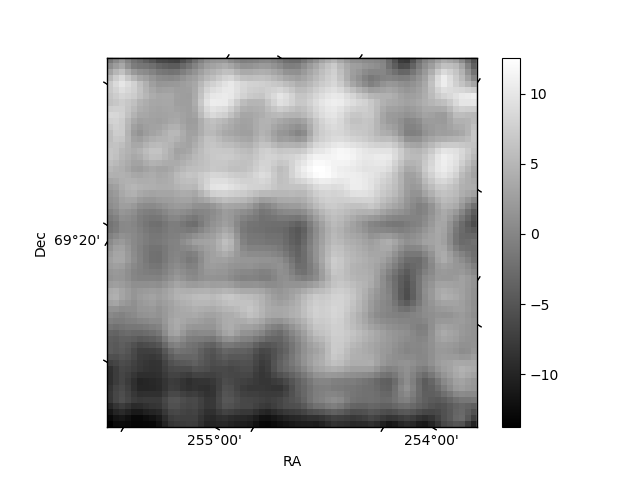
Histogram calculated using DETX and DETY for each event in the final _common_clean file
| Quadrant A | 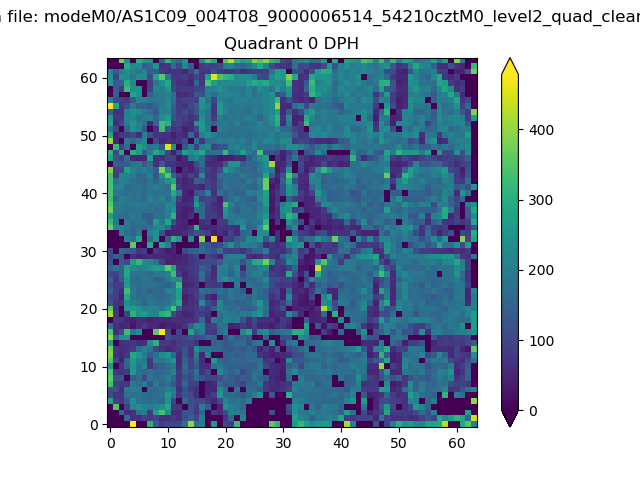 |
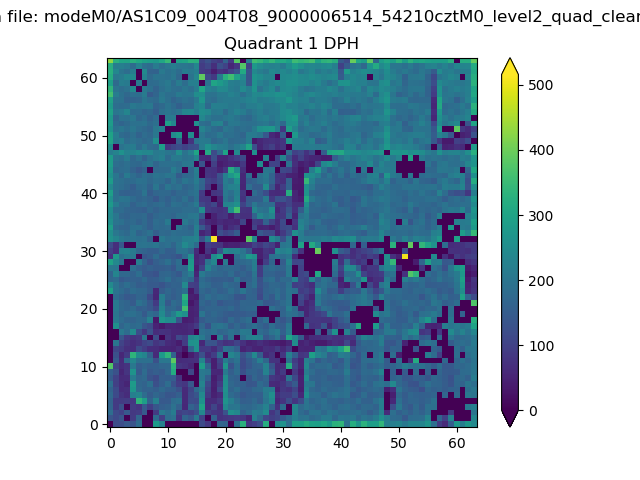 |
Quadrant B |
|---|---|---|---|
| Quadrant D | 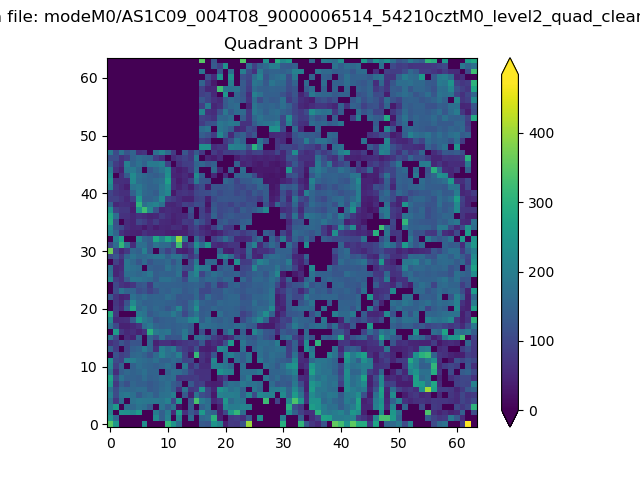 |
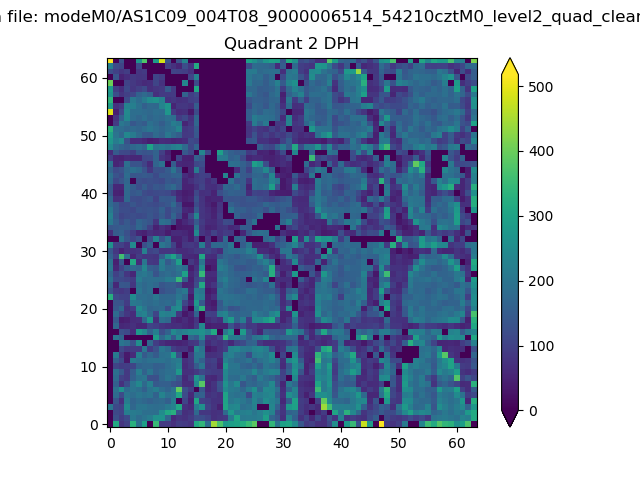 |
Quadrant C |
| Plot type | Count rate plots | Images |
|---|---|---|
| Comparison with Poisson distribution Blue bars denote a histogram of data divided into 1 sec bins. Red curve is a Poisson curve with rate = median count rate of data. |
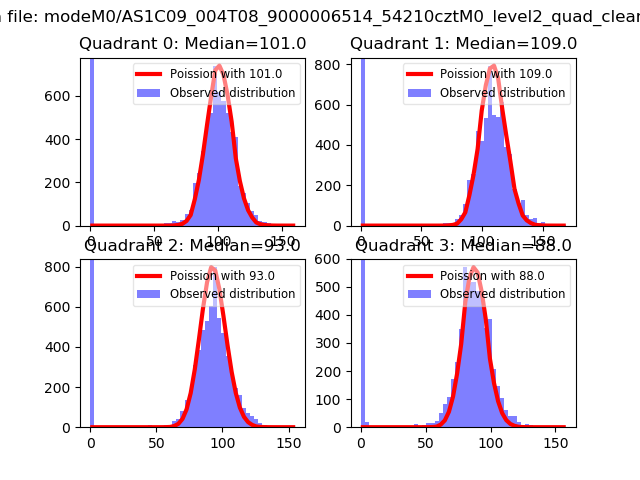 |
 |
| Quadrant-wise count rates Data is divided into 100 sec bins |
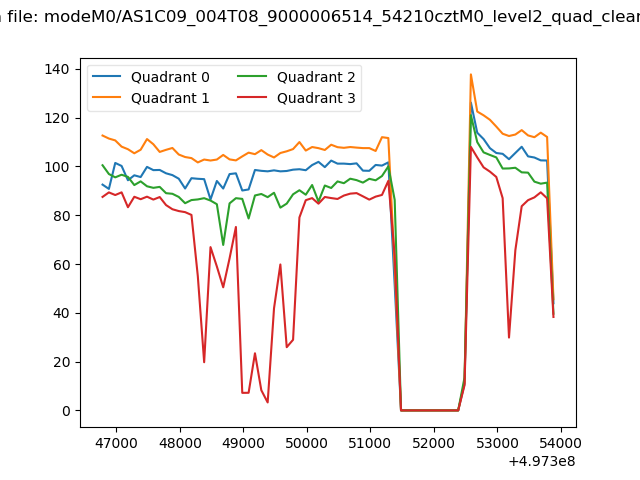 |
|
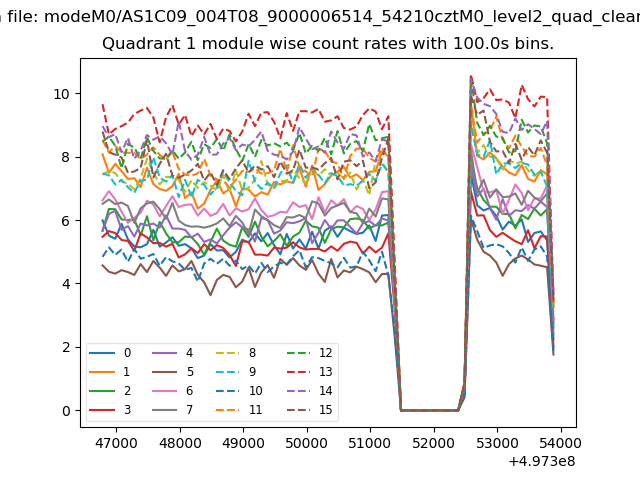
| Module-wise count rates for Quadrant A Data is divided into 100 sec bins |
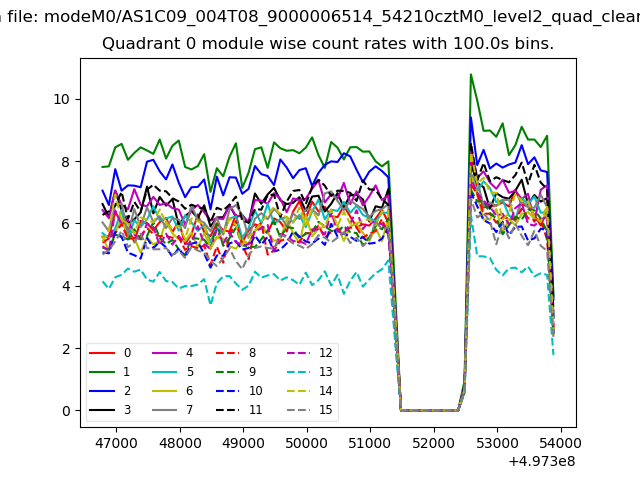 |
 |
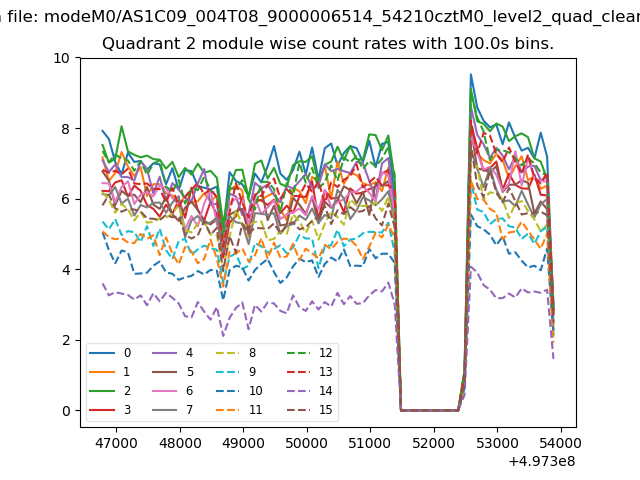
| Module-wise count rates for Quadrant B Data is divided into 100 sec bins |
 |
 |
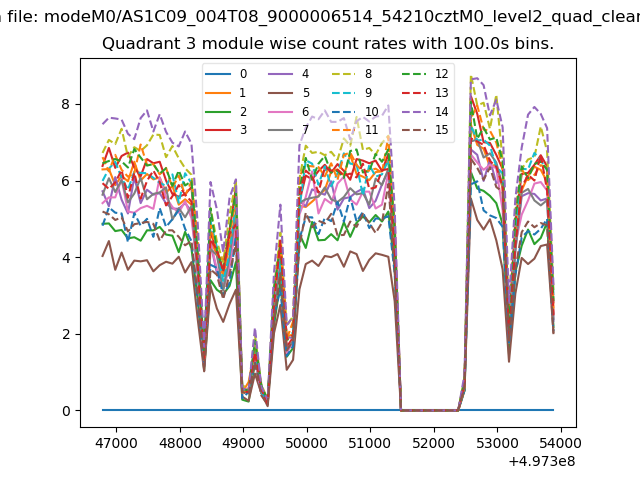
| Module-wise count rates for Quadrant C Data is divided into 100 sec bins |
 |
 |
| Module-wise count rates for Quadrant D Data is divided into 100 sec bins |
 |
 |
| Parameter | Plot |
|---|---|
| CZT HV Monitor | 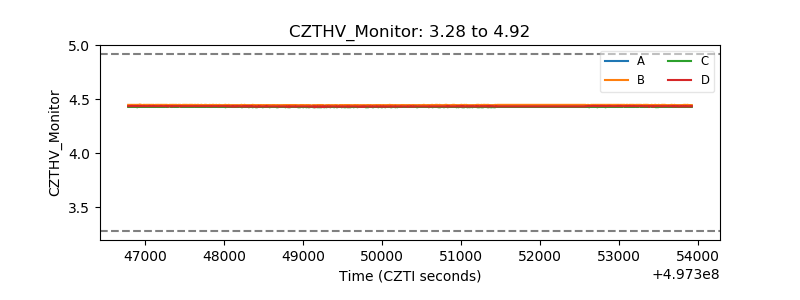 |
| D_VDD | 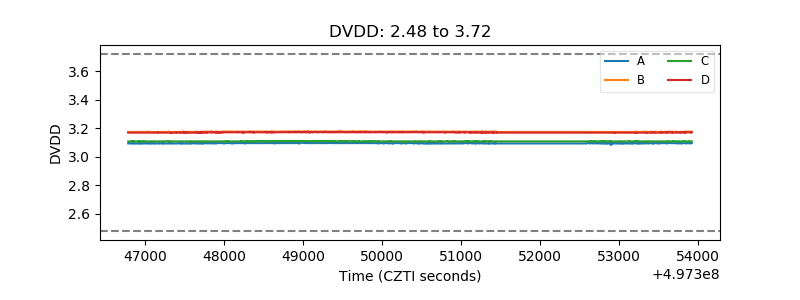 |
| Temperature 1 | 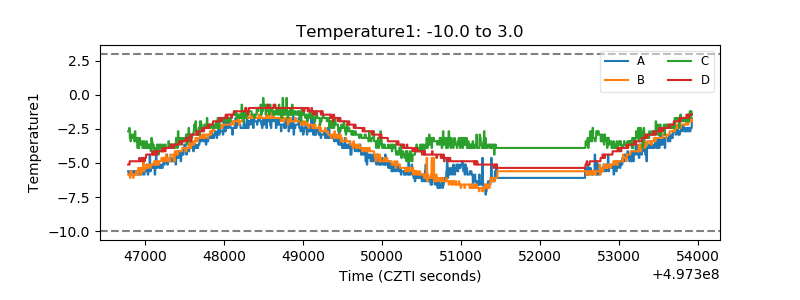 |
| Veto HV Monitor | 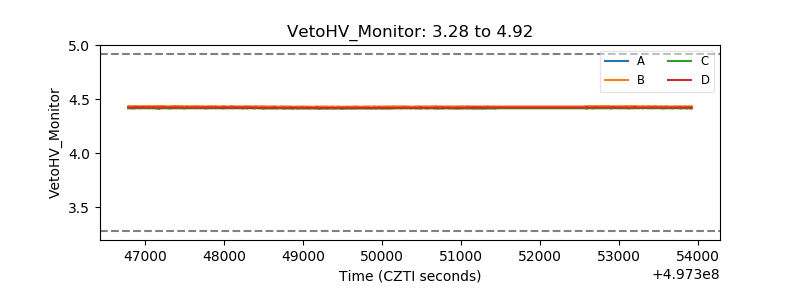 |
| Veto LLD | 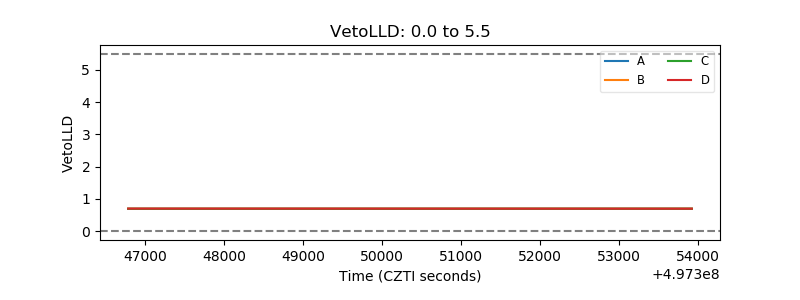 |
| Alpha Counter | 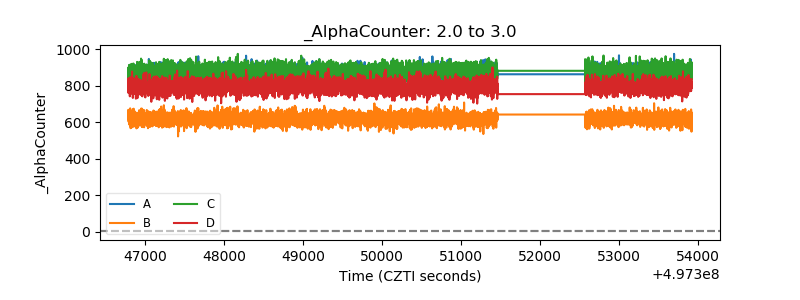 |
| _CPM_Rate | 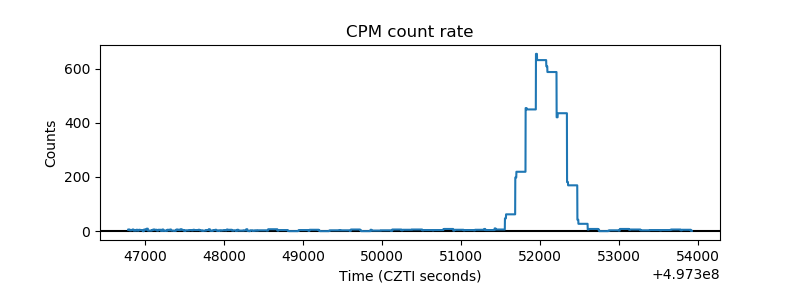 |
| CZT Counter | 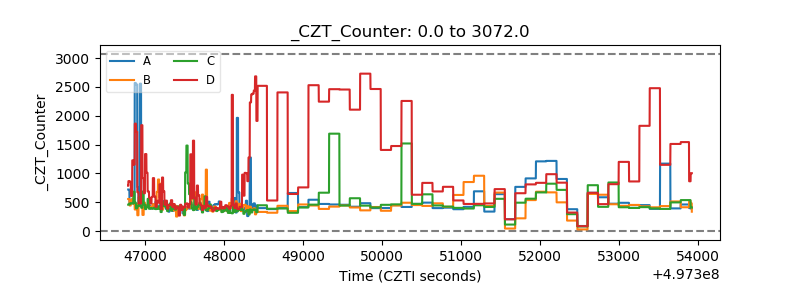 |
| +2.5 Volts monitor | 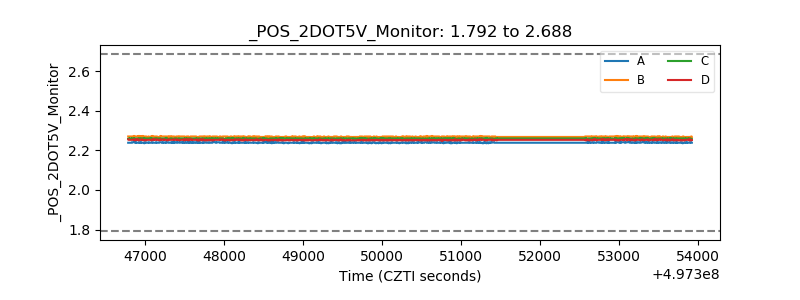 |
| +5 Volts monitor |  |
| _ROLL_ROT | 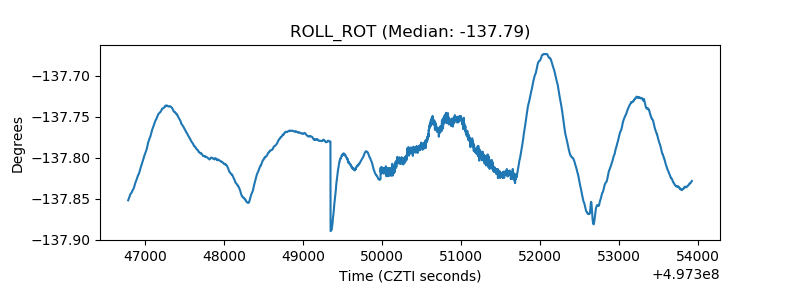 |
| _Roll_DEC | 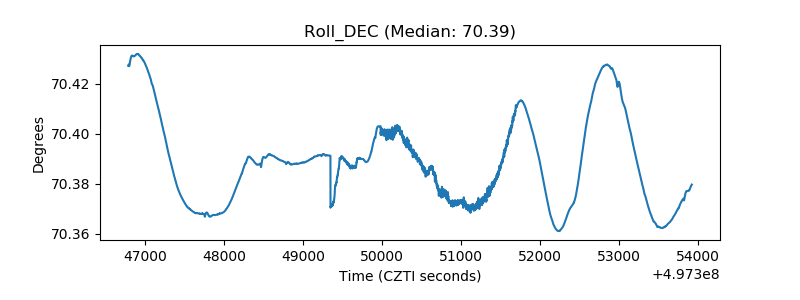 |
| _Roll_RA | 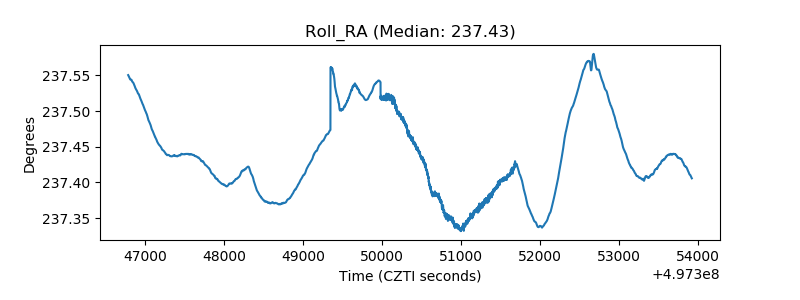 |
| Veto Counter | 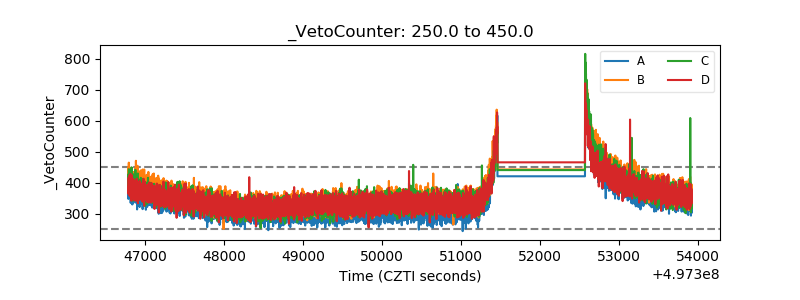 |