| Param | Original file | Final file |
|---|---|---|
| Filename | modeM0/AS1C09_004T08_9000006514_54211cztM0_level2.fits | modeM0/AS1C09_004T08_9000006514_54211cztM0_level2_quad_clean.evt |
| Size (bytes) | 453,571,200 | 90,273,600 |
| Size | 432.6 MB | 86.1 MB |
| Events in quadrant A | 2,770,917 | 621,586 |
| Events in quadrant B | 3,389,154 | 654,466 |
| Events in quadrant C | 2,726,444 | 576,051 |
| Events in quadrant D | 7,425,801 | 452,658 |
| Mode M0 | |||
|---|---|---|---|
| Quadrant | BADHDUFLAG | Total packets | Discarded packets |
| A | 0 | 12605 | 1 |
| B | 0 | 14261 | 1 |
| C | 0 | 12836 | 1 |
| D | 0 | 26272 | 1 |
| Mode M9 | |||
|---|---|---|---|
| Quadrant | BADHDUFLAG | Total packets | Discarded packets |
| A | 0 | 11 | 0 |
| B | 0 | 11 | 0 |
| C | 0 | 11 | 0 |
| D | 0 | 11 | 0 |
| Mode SS | |||
|---|---|---|---|
| Quadrant | BADHDUFLAG | Total packets | Discarded packets |
| A | 0 | 126 | 0 |
| B | 0 | 126 | 0 |
| C | 0 | 126 | 0 |
| D | 0 | 126 | 0 |
| Quadrant | Total seconds | Saturated seconds | Saturation percentage |
|---|---|---|---|
| A | 6137 | 61 | 0.993971% |
| B | 6138 | 216 | 3.519062% |
| C | 6138 | 53 | 0.863473% |
| D | 6138 | 1255 | 20.446399% |
Noise dominated data is calculated using 1-second bins in cleaned event files. If a bin has >2000 counts, and if more than 50% of those come from <1% of pixels, then it is considered to be noise-dominated and hence unusable.
| Quadrant | # 1 sec bins | Bins with >0 counts | Bins with >2000 counts | High rate bins dominated by noise | Noise dominated (total time) | Noise dominated (detector-on time) | Marked lightcurve |
|---|---|---|---|---|---|---|---|
| A | 7247 | 6137 | 2 | 2 | 0.03% | 0.03% | 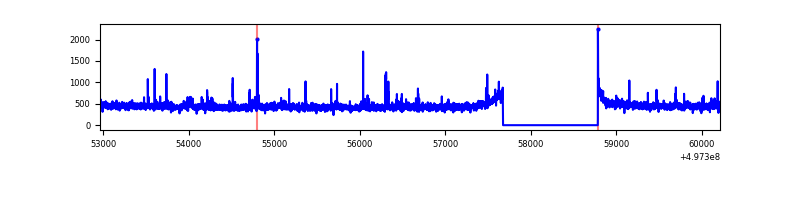 |
| B | 7248 | 6138 | 123 | 123 | 1.70% | 2.00% | 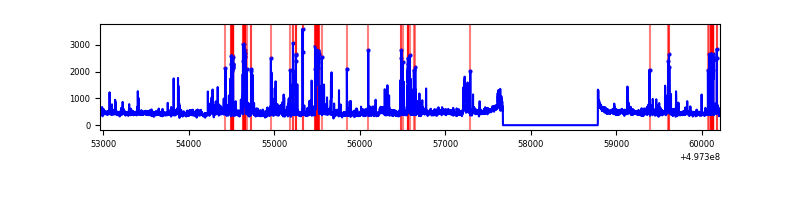 |
| C | 7248 | 6138 | 9 | 9 | 0.12% | 0.15% | 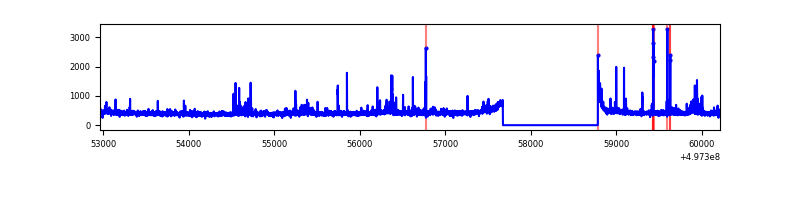 |
| D | 7248 | 6138 | 1361 | 1361 | 18.78% | 22.17% | 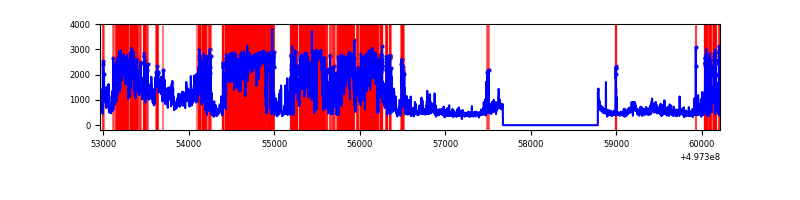 |
Top three noisy pixels from each quadrant. If the there are fewer than three noisy pixels in the level2.evt file, extra rows are filled as -1
| Pixel properties | Quadrant properties | ||||||
|---|---|---|---|---|---|---|---|
| Quadrant | DetID | PixID | Counts | Sigma | Mean | Median | Sigma |
| A | 4 | 3 | 62041 | 371.61 | 667 | 648 | 165.2 |
| A | 10 | 253 | 27344 | 161.59 | 667 | 648 | 165.2 |
| A | 3 | 110 | 16815 | 97.86 | 667 | 648 | 165.2 |
| B | 5 | 236 | 366673 | 2666.32 | 648 | 625 | 137.3 |
| B | 4 | 81 | 97434 | 705.16 | 648 | 625 | 137.3 |
| B | 10 | 245 | 92867 | 671.9 | 648 | 625 | 137.3 |
| C | 12 | 252 | 53028 | 296.54 | 638 | 631 | 176.7 |
| C | 14 | 254 | 46300 | 258.46 | 638 | 631 | 176.7 |
| C | 15 | 233 | 24556 | 135.4 | 638 | 631 | 176.7 |
| D | 8 | 176 | 2792668 | 16414.5 | 599 | 573 | 170.1 |
| D | 11 | 247 | 1838621 | 10805.73 | 599 | 573 | 170.1 |
| D | 2 | 172 | 93204 | 544.57 | 599 | 573 | 170.1 |
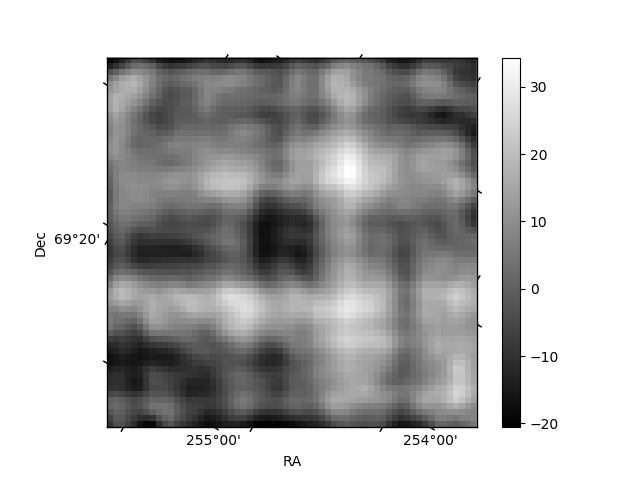
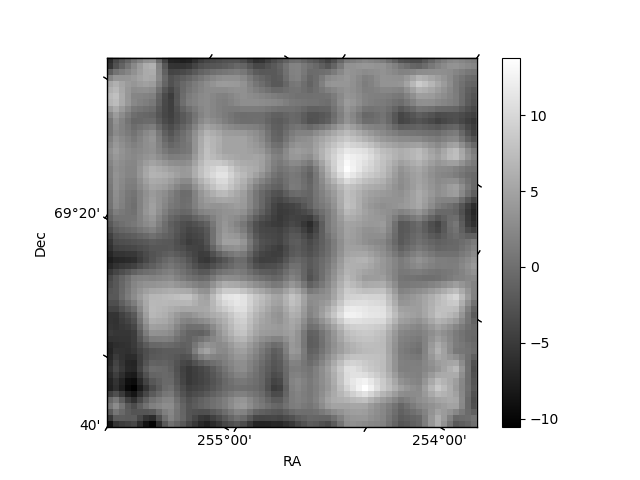
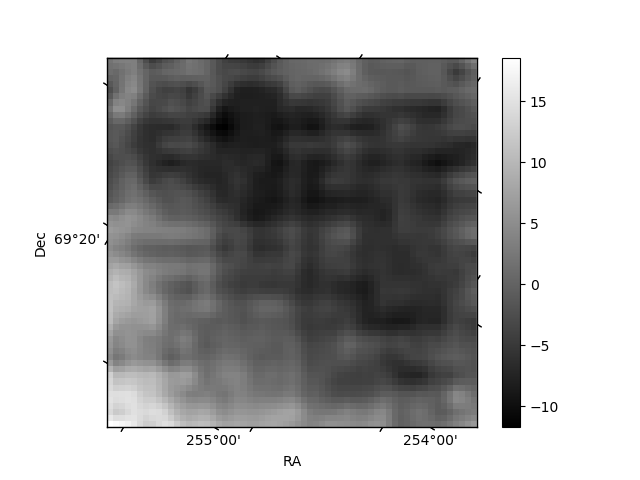
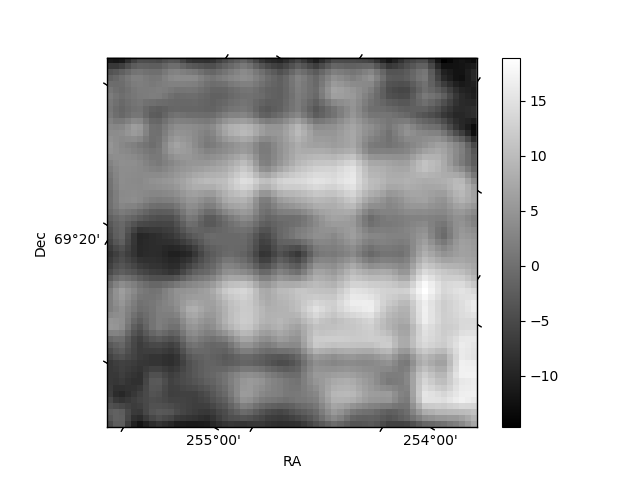
Histogram calculated using DETX and DETY for each event in the final _common_clean file
| Quadrant A | 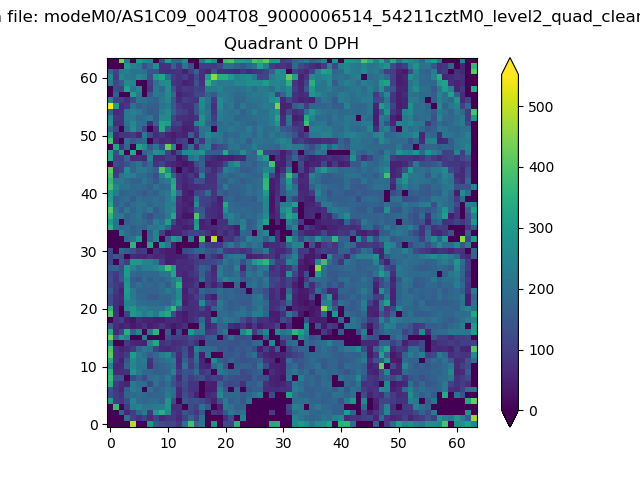 |
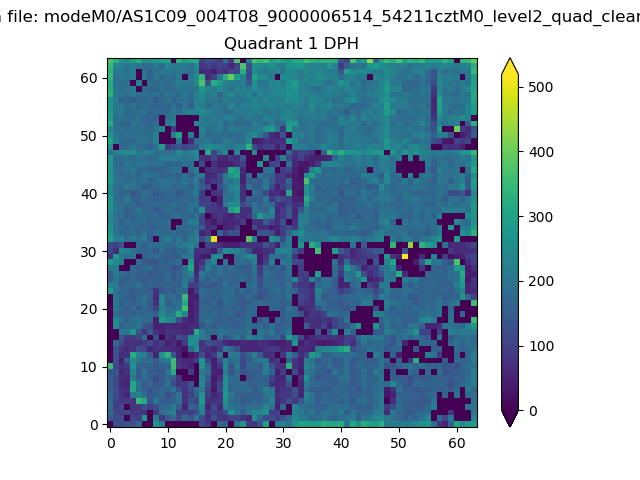 |
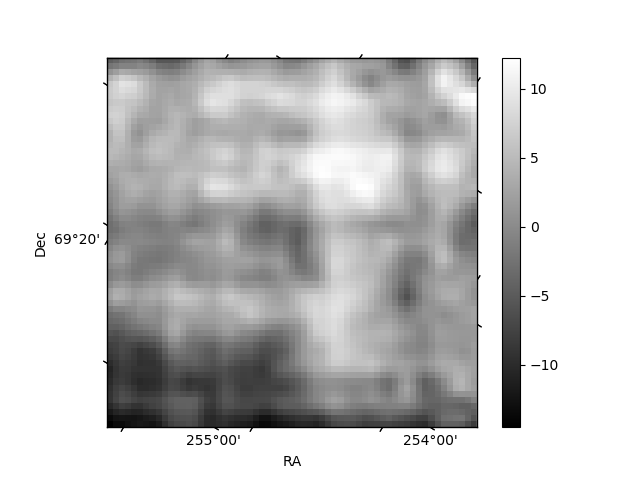
Quadrant B |
|---|---|---|---|
| Quadrant D | 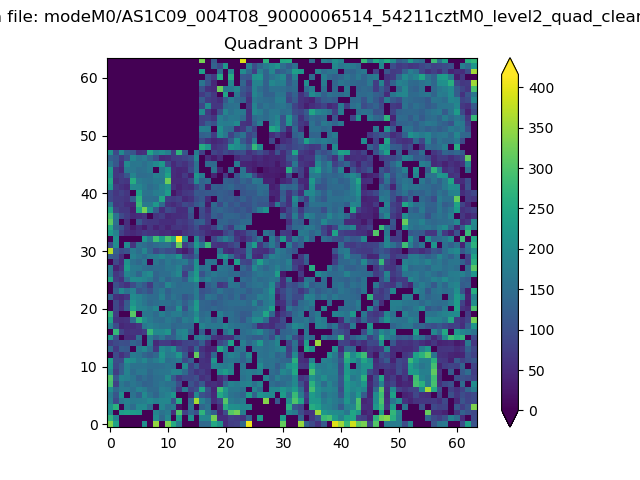 |
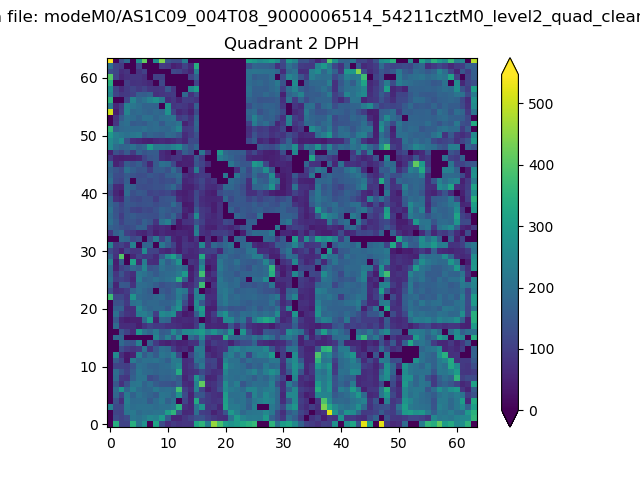 |
Quadrant C |
| Plot type | Count rate plots | Images |
|---|---|---|
| Comparison with Poisson distribution Blue bars denote a histogram of data divided into 1 sec bins. Red curve is a Poisson curve with rate = median count rate of data. |
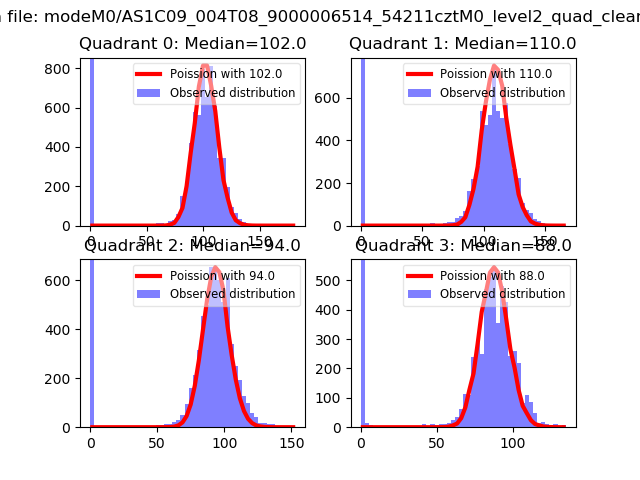 |
 |
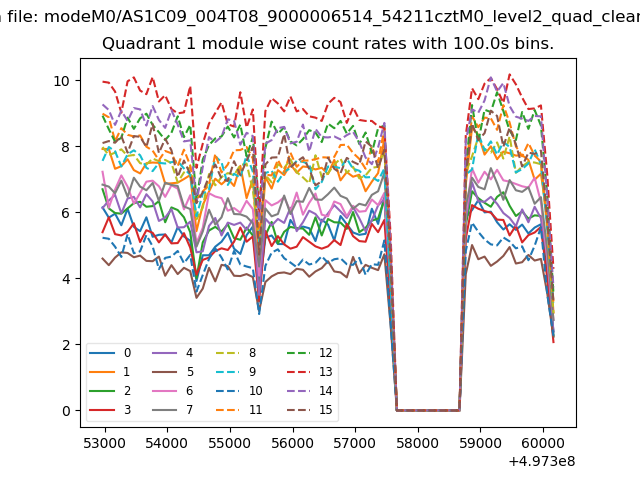
| Quadrant-wise count rates Data is divided into 100 sec bins |
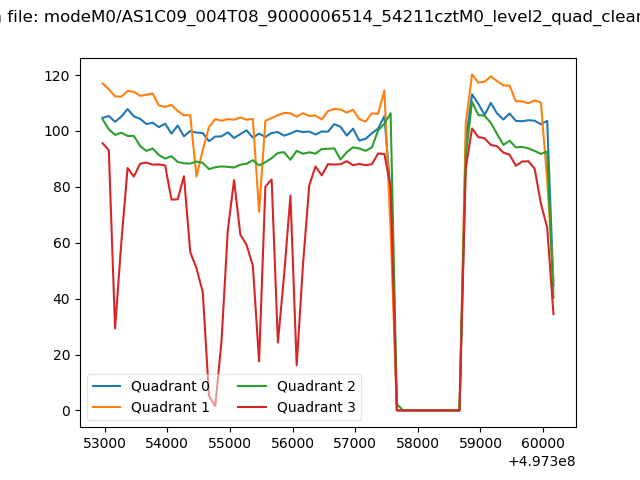 |
|
| Module-wise count rates for Quadrant A Data is divided into 100 sec bins |
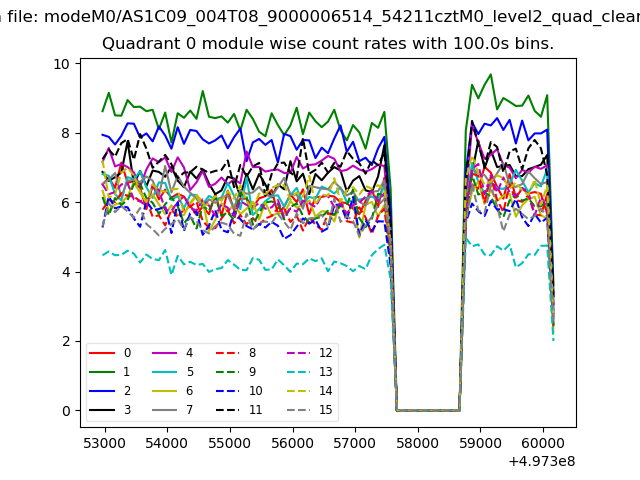 |
 |
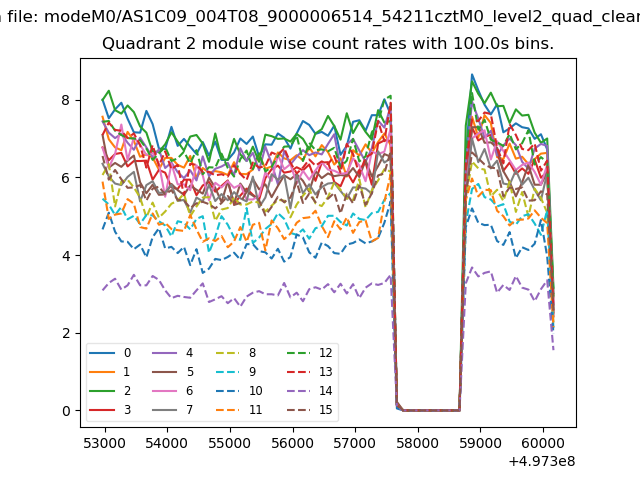
| Module-wise count rates for Quadrant B Data is divided into 100 sec bins |
 |
 |
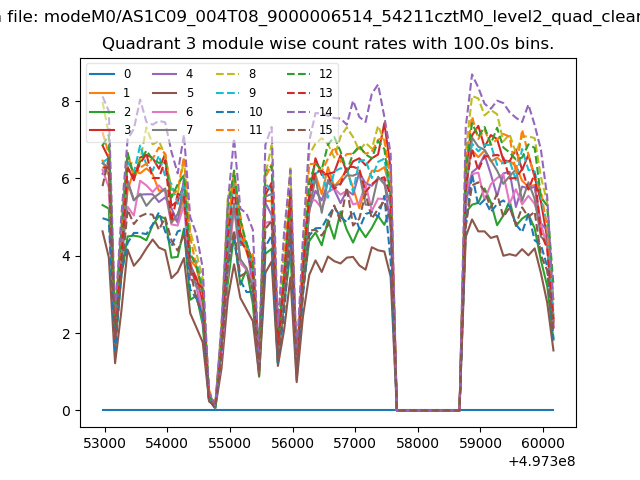
| Module-wise count rates for Quadrant C Data is divided into 100 sec bins |
 |
 |
| Module-wise count rates for Quadrant D Data is divided into 100 sec bins |
 |
 |
| Parameter | Plot |
|---|---|
| CZT HV Monitor | 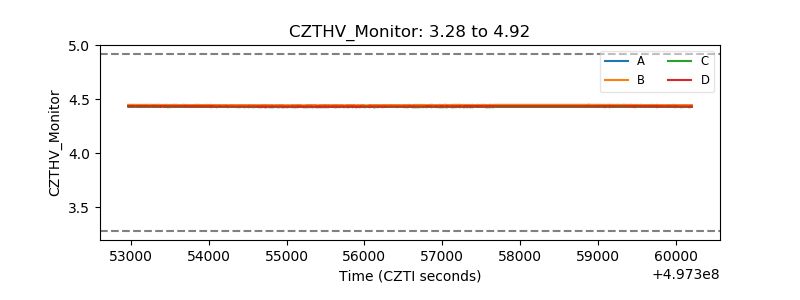 |
| D_VDD | 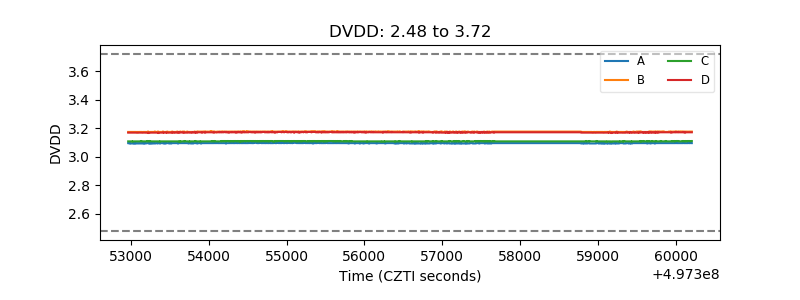 |
| Temperature 1 | 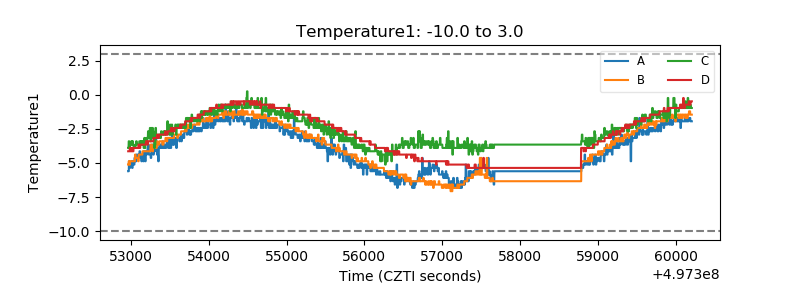 |
| Veto HV Monitor | 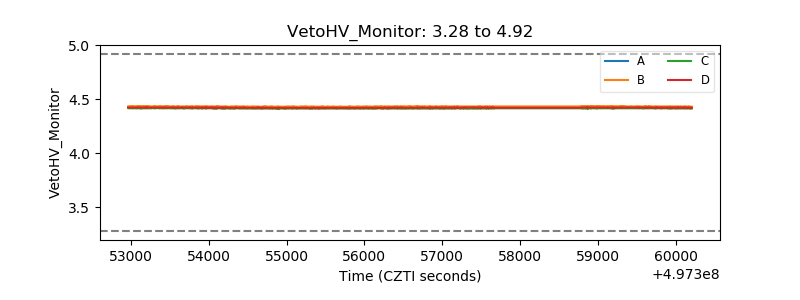 |
| Veto LLD | 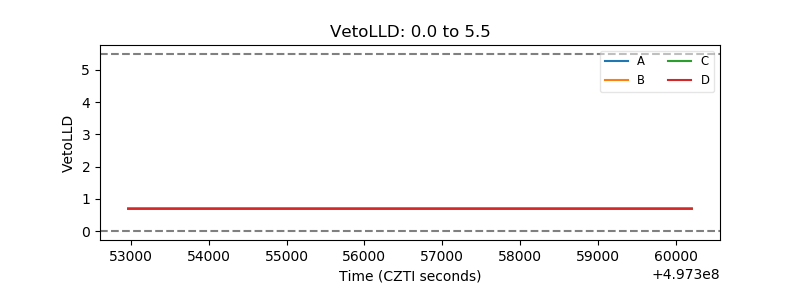 |
| Alpha Counter | 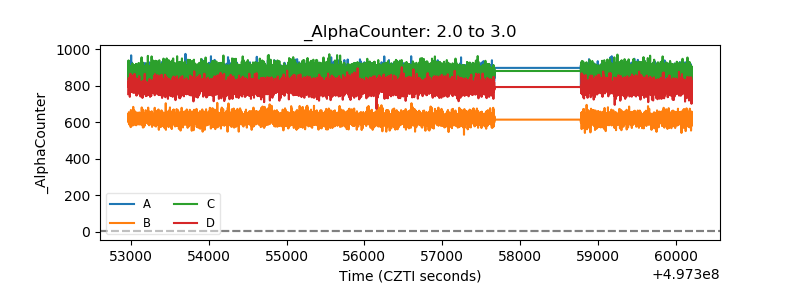 |
| _CPM_Rate | 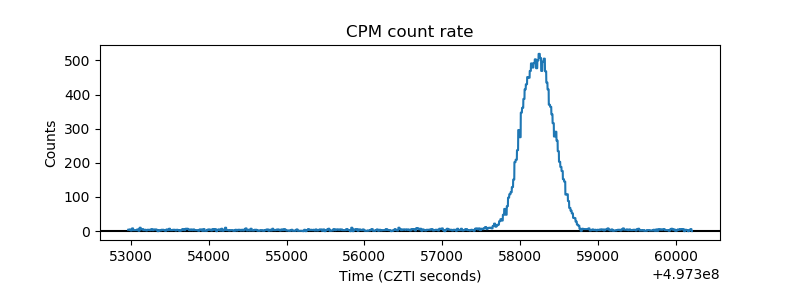 |
| CZT Counter | 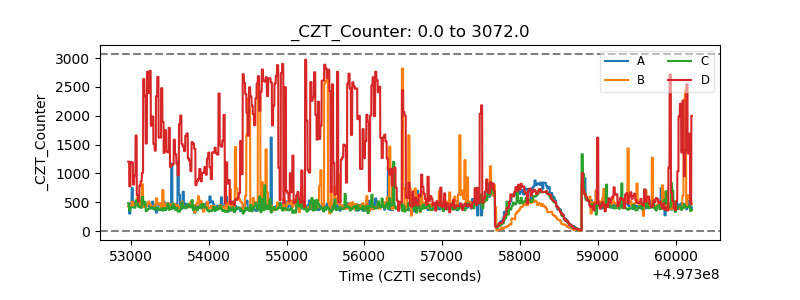 |
| +2.5 Volts monitor | 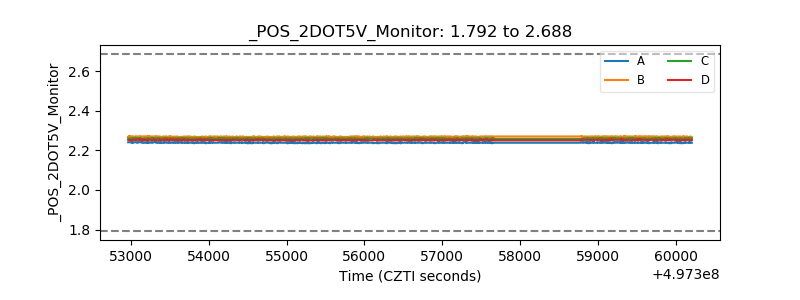 |
| +5 Volts monitor | 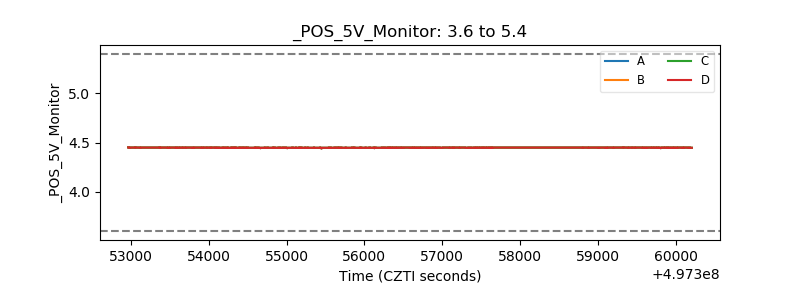 |
| _ROLL_ROT | 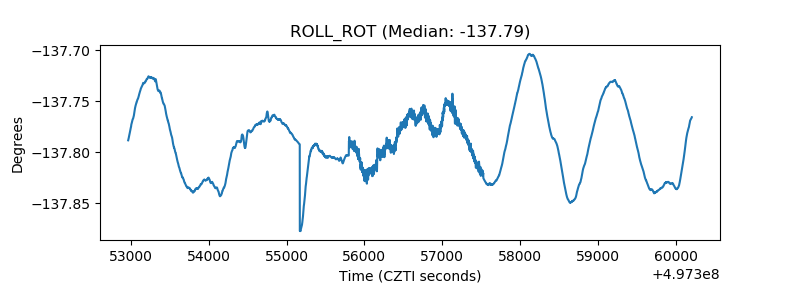 |
| _Roll_DEC | 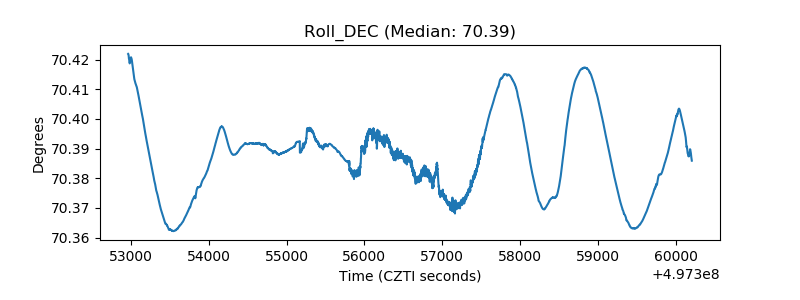 |
| _Roll_RA | 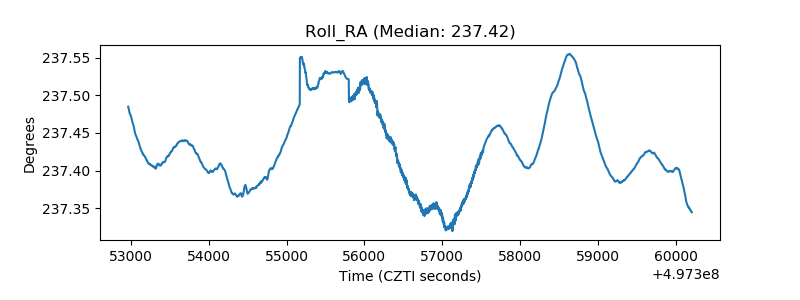 |
| Veto Counter | 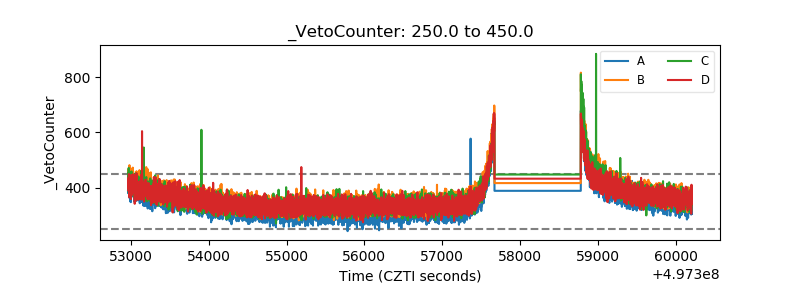 |