| Param | Original file | Final file |
|---|---|---|
| Filename | modeM0/AS1C09_004T08_9000006514_54212cztM0_level2.fits | modeM0/AS1C09_004T08_9000006514_54212cztM0_level2_quad_clean.evt |
| Size (bytes) | 482,353,920 | 91,146,240 |
| Size | 460.0 MB | 86.9 MB |
| Events in quadrant A | 4,232,450 | 589,272 |
| Events in quadrant B | 3,586,802 | 674,225 |
| Events in quadrant C | 2,964,327 | 583,155 |
| Events in quadrant D | 6,580,123 | 472,449 |
| Mode M0 | |||
|---|---|---|---|
| Quadrant | BADHDUFLAG | Total packets | Discarded packets |
| A | 0 | 17035 | 1 |
| B | 0 | 15046 | 1 |
| C | 0 | 13693 | 1 |
| D | 0 | 23863 | 1 |
| Mode M9 | |||
|---|---|---|---|
| Quadrant | BADHDUFLAG | Total packets | Discarded packets |
| A | 0 | 11 | 0 |
| B | 0 | 11 | 0 |
| C | 0 | 11 | 0 |
| D | 0 | 11 | 0 |
| Mode SS | |||
|---|---|---|---|
| Quadrant | BADHDUFLAG | Total packets | Discarded packets |
| A | 0 | 128 | 0 |
| B | 0 | 128 | 0 |
| C | 0 | 128 | 0 |
| D | 0 | 128 | 0 |
| Quadrant | Total seconds | Saturated seconds | Saturation percentage |
|---|---|---|---|
| A | 6317 | 568 | 8.991610% |
| B | 6318 | 177 | 2.801519% |
| C | 6318 | 87 | 1.377018% |
| D | 6318 | 1087 | 17.204812% |
Noise dominated data is calculated using 1-second bins in cleaned event files. If a bin has >2000 counts, and if more than 50% of those come from <1% of pixels, then it is considered to be noise-dominated and hence unusable.
| Quadrant | # 1 sec bins | Bins with >0 counts | Bins with >2000 counts | High rate bins dominated by noise | Noise dominated (total time) | Noise dominated (detector-on time) | Marked lightcurve |
|---|---|---|---|---|---|---|---|
| A | 7387 | 6317 | 472 | 472 | 6.39% | 7.47% | 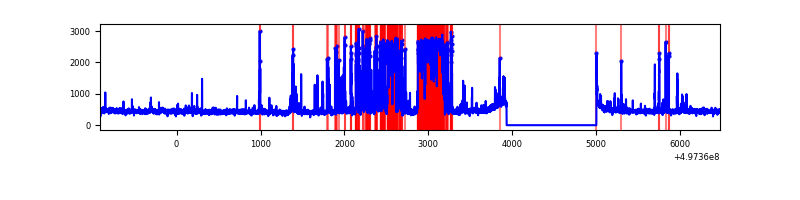 |
| B | 7388 | 6318 | 49 | 49 | 0.66% | 0.78% | 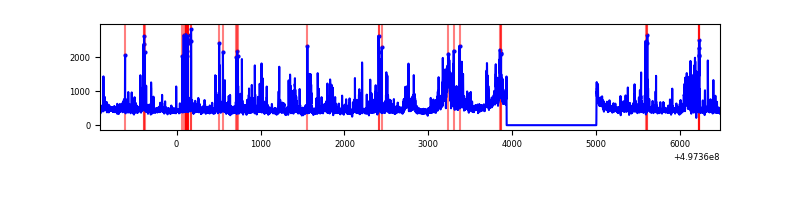 |
| C | 7388 | 6318 | 67 | 67 | 0.91% | 1.06% | 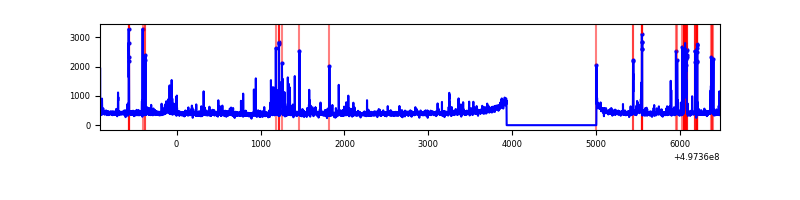 |
| D | 7388 | 6318 | 1106 | 1106 | 14.97% | 17.51% | 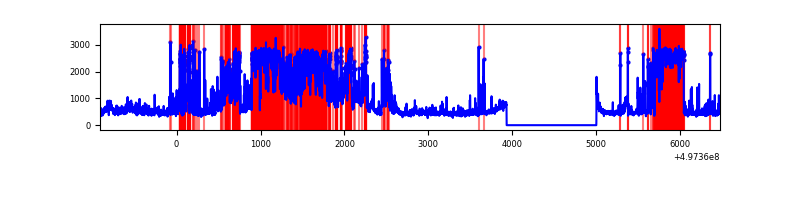 |
Top three noisy pixels from each quadrant. If the there are fewer than three noisy pixels in the level2.evt file, extra rows are filled as -1
| Pixel properties | Quadrant properties | ||||||
|---|---|---|---|---|---|---|---|
| Quadrant | DetID | PixID | Counts | Sigma | Mean | Median | Sigma |
| A | 7 | 29 | 1446186 | 8829.59 | 654 | 637 | 163.7 |
| A | 4 | 3 | 61515 | 371.85 | 654 | 637 | 163.7 |
| A | 0 | 8 | 58872 | 355.71 | 654 | 637 | 163.7 |
| B | 4 | 67 | 231387 | 1644.21 | 666 | 643 | 140.3 |
| B | 4 | 171 | 217933 | 1548.34 | 666 | 643 | 140.3 |
| B | 5 | 236 | 118505 | 839.85 | 666 | 643 | 140.3 |
| C | 12 | 252 | 251210 | 1399.79 | 650 | 641 | 179.0 |
| C | 14 | 254 | 71291 | 394.68 | 650 | 641 | 179.0 |
| C | 15 | 233 | 26101 | 142.23 | 650 | 641 | 179.0 |
| D | 8 | 176 | 3616000 | 20949.91 | 610 | 583 | 172.6 |
| D | 3 | 12 | 215761 | 1246.87 | 610 | 583 | 172.6 |
| D | 1 | 3 | 56339 | 323.08 | 610 | 583 | 172.6 |
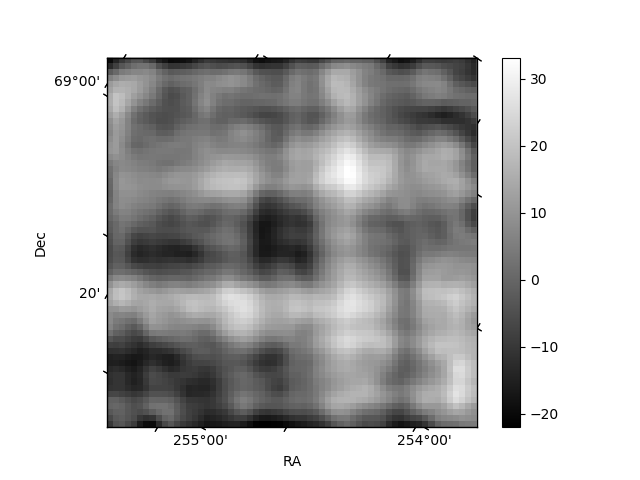
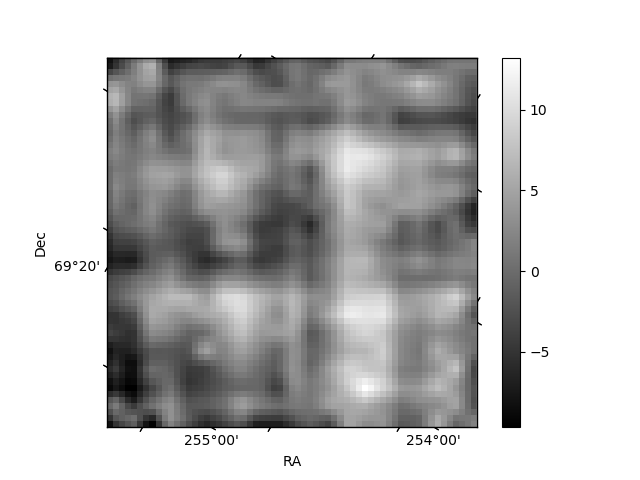
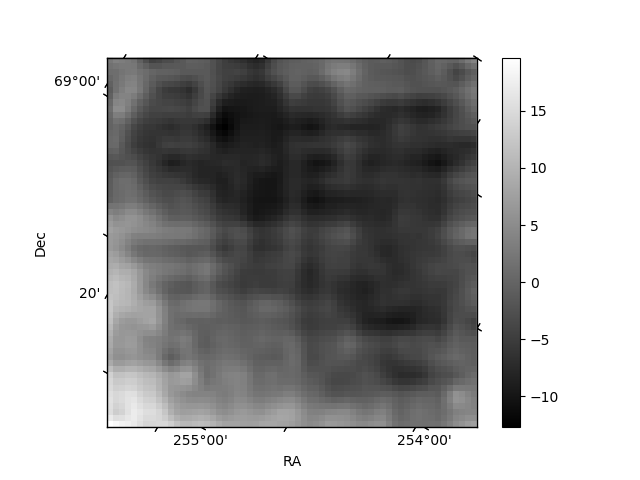
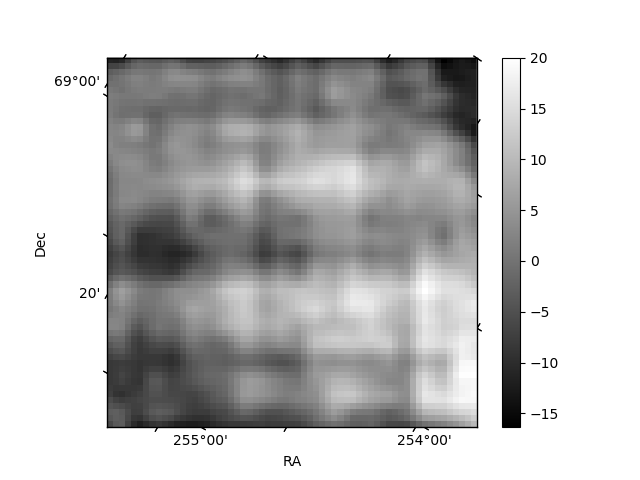
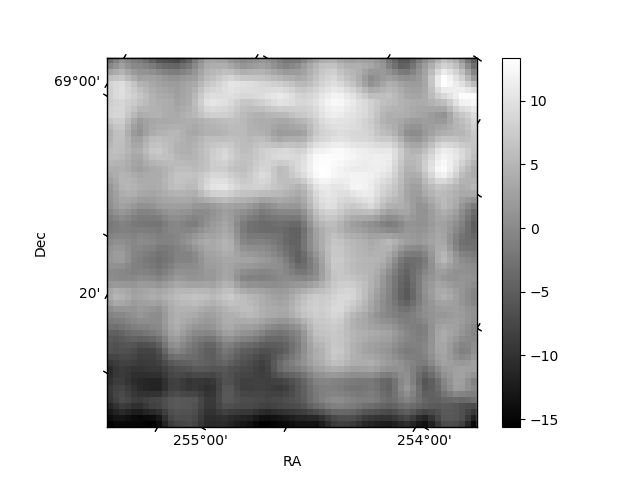
Histogram calculated using DETX and DETY for each event in the final _common_clean file
| Quadrant A | 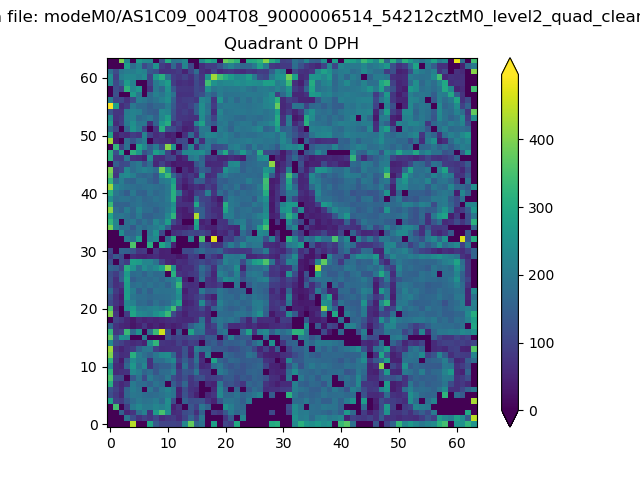 |
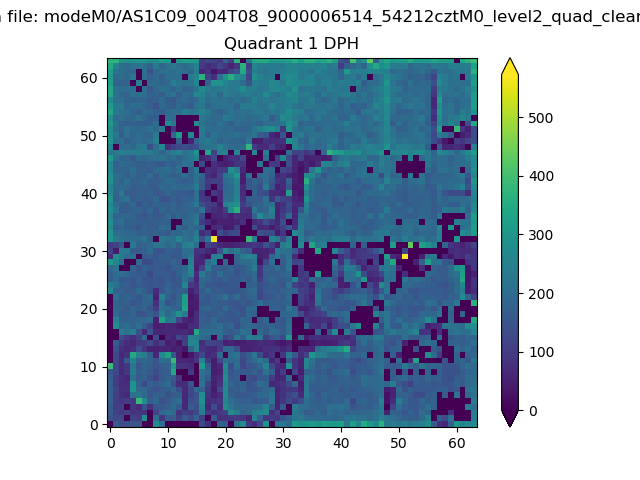 |
Quadrant B |
|---|---|---|---|
| Quadrant D | 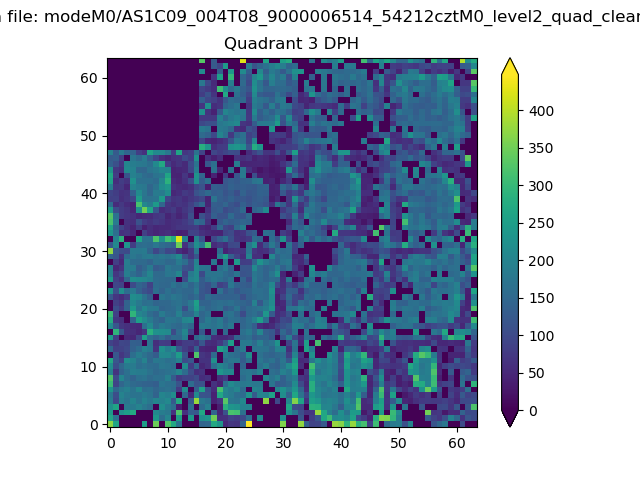 |
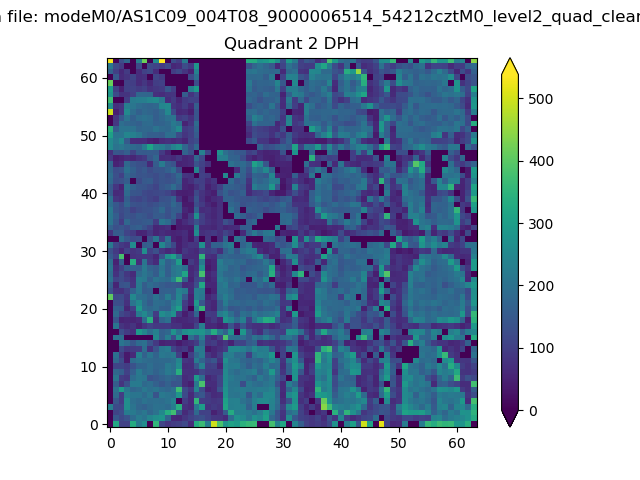 |
Quadrant C |
| Plot type | Count rate plots | Images |
|---|---|---|
| Comparison with Poisson distribution Blue bars denote a histogram of data divided into 1 sec bins. Red curve is a Poisson curve with rate = median count rate of data. |
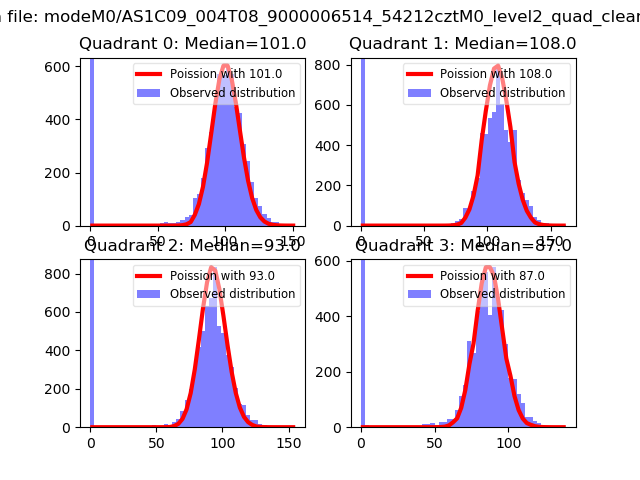 |
 |
| Quadrant-wise count rates Data is divided into 100 sec bins |
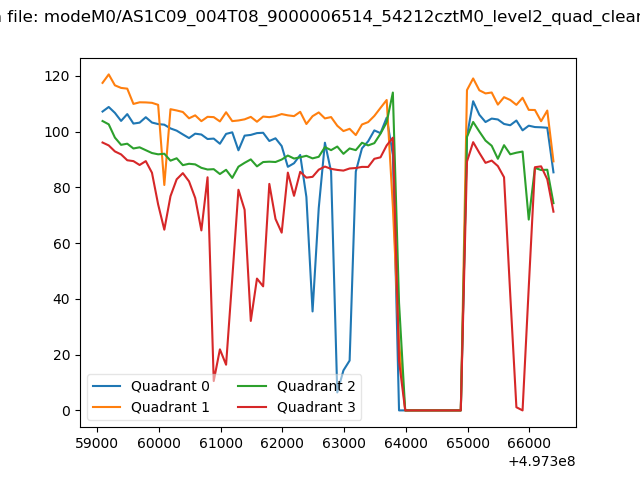 |
|
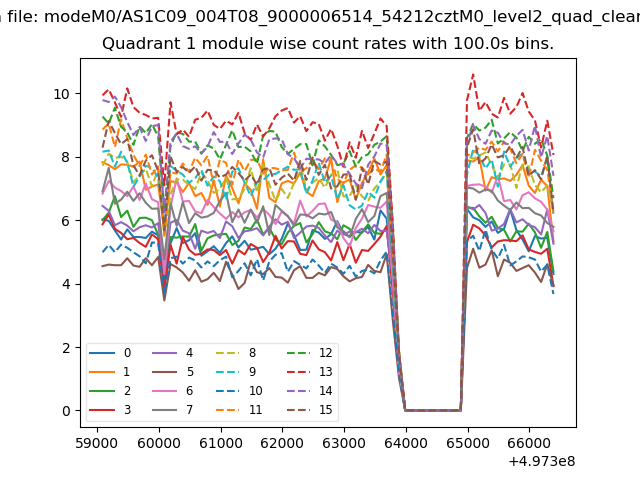
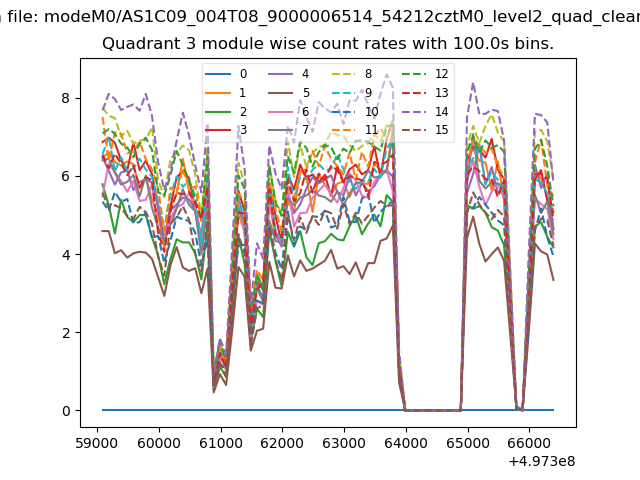
| Module-wise count rates for Quadrant A Data is divided into 100 sec bins |
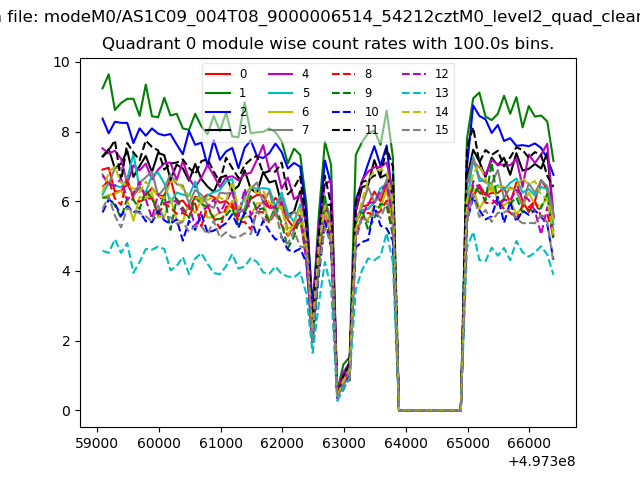 |
 |
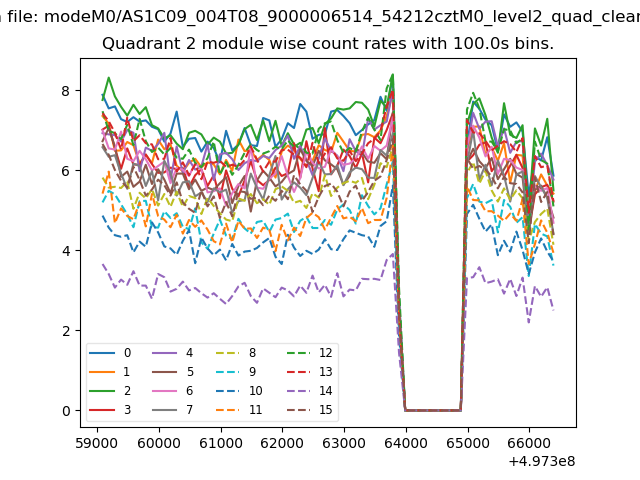
| Module-wise count rates for Quadrant B Data is divided into 100 sec bins |
 |
 |
| Module-wise count rates for Quadrant C Data is divided into 100 sec bins |
 |
 |
| Module-wise count rates for Quadrant D Data is divided into 100 sec bins |
 |
 |
| Parameter | Plot |
|---|---|
| CZT HV Monitor | 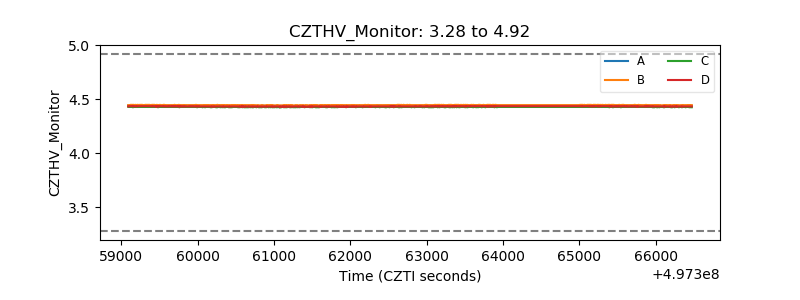 |
| D_VDD | 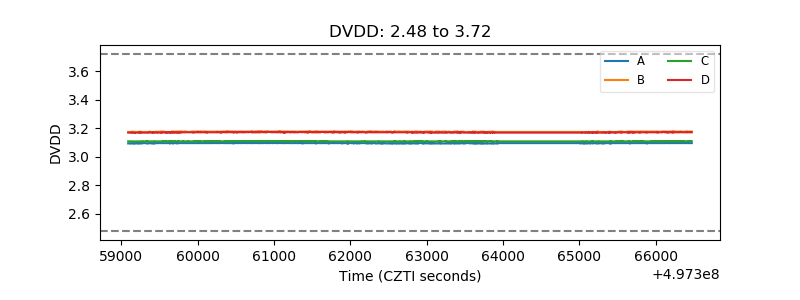 |
| Temperature 1 | 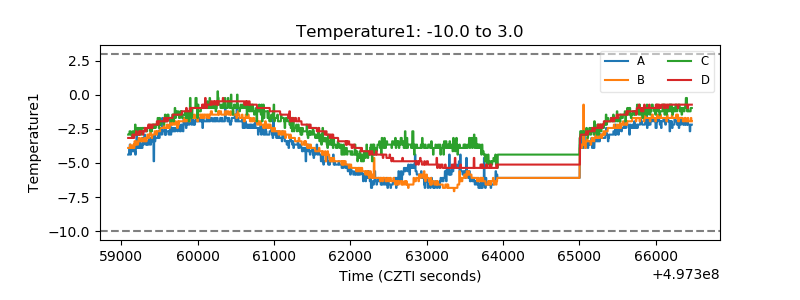 |
| Veto HV Monitor | 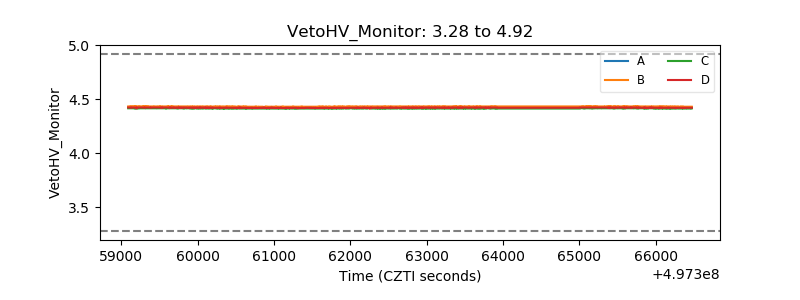 |
| Veto LLD | 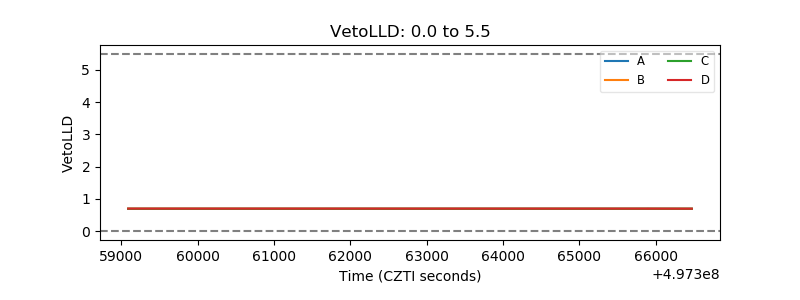 |
| Alpha Counter | 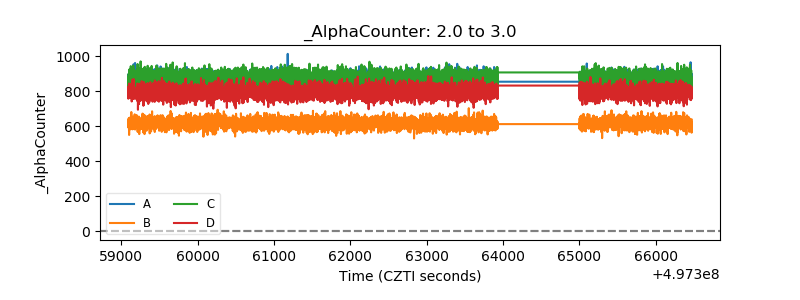 |
| _CPM_Rate | 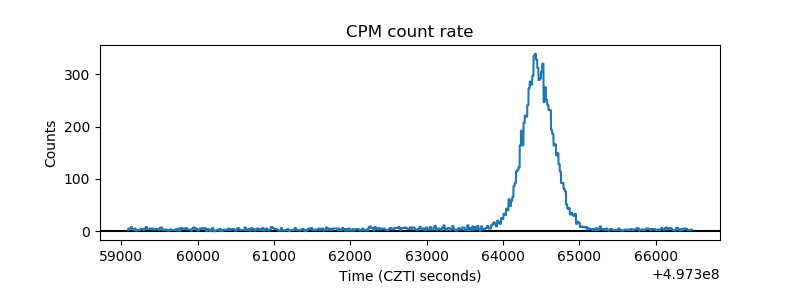 |
| CZT Counter | 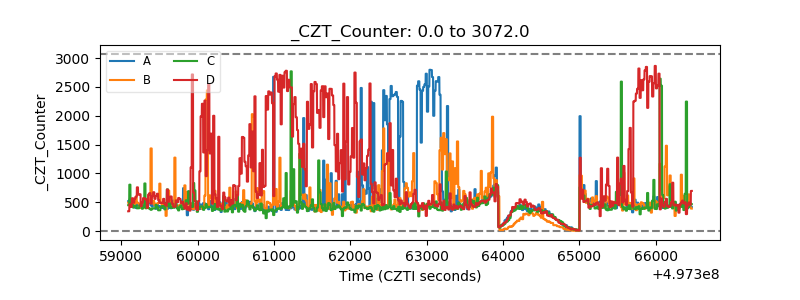 |
| +2.5 Volts monitor | 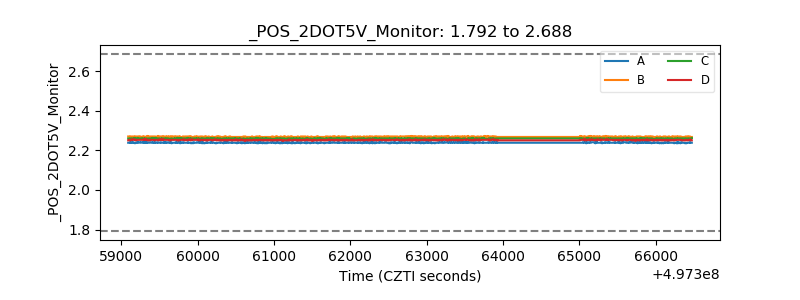 |
| +5 Volts monitor |  |
| _ROLL_ROT | 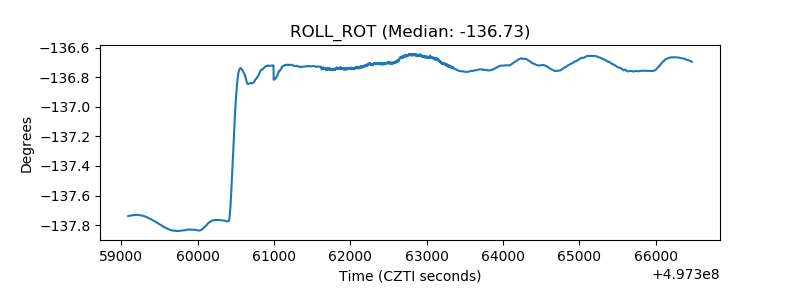 |
| _Roll_DEC | 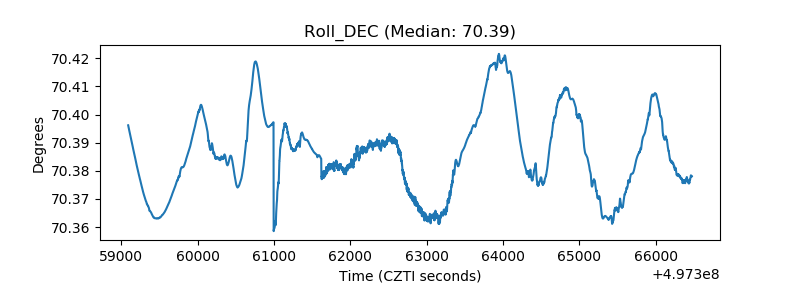 |
| _Roll_RA | 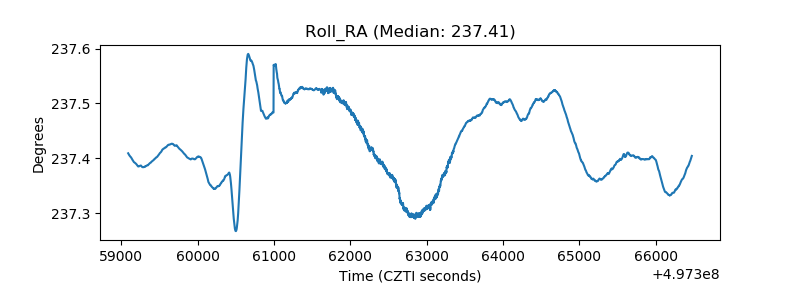 |
| Veto Counter | 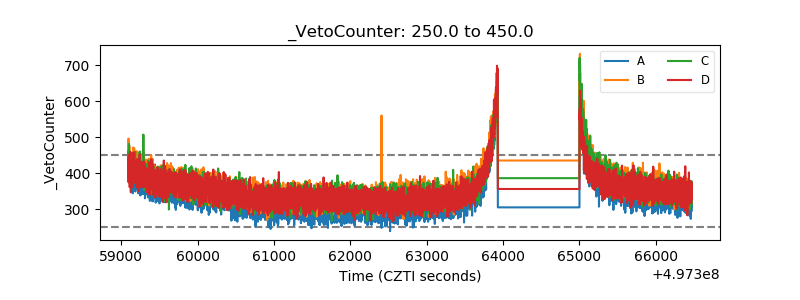 |