| Param | Original file | Final file |
|---|---|---|
| Filename | modeM0/AS1C09_004T08_9000006514_54214cztM0_level2.fits | modeM0/AS1C09_004T08_9000006514_54214cztM0_level2_quad_clean.evt |
| Size (bytes) | 613,823,040 | 93,945,600 |
| Size | 585.4 MB | 89.6 MB |
| Events in quadrant A | 3,282,870 | 680,413 |
| Events in quadrant B | 3,924,110 | 728,624 |
| Events in quadrant C | 3,415,284 | 631,897 |
| Events in quadrant D | 11,544,174 | 306,705 |
| Mode M0 | |||
|---|---|---|---|
| Quadrant | BADHDUFLAG | Total packets | Discarded packets |
| A | 0 | 15169 | 1 |
| B | 0 | 16823 | 3 |
| C | 0 | 15770 | 2 |
| D | 0 | 39269 | 11 |
| Mode M9 | |||
|---|---|---|---|
| Quadrant | BADHDUFLAG | Total packets | Discarded packets |
| A | 0 | 6 | 0 |
| B | 0 | 6 | 0 |
| C | 0 | 6 | 0 |
| D | 0 | 6 | 0 |
| Mode SS | |||
|---|---|---|---|
| Quadrant | BADHDUFLAG | Total packets | Discarded packets |
| A | 0 | 144 | 0 |
| B | 0 | 144 | 0 |
| C | 0 | 144 | 0 |
| D | 0 | 144 | 0 |
| Quadrant | Total seconds | Saturated seconds | Saturation percentage |
|---|---|---|---|
| A | 7137 | 76 | 1.064873% |
| B | 7136 | 126 | 1.765695% |
| C | 7137 | 96 | 1.345103% |
| D | 7135 | 3677 | 51.534688% |
Noise dominated data is calculated using 1-second bins in cleaned event files. If a bin has >2000 counts, and if more than 50% of those come from <1% of pixels, then it is considered to be noise-dominated and hence unusable.
| Quadrant | # 1 sec bins | Bins with >0 counts | Bins with >2000 counts | High rate bins dominated by noise | Noise dominated (total time) | Noise dominated (detector-on time) | Marked lightcurve |
|---|---|---|---|---|---|---|---|
| A | 7707 | 7138 | 45 | 45 | 0.58% | 0.63% | 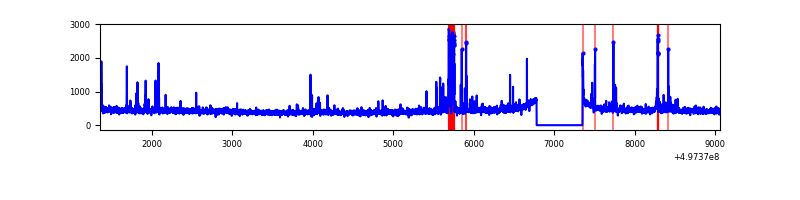 |
| B | 7708 | 7139 | 69 | 69 | 0.90% | 0.97% | 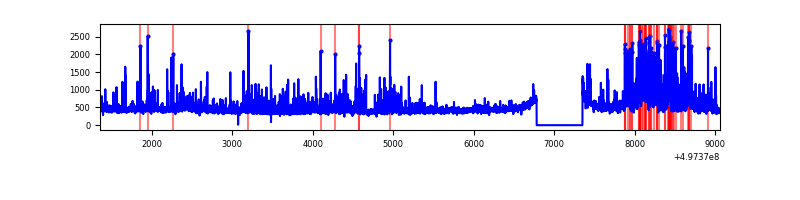 |
| C | 7708 | 7138 | 72 | 72 | 0.93% | 1.01% | 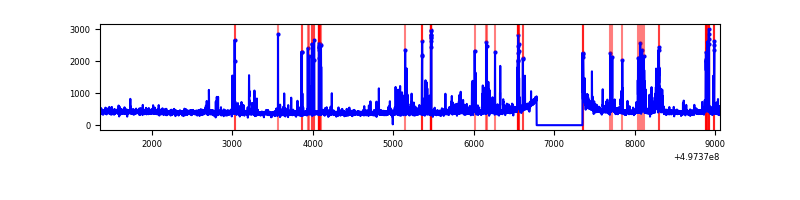 |
| D | 7706 | 7135 | 3338 | 3338 | 43.32% | 46.78% | 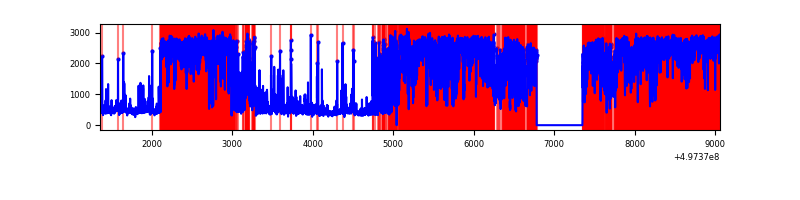 |
Top three noisy pixels from each quadrant. If the there are fewer than three noisy pixels in the level2.evt file, extra rows are filled as -1
| Pixel properties | Quadrant properties | ||||||
|---|---|---|---|---|---|---|---|
| Quadrant | DetID | PixID | Counts | Sigma | Mean | Median | Sigma |
| A | 7 | 29 | 158865 | 856.36 | 748 | 730 | 184.7 |
| A | 15 | 174 | 64139 | 343.38 | 748 | 730 | 184.7 |
| A | 4 | 3 | 48545 | 258.94 | 748 | 730 | 184.7 |
| B | 8 | 234 | 484361 | 3051.12 | 743 | 716 | 158.5 |
| B | 5 | 236 | 202270 | 1271.52 | 743 | 716 | 158.5 |
| B | 4 | 171 | 82097 | 513.4 | 743 | 716 | 158.5 |
| C | 1 | 241 | 296136 | 1489.03 | 727 | 721 | 198.4 |
| C | 14 | 254 | 105557 | 528.42 | 727 | 721 | 198.4 |
| C | 12 | 2 | 51568 | 256.29 | 727 | 721 | 198.4 |
| D | 8 | 176 | 9158692 | 67562.06 | 470 | 449 | 135.6 |
| D | 3 | 12 | 193757 | 1426.07 | 470 | 449 | 135.6 |
| D | 2 | 172 | 77894 | 571.33 | 470 | 449 | 135.6 |
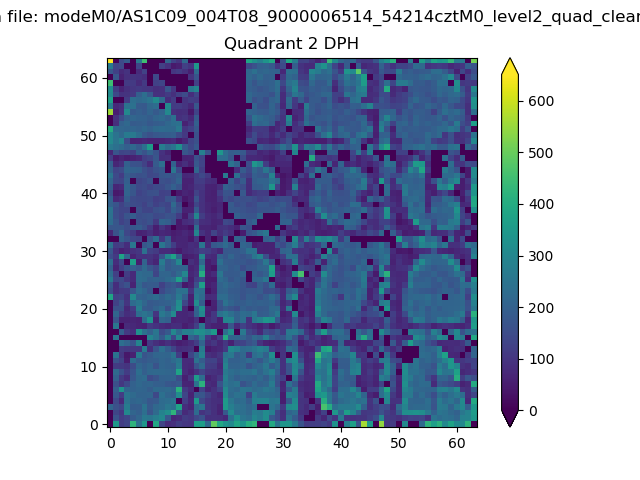
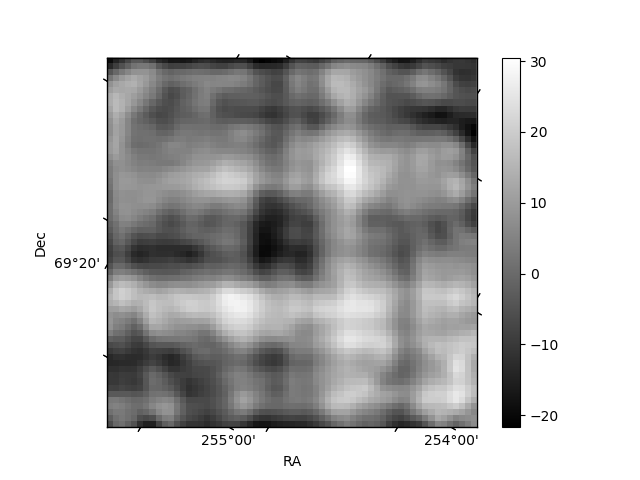
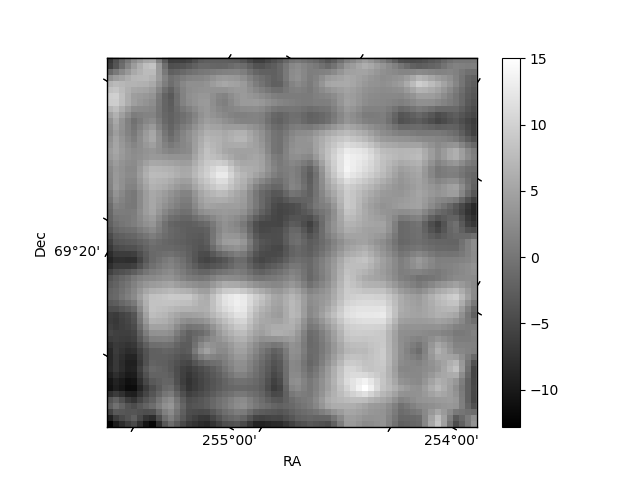
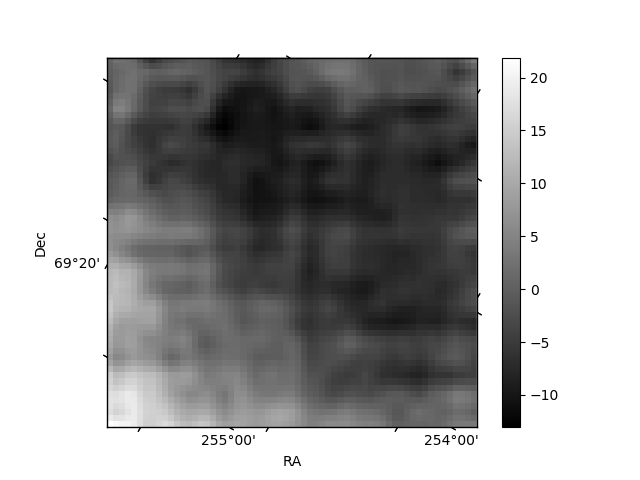
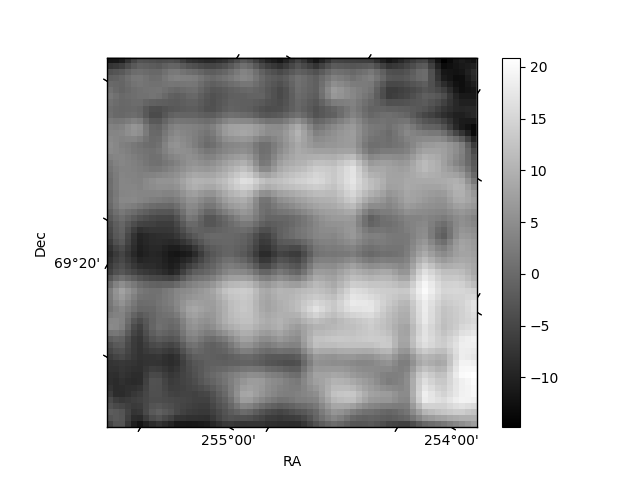
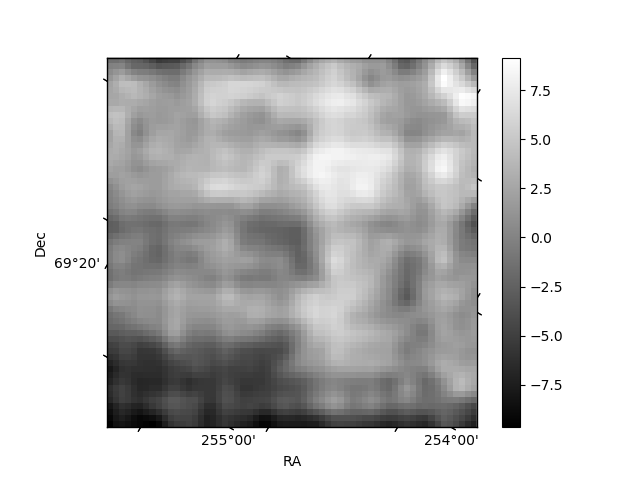
Histogram calculated using DETX and DETY for each event in the final _common_clean file
| Quadrant A | 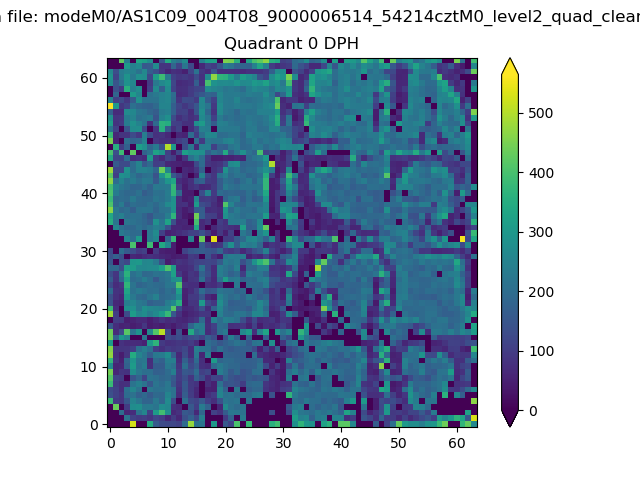 |
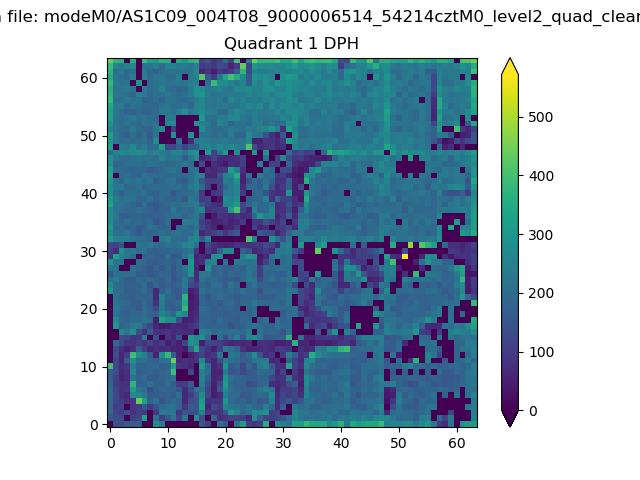 |
Quadrant B |
|---|---|---|---|
| Quadrant D | 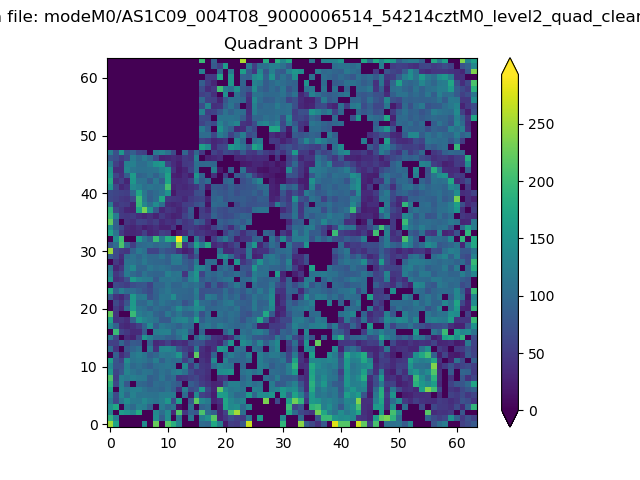 |
 |
Quadrant C |
| Plot type | Count rate plots | Images |
|---|---|---|
| Comparison with Poisson distribution Blue bars denote a histogram of data divided into 1 sec bins. Red curve is a Poisson curve with rate = median count rate of data. |
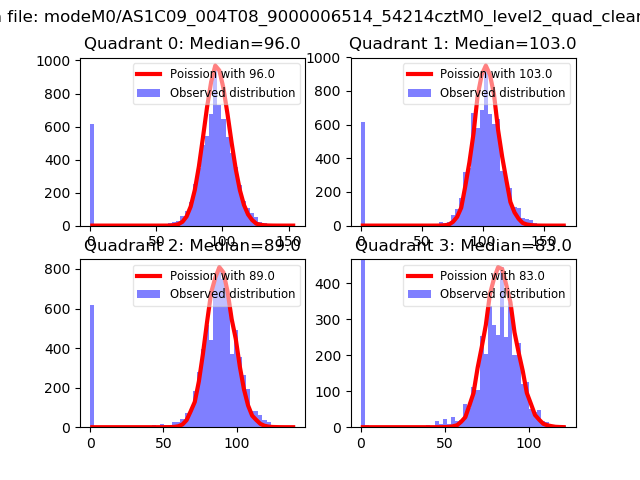 |
 |
| Quadrant-wise count rates Data is divided into 100 sec bins |
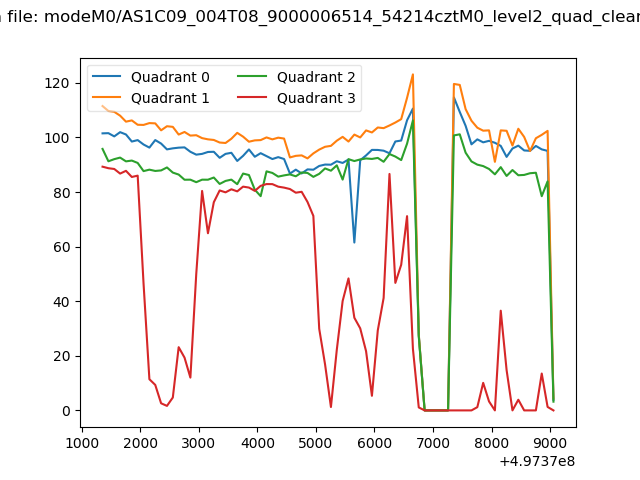 |
|
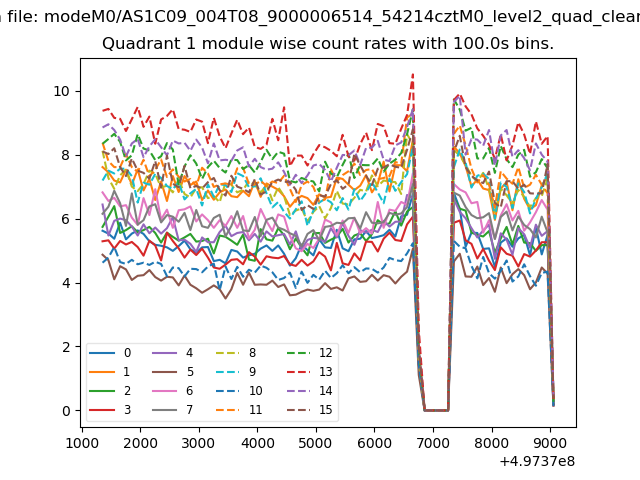
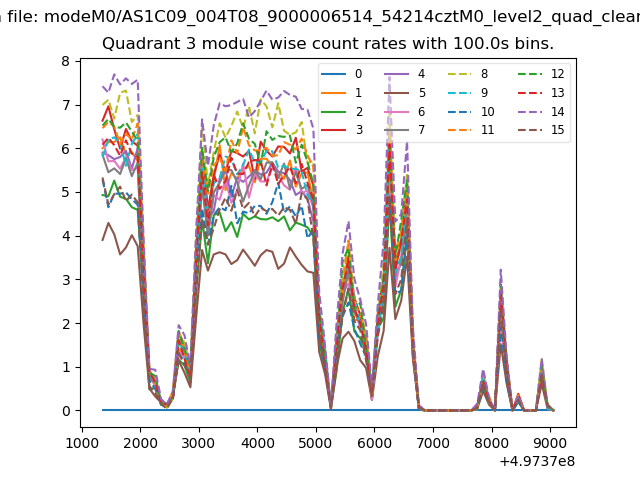
| Module-wise count rates for Quadrant A Data is divided into 100 sec bins |
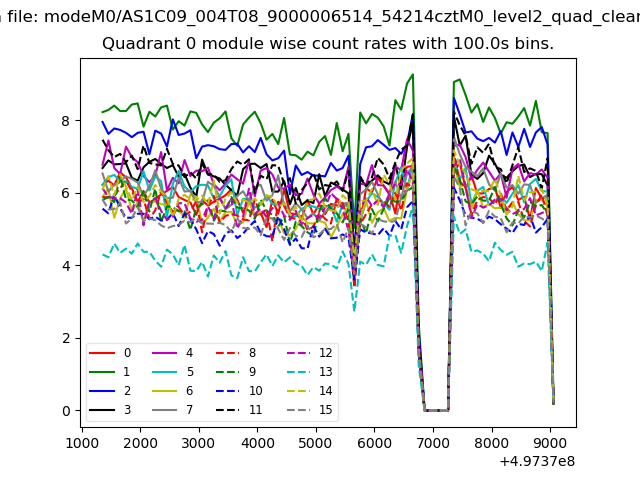 |
 |
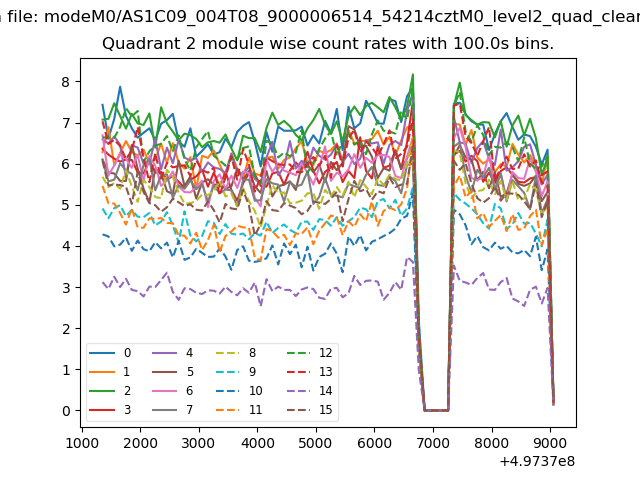
| Module-wise count rates for Quadrant B Data is divided into 100 sec bins |
 |
 |
| Module-wise count rates for Quadrant C Data is divided into 100 sec bins |
 |
 |
| Module-wise count rates for Quadrant D Data is divided into 100 sec bins |
 |
 |
| Parameter | Plot |
|---|---|
| CZT HV Monitor | 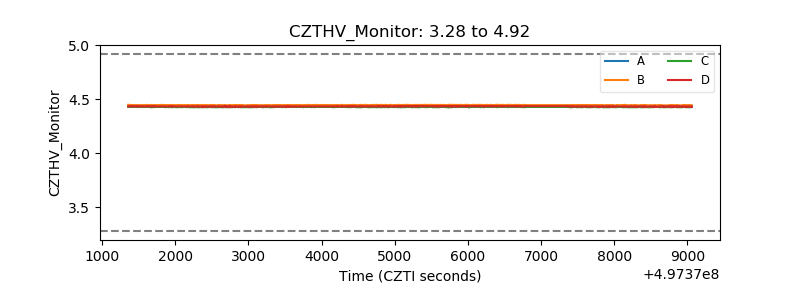 |
| D_VDD | 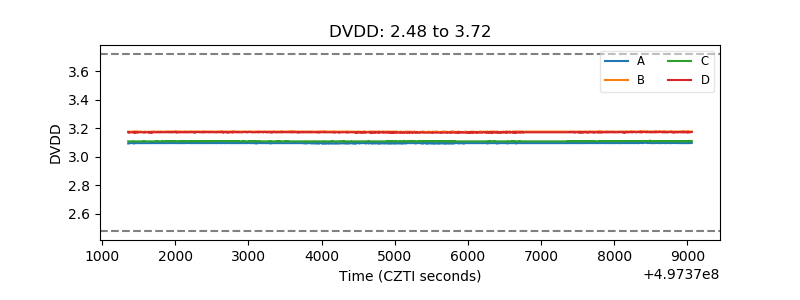 |
| Temperature 1 | 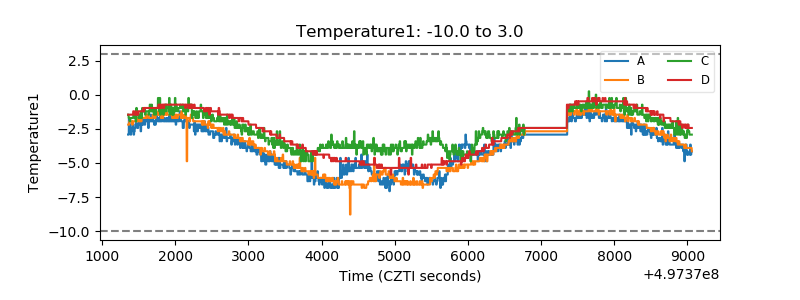 |
| Veto HV Monitor | 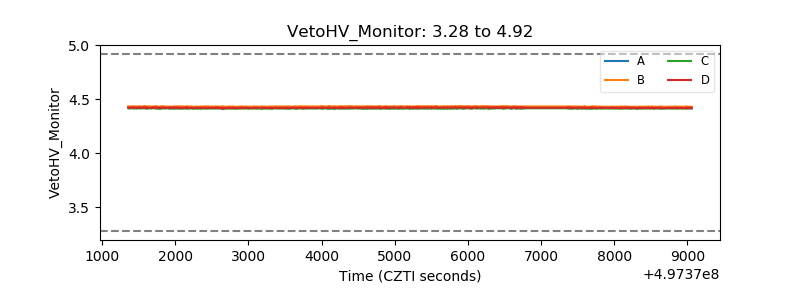 |
| Veto LLD | 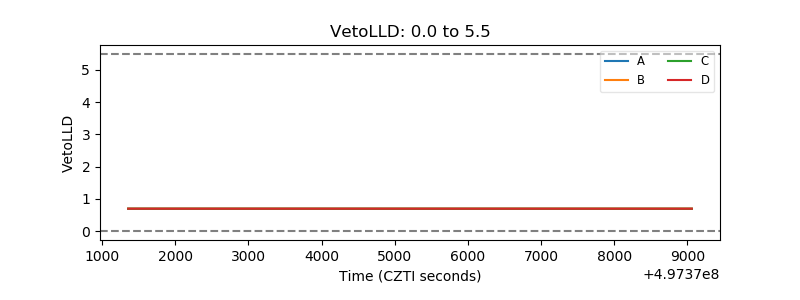 |
| Alpha Counter | 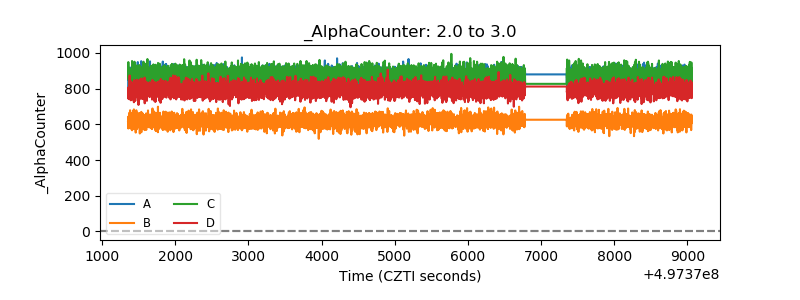 |
| _CPM_Rate | 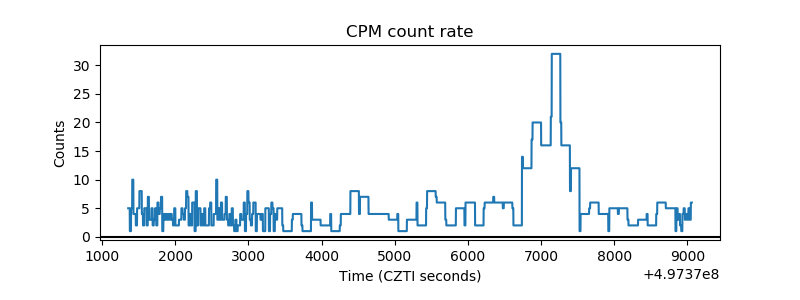 |
| CZT Counter | 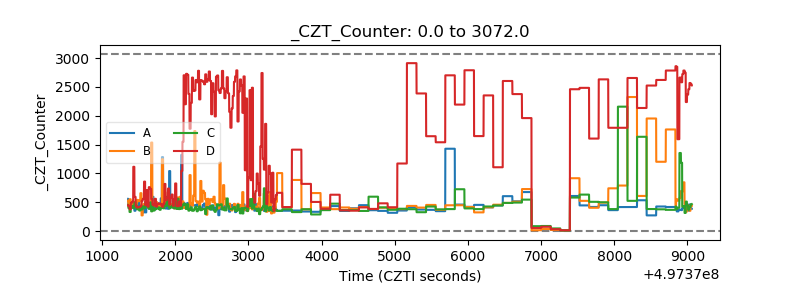 |
| +2.5 Volts monitor | 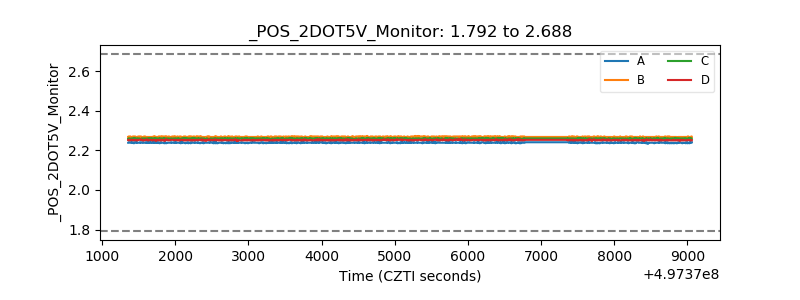 |
| +5 Volts monitor |  |
| _ROLL_ROT | 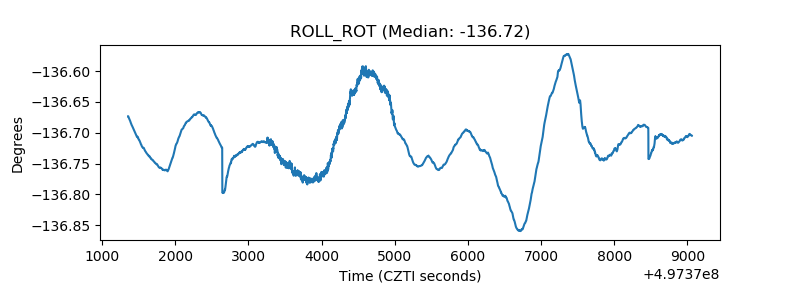 |
| _Roll_DEC | 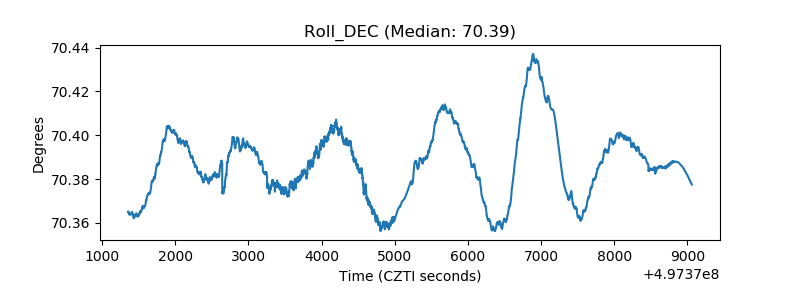 |
| _Roll_RA | 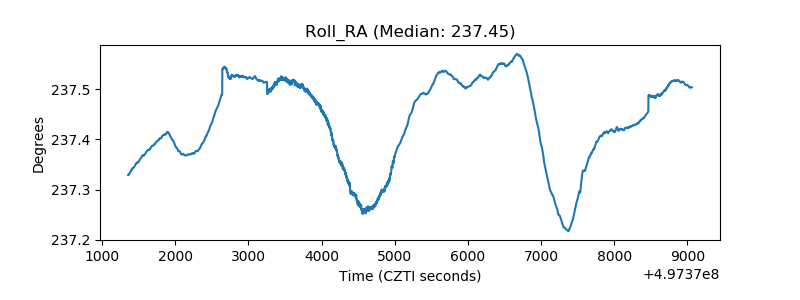 |
| Veto Counter | 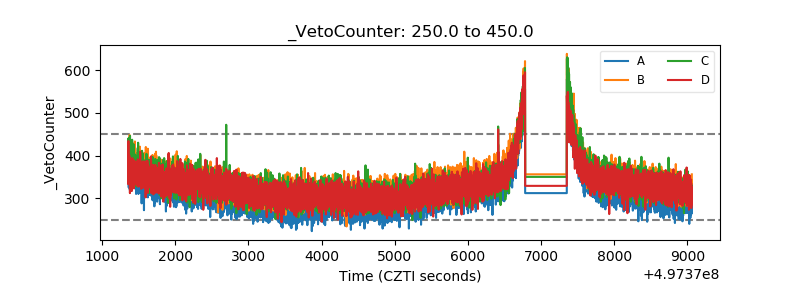 |