| Param | Original file | Final file |
|---|---|---|
| Filename | modeM0/AS1C09_004T08_9000006514_54215cztM0_level2.fits | modeM0/AS1C09_004T08_9000006514_54215cztM0_level2_quad_clean.evt |
| Size (bytes) | 726,779,520 | 89,994,240 |
| Size | 693.1 MB | 85.8 MB |
| Events in quadrant A | 3,789,610 | 674,791 |
| Events in quadrant B | 4,583,263 | 704,289 |
| Events in quadrant C | 3,847,557 | 632,282 |
| Events in quadrant D | 14,124,501 | 213,395 |
| Mode M0 | |||
|---|---|---|---|
| Quadrant | BADHDUFLAG | Total packets | Discarded packets |
| A | 0 | 16556 | 0 |
| B | 0 | 18933 | 0 |
| C | 0 | 16911 | 0 |
| D | 0 | 47010 | 0 |
| Mode SS | |||
|---|---|---|---|
| Quadrant | BADHDUFLAG | Total packets | Discarded packets |
| A | 0 | 144 | 0 |
| B | 0 | 144 | 0 |
| C | 0 | 144 | 0 |
| D | 0 | 144 | 0 |
| Quadrant | Total seconds | Saturated seconds | Saturation percentage |
|---|---|---|---|
| A | 7180 | 139 | 1.935933% |
| B | 7181 | 427 | 5.946247% |
| C | 7181 | 159 | 2.214176% |
| D | 7181 | 4776 | 66.508843% |
Noise dominated data is calculated using 1-second bins in cleaned event files. If a bin has >2000 counts, and if more than 50% of those come from <1% of pixels, then it is considered to be noise-dominated and hence unusable.
| Quadrant | # 1 sec bins | Bins with >0 counts | Bins with >2000 counts | High rate bins dominated by noise | Noise dominated (total time) | Noise dominated (detector-on time) | Marked lightcurve |
|---|---|---|---|---|---|---|---|
| A | 7180 | 7180 | 123 | 123 | 1.71% | 1.71% | 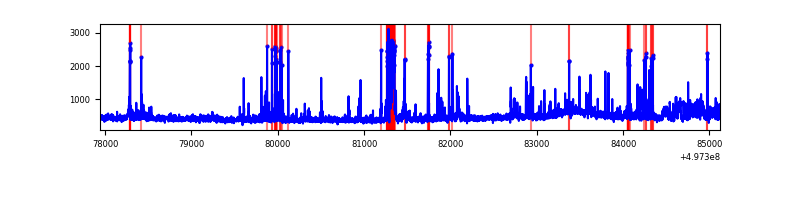 |
| B | 7181 | 7181 | 315 | 315 | 4.39% | 4.39% | 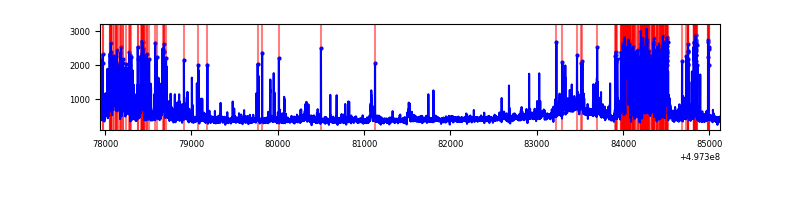 |
| C | 7181 | 7181 | 158 | 158 | 2.20% | 2.20% | 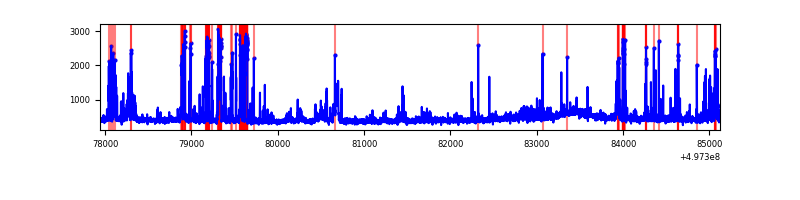 |
| D | 7180 | 7180 | 4564 | 4564 | 63.57% | 63.57% | 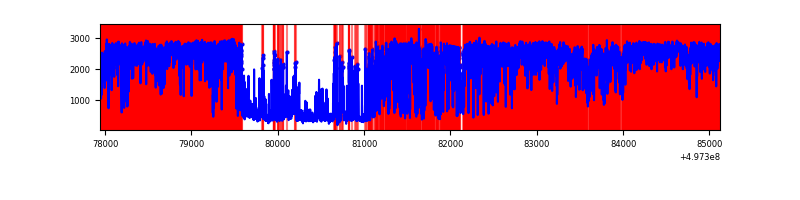 |
Top three noisy pixels from each quadrant. If the there are fewer than three noisy pixels in the level2.evt file, extra rows are filled as -1
| Pixel properties | Quadrant properties | ||||||
|---|---|---|---|---|---|---|---|
| Quadrant | DetID | PixID | Counts | Sigma | Mean | Median | Sigma |
| A | 7 | 29 | 474442 | 2538.45 | 753 | 734 | 186.6 |
| A | 4 | 5 | 108618 | 578.11 | 753 | 734 | 186.6 |
| A | 15 | 174 | 78911 | 418.92 | 753 | 734 | 186.6 |
| B | 8 | 234 | 1192433 | 7664.51 | 735 | 709 | 155.5 |
| B | 5 | 236 | 109354 | 698.74 | 735 | 709 | 155.5 |
| B | 0 | 213 | 79283 | 505.34 | 735 | 709 | 155.5 |
| C | 1 | 241 | 558471 | 2766.6 | 735 | 727 | 201.6 |
| C | 15 | 215 | 87059 | 428.24 | 735 | 727 | 201.6 |
| C | 12 | 252 | 78737 | 386.96 | 735 | 727 | 201.6 |
| D | 8 | 176 | 11360071 | 97173.41 | 407 | 388 | 116.9 |
| D | 11 | 176 | 687376 | 5876.66 | 407 | 388 | 116.9 |
| D | 3 | 12 | 154726 | 1320.24 | 407 | 388 | 116.9 |
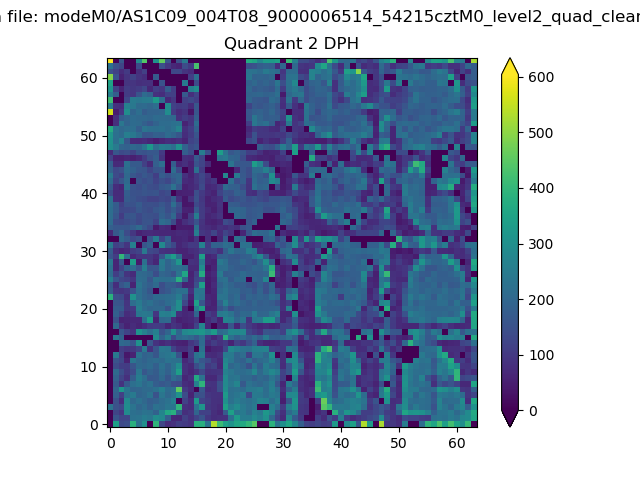
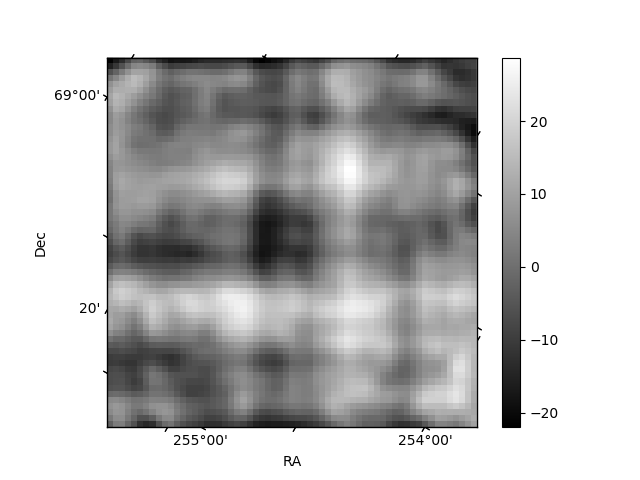
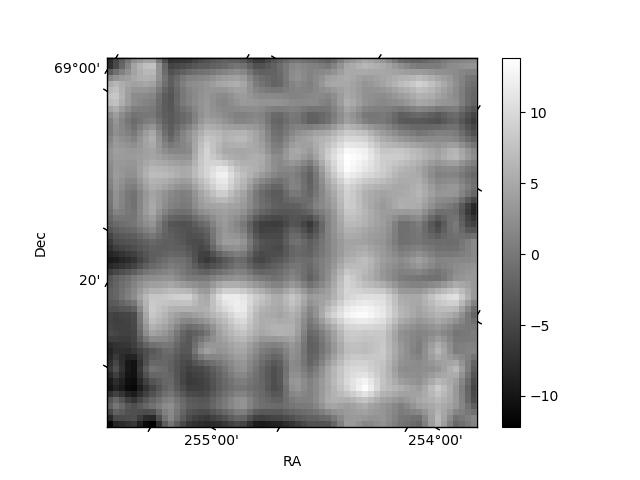
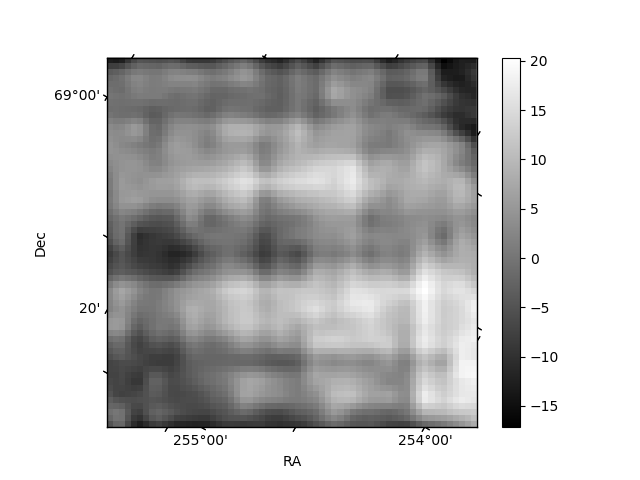
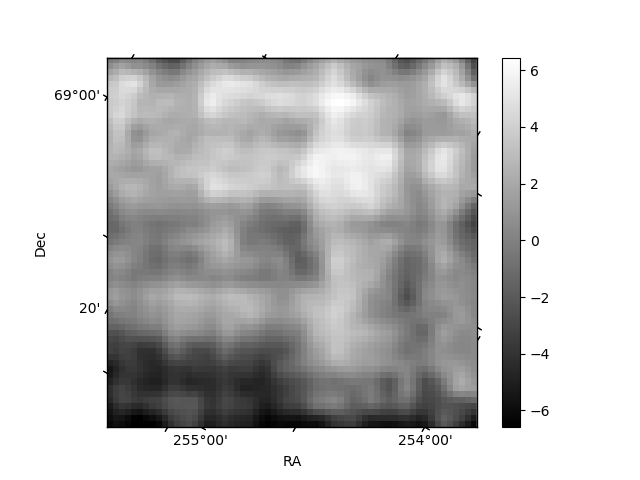
Histogram calculated using DETX and DETY for each event in the final _common_clean file
| Quadrant A | 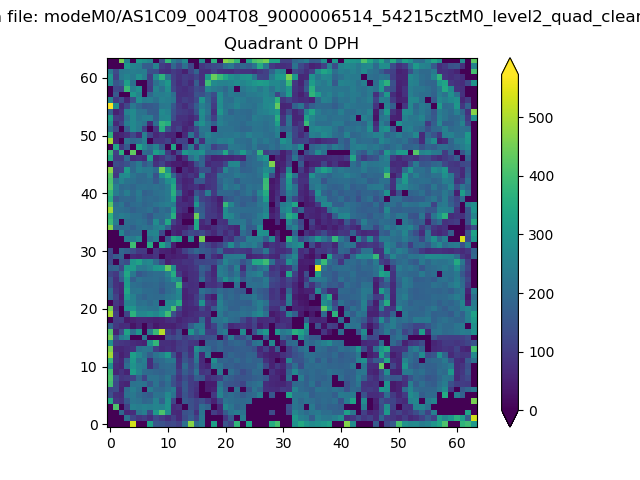 |
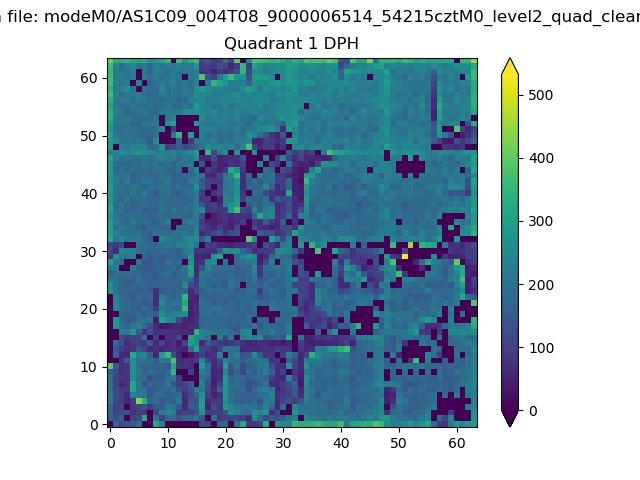 |
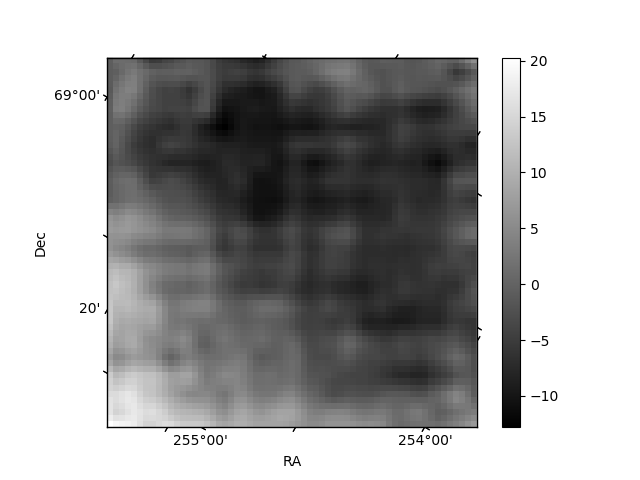
Quadrant B |
|---|---|---|---|
| Quadrant D | 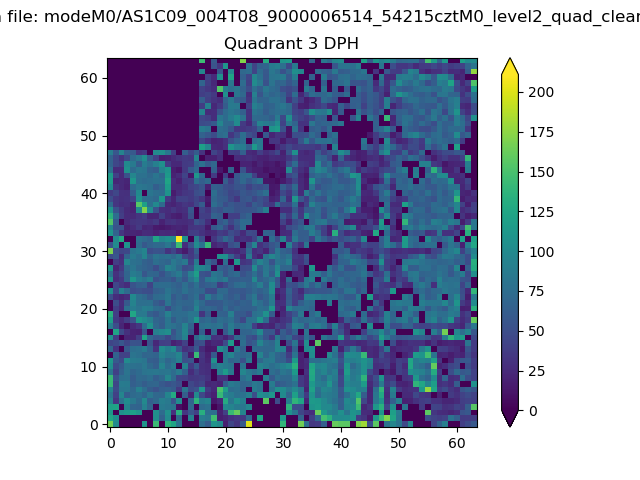 |
 |
Quadrant C |
| Plot type | Count rate plots | Images |
|---|---|---|
| Comparison with Poisson distribution Blue bars denote a histogram of data divided into 1 sec bins. Red curve is a Poisson curve with rate = median count rate of data. |
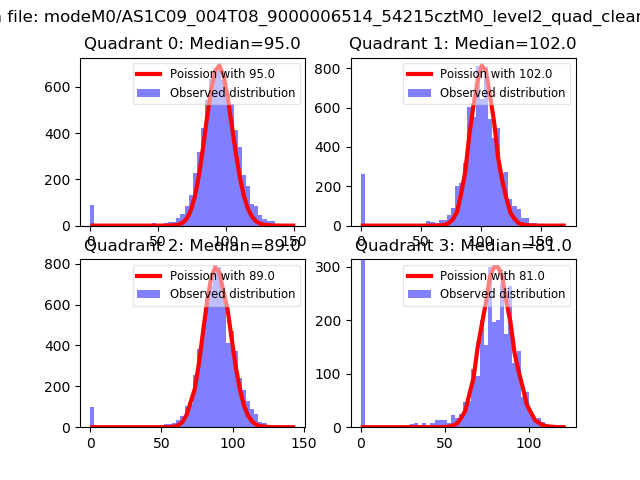 |
 |
| Quadrant-wise count rates Data is divided into 100 sec bins |
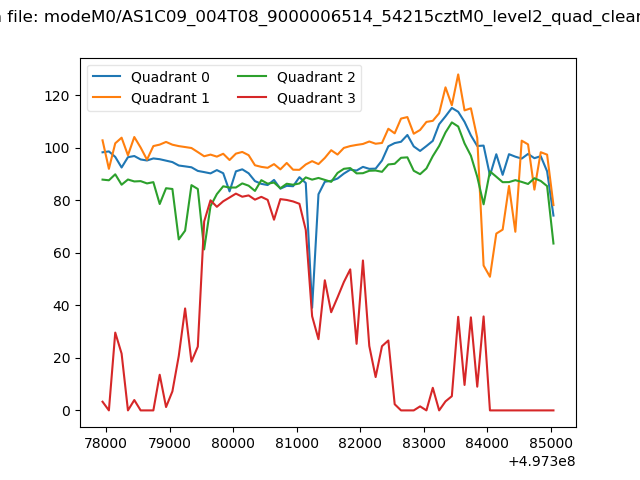 |
|
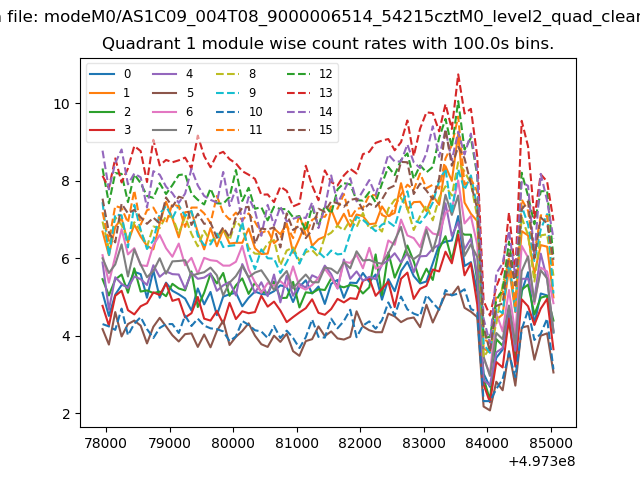
| Module-wise count rates for Quadrant A Data is divided into 100 sec bins |
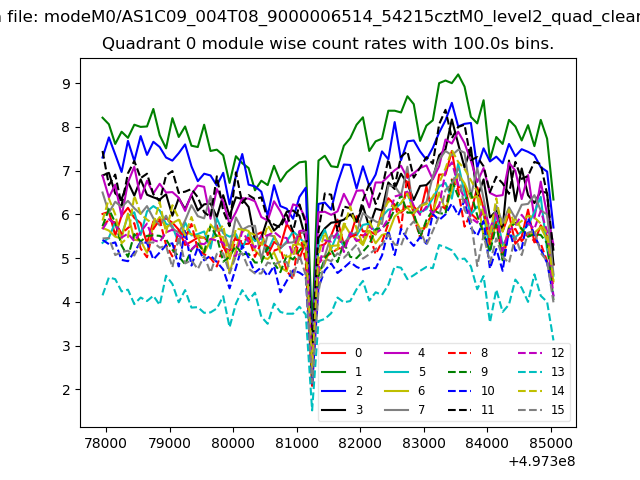 |
 |
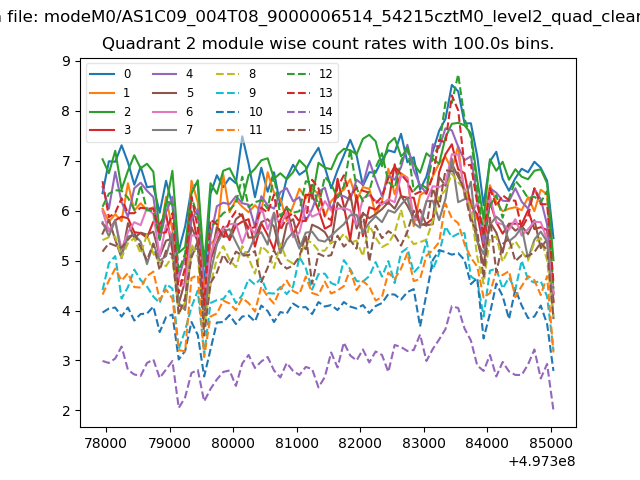
| Module-wise count rates for Quadrant B Data is divided into 100 sec bins |
 |
 |
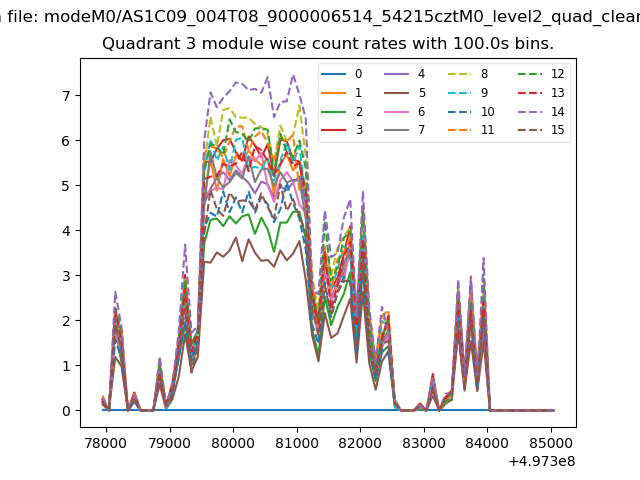
| Module-wise count rates for Quadrant C Data is divided into 100 sec bins |
 |
 |
| Module-wise count rates for Quadrant D Data is divided into 100 sec bins |
 |
 |
| Parameter | Plot |
|---|---|
| CZT HV Monitor |  |
| D_VDD | 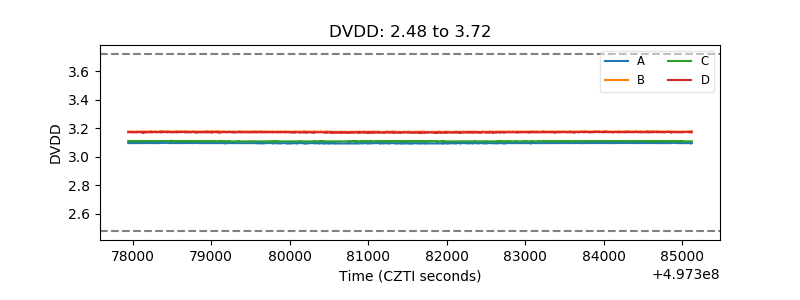 |
| Temperature 1 | 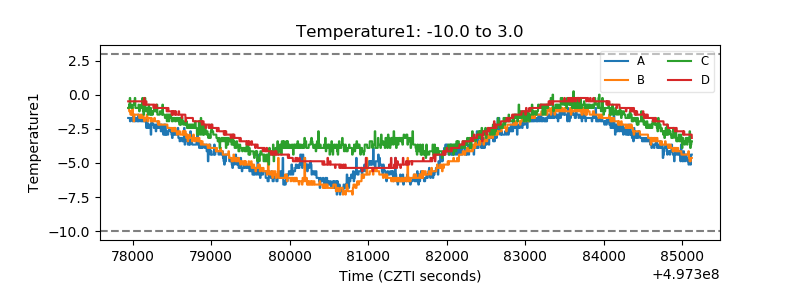 |
| Veto HV Monitor | 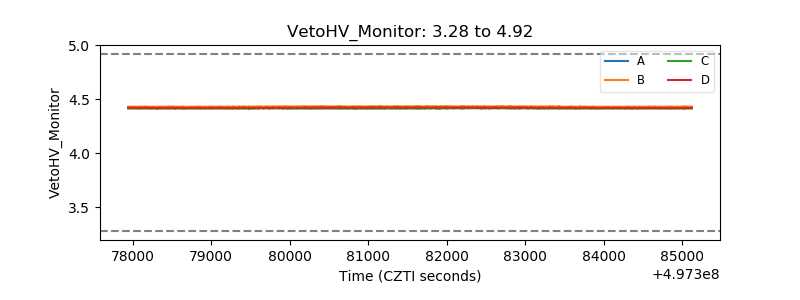 |
| Veto LLD | 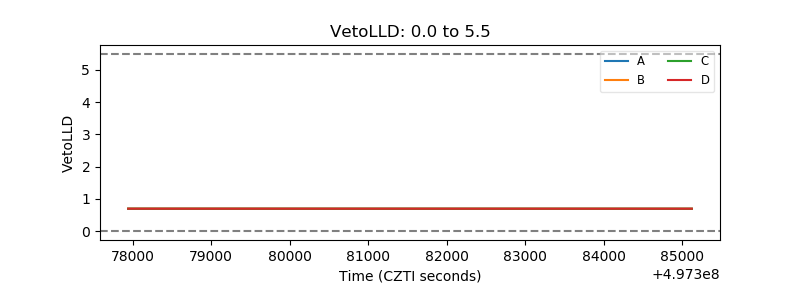 |
| Alpha Counter | 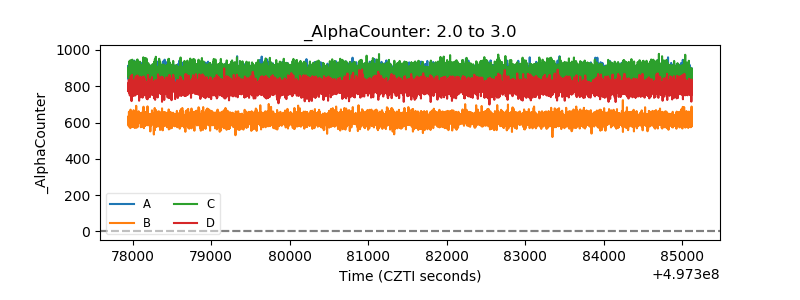 |
| _CPM_Rate | 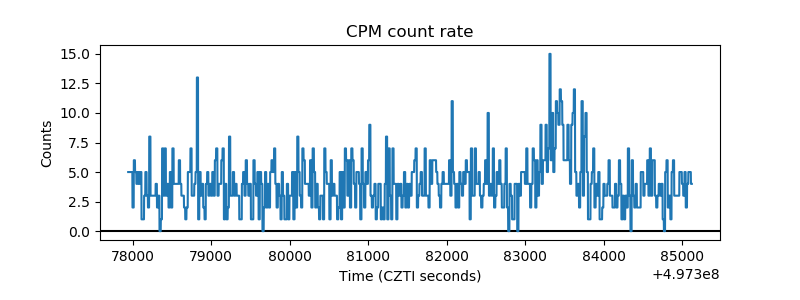 |
| CZT Counter | 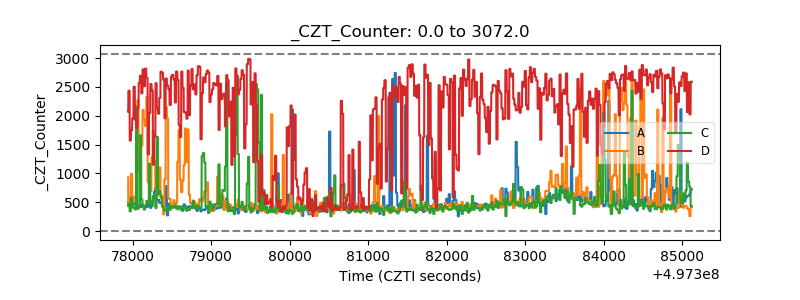 |
| +2.5 Volts monitor |  |
| +5 Volts monitor |  |
| _ROLL_ROT | 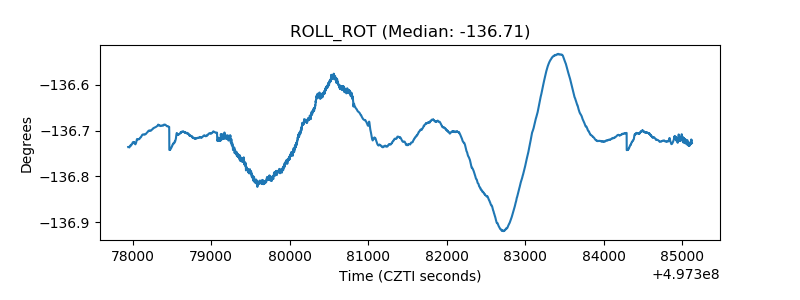 |
| _Roll_DEC | 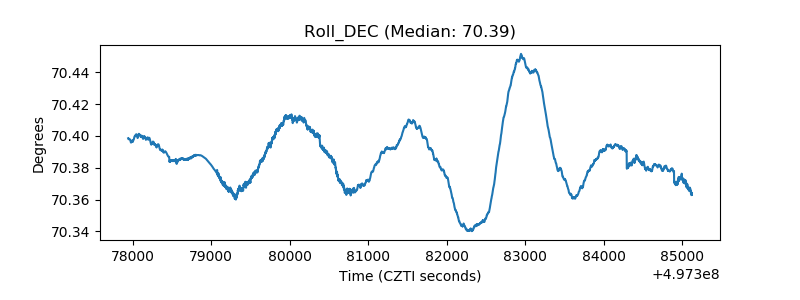 |
| _Roll_RA | 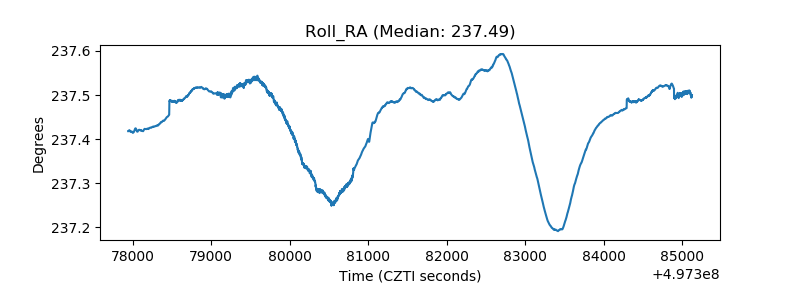 |
| Veto Counter | 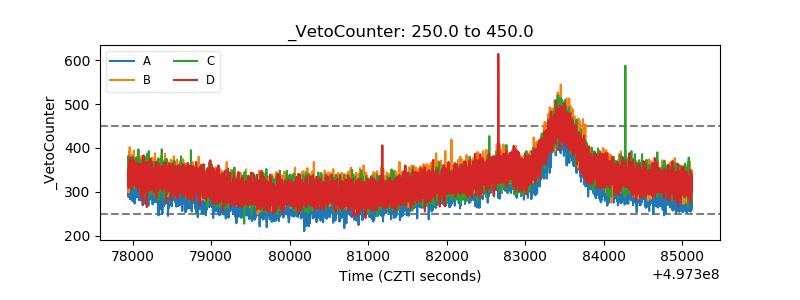 |