| Param | Original file | Final file |
|---|---|---|
| Filename | modeM0/AS1C09_004T08_9000006514_54216cztM0_level2.fits | modeM0/AS1C09_004T08_9000006514_54216cztM0_level2_quad_clean.evt |
| Size (bytes) | 838,540,800 | 87,226,560 |
| Size | 799.7 MB | 83.2 MB |
| Events in quadrant A | 4,042,679 | 689,392 |
| Events in quadrant B | 4,511,826 | 718,290 |
| Events in quadrant C | 5,564,785 | 569,374 |
| Events in quadrant D | 16,346,983 | 149,817 |
| Mode M0 | |||
|---|---|---|---|
| Quadrant | BADHDUFLAG | Total packets | Discarded packets |
| A | 0 | 17350 | 2 |
| B | 0 | 18832 | 0 |
| C | 0 | 22132 | 0 |
| D | 0 | 53641 | 1 |
| Mode SS | |||
|---|---|---|---|
| Quadrant | BADHDUFLAG | Total packets | Discarded packets |
| A | 0 | 146 | 0 |
| B | 0 | 146 | 0 |
| C | 0 | 146 | 0 |
| D | 0 | 146 | 0 |
| Quadrant | Total seconds | Saturated seconds | Saturation percentage |
|---|---|---|---|
| A | 7388 | 157 | 2.125068% |
| B | 7390 | 446 | 6.035183% |
| C | 7391 | 1019 | 13.787038% |
| D | 7390 | 5648 | 76.427605% |
Noise dominated data is calculated using 1-second bins in cleaned event files. If a bin has >2000 counts, and if more than 50% of those come from <1% of pixels, then it is considered to be noise-dominated and hence unusable.
| Quadrant | # 1 sec bins | Bins with >0 counts | Bins with >2000 counts | High rate bins dominated by noise | Noise dominated (total time) | Noise dominated (detector-on time) | Marked lightcurve |
|---|---|---|---|---|---|---|---|
| A | 7390 | 7390 | 119 | 119 | 1.61% | 1.61% | 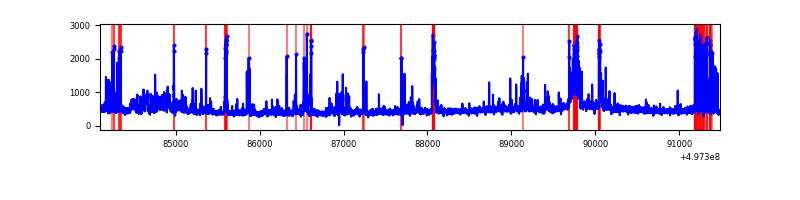 |
| B | 7390 | 7390 | 254 | 254 | 3.44% | 3.44% | 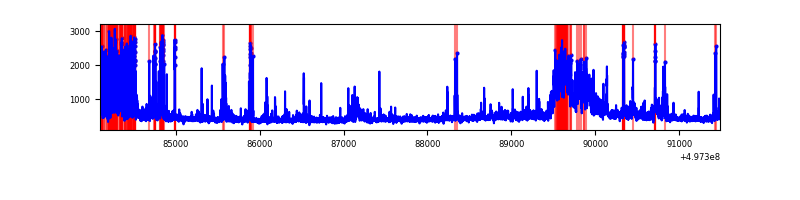 |
| C | 7391 | 7391 | 857 | 857 | 11.60% | 11.60% | 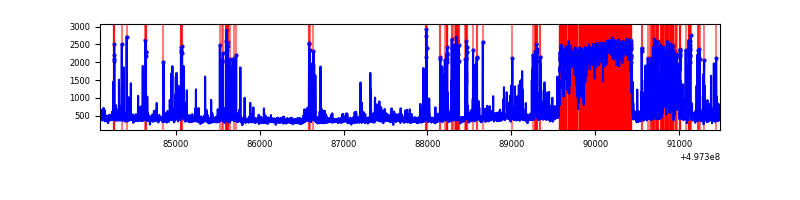 |
| D | 7391 | 7391 | 5573 | 5573 | 75.40% | 75.40% | 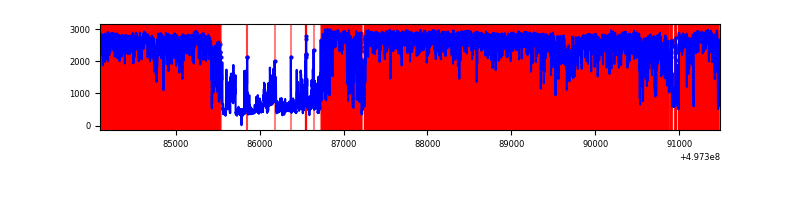 |
Top three noisy pixels from each quadrant. If the there are fewer than three noisy pixels in the level2.evt file, extra rows are filled as -1
| Pixel properties | Quadrant properties | ||||||
|---|---|---|---|---|---|---|---|
| Quadrant | DetID | PixID | Counts | Sigma | Mean | Median | Sigma |
| A | 7 | 29 | 319541 | 1666.98 | 765 | 747 | 191.2 |
| A | 5 | 243 | 142221 | 739.77 | 765 | 747 | 191.2 |
| A | 4 | 5 | 127861 | 664.68 | 765 | 747 | 191.2 |
| B | 8 | 234 | 1084084 | 6829.06 | 749 | 725 | 158.6 |
| B | 5 | 236 | 107850 | 675.27 | 749 | 725 | 158.6 |
| B | 0 | 213 | 96032 | 600.78 | 749 | 725 | 158.6 |
| C | 15 | 215 | 1160889 | 6151.44 | 685 | 680 | 188.6 |
| C | 15 | 198 | 872986 | 4624.98 | 685 | 680 | 188.6 |
| C | 15 | 216 | 500564 | 2650.39 | 685 | 680 | 188.6 |
| D | 8 | 176 | 13893547 | 142481.02 | 332 | 317 | 97.5 |
| D | 2 | 172 | 510692 | 5234.11 | 332 | 317 | 97.5 |
| D | 11 | 176 | 221873 | 2272.15 | 332 | 317 | 97.5 |
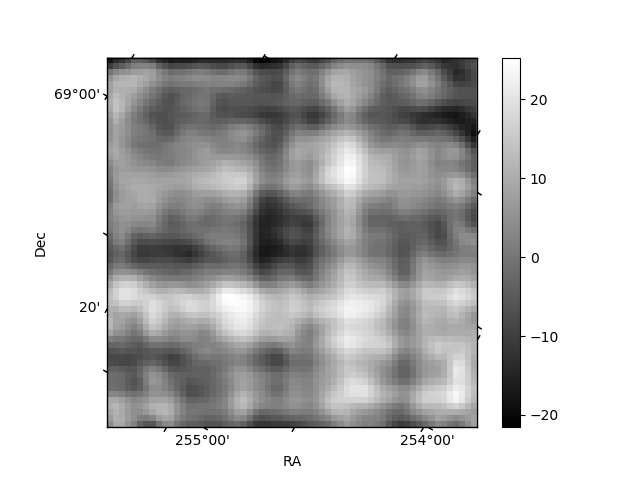
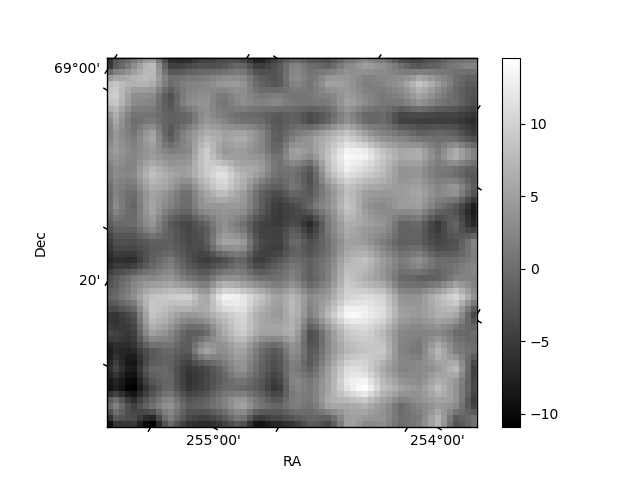
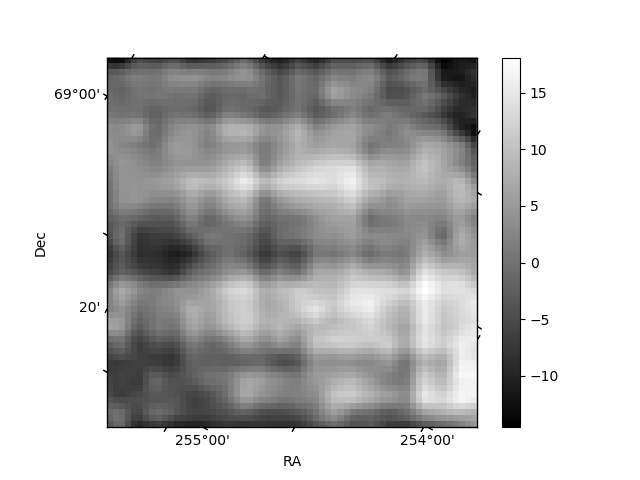
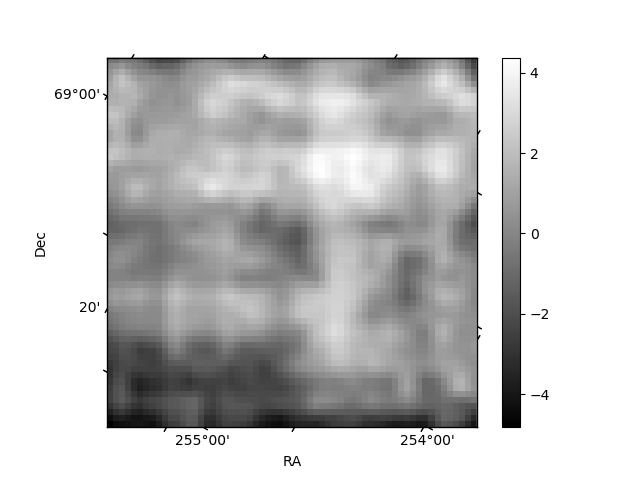
Histogram calculated using DETX and DETY for each event in the final _common_clean file
| Quadrant A | 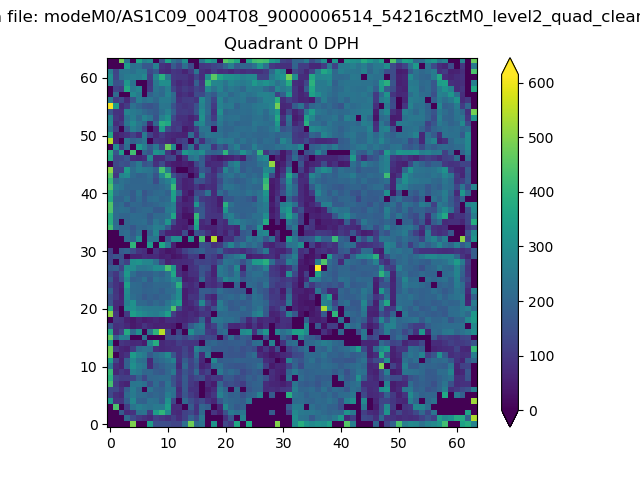 |
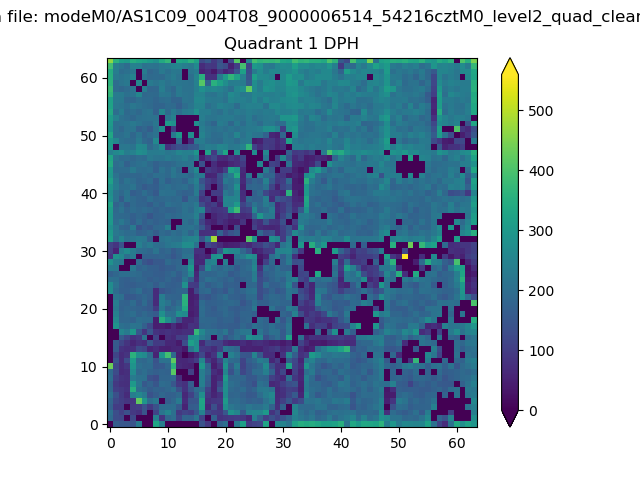 |
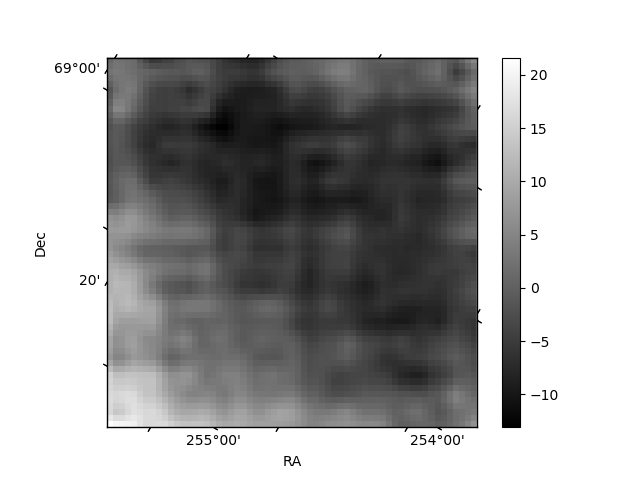
Quadrant B |
|---|---|---|---|
| Quadrant D | 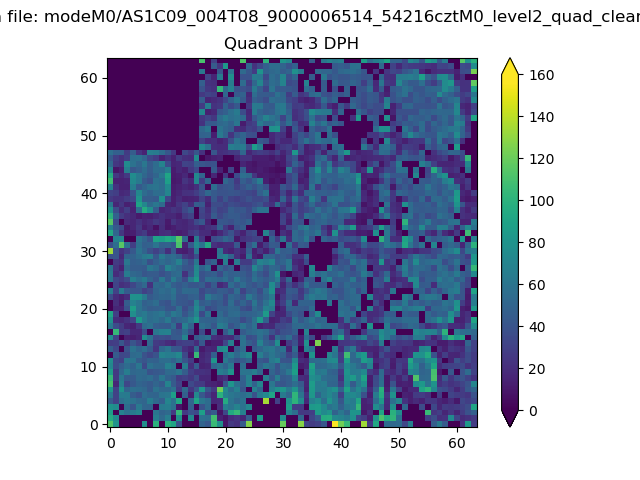 |
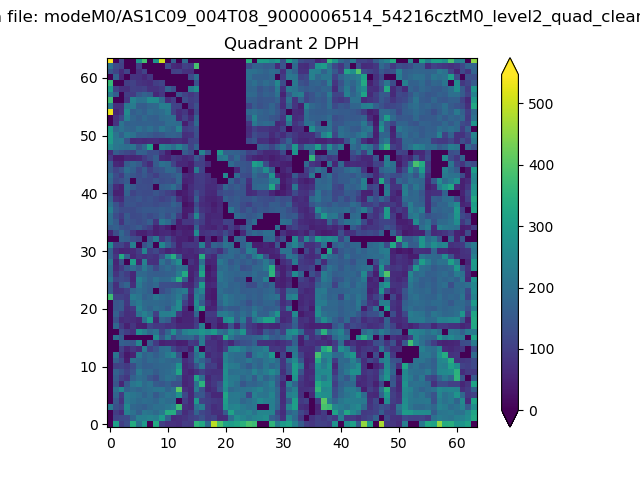 |
Quadrant C |
| Plot type | Count rate plots | Images |
|---|---|---|
| Comparison with Poisson distribution Blue bars denote a histogram of data divided into 1 sec bins. Red curve is a Poisson curve with rate = median count rate of data. |
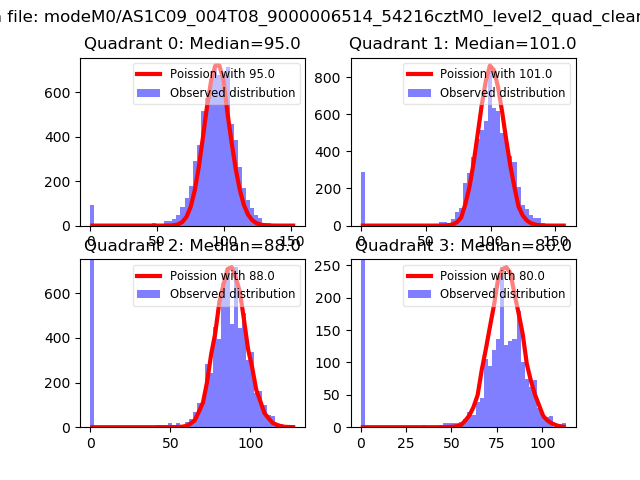 |
 |
| Quadrant-wise count rates Data is divided into 100 sec bins |
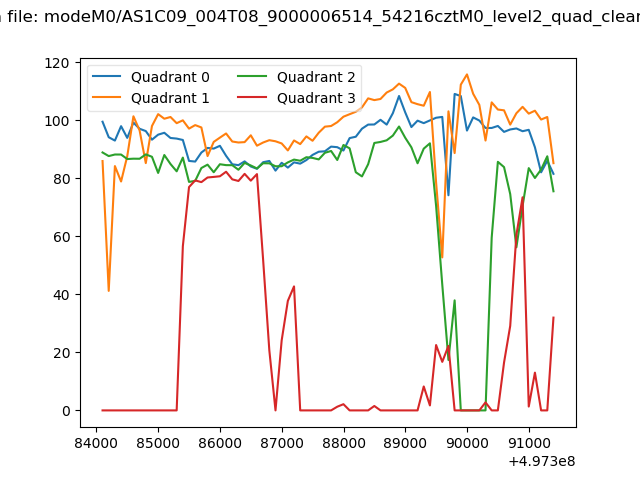 |
|
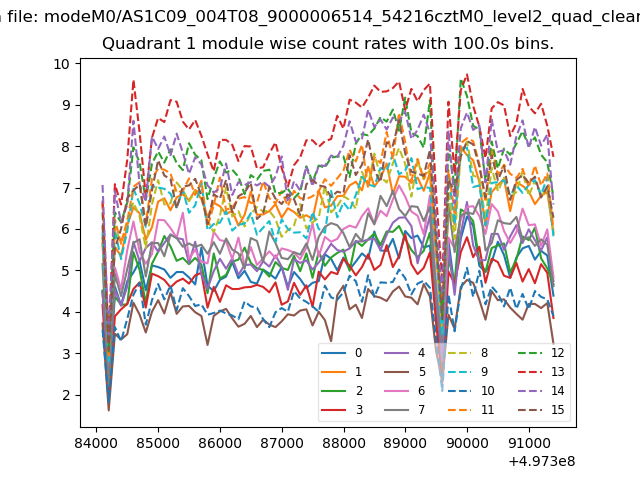
| Module-wise count rates for Quadrant A Data is divided into 100 sec bins |
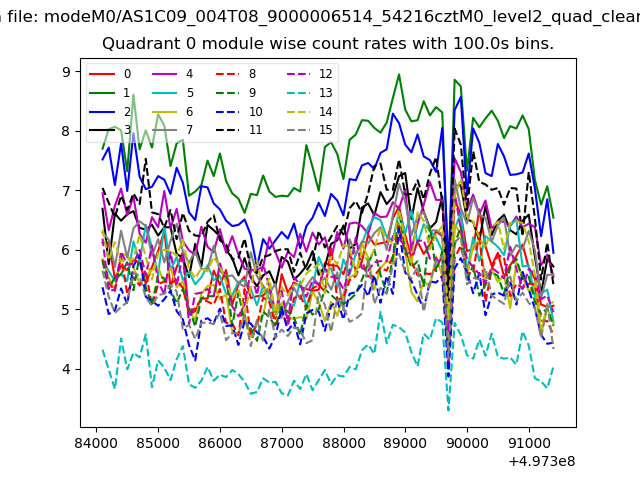 |
 |
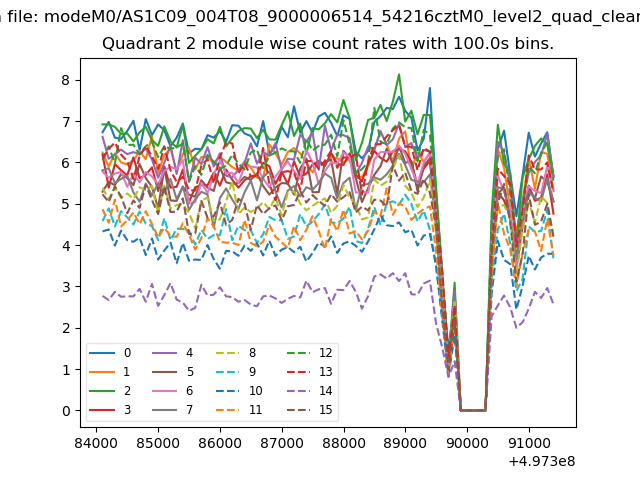
| Module-wise count rates for Quadrant B Data is divided into 100 sec bins |
 |
 |
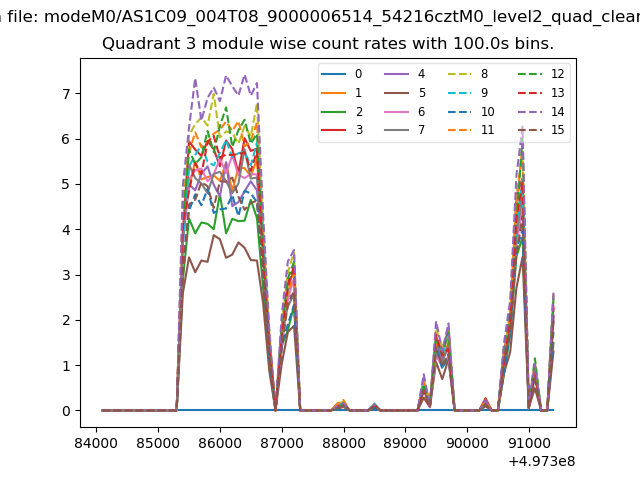
| Module-wise count rates for Quadrant C Data is divided into 100 sec bins |
 |
 |
| Module-wise count rates for Quadrant D Data is divided into 100 sec bins |
 |
 |
| Parameter | Plot |
|---|---|
| CZT HV Monitor | 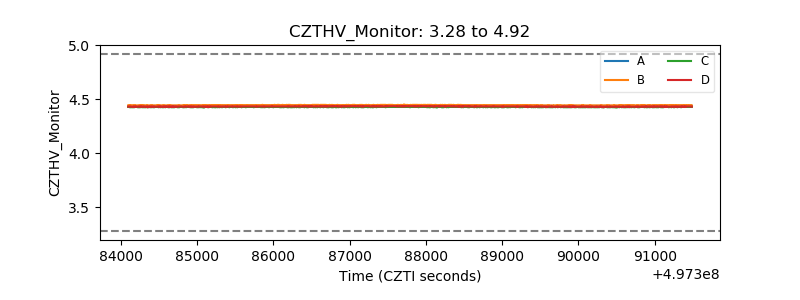 |
| D_VDD | 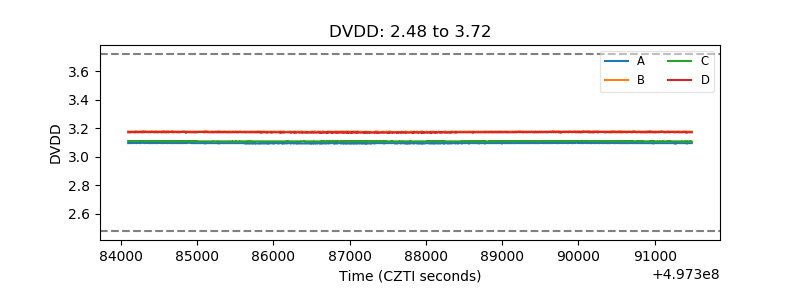 |
| Temperature 1 | 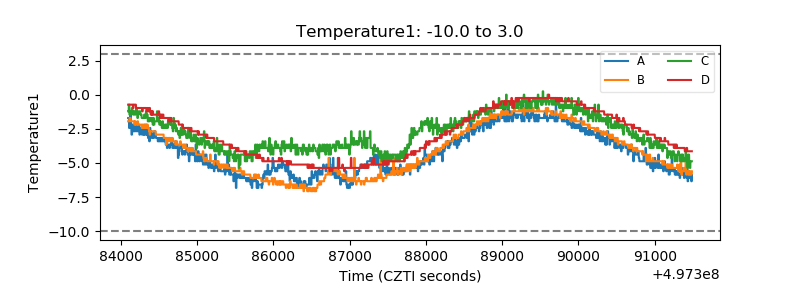 |
| Veto HV Monitor | 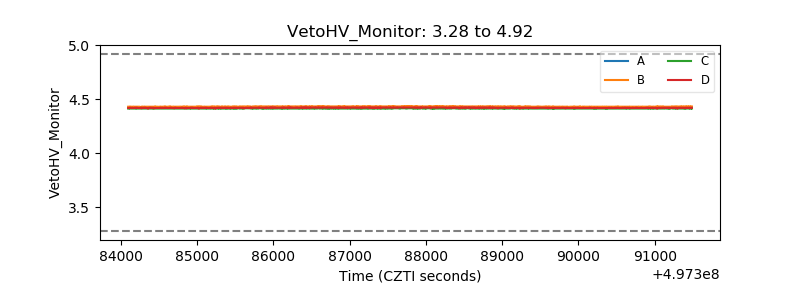 |
| Veto LLD | 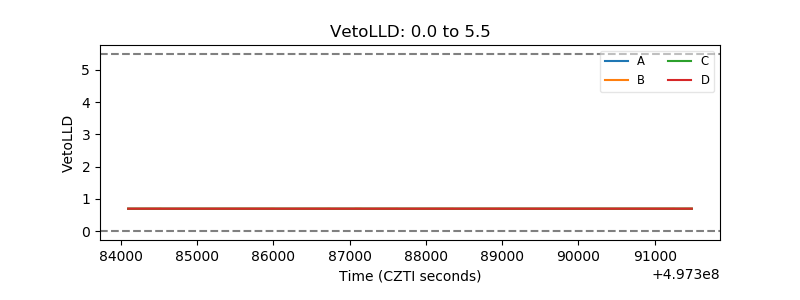 |
| Alpha Counter | 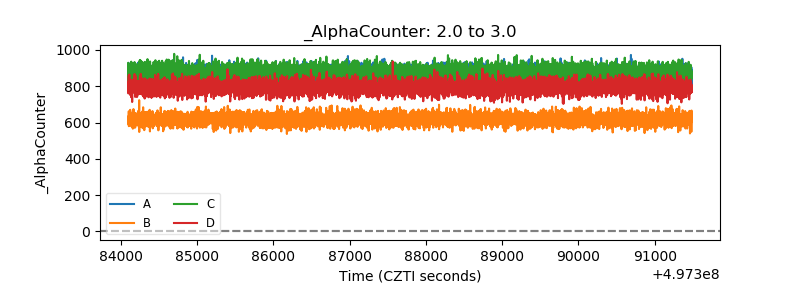 |
| _CPM_Rate | 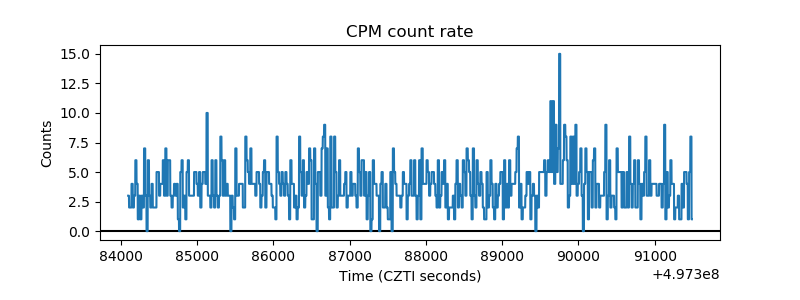 |
| CZT Counter | 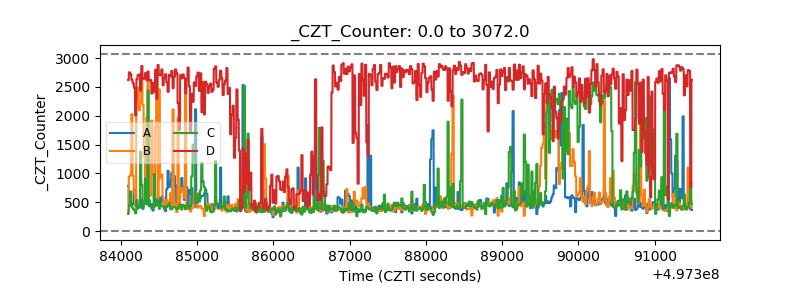 |
| +2.5 Volts monitor | 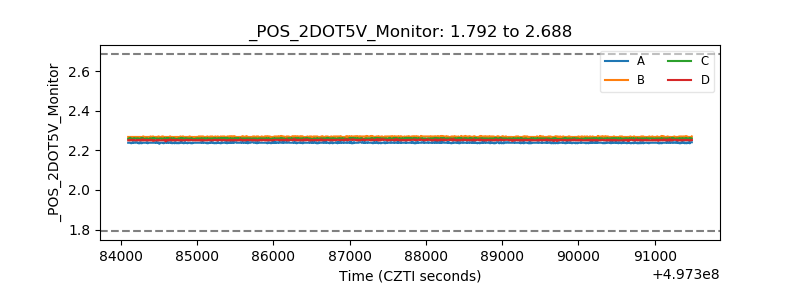 |
| +5 Volts monitor |  |
| _ROLL_ROT | 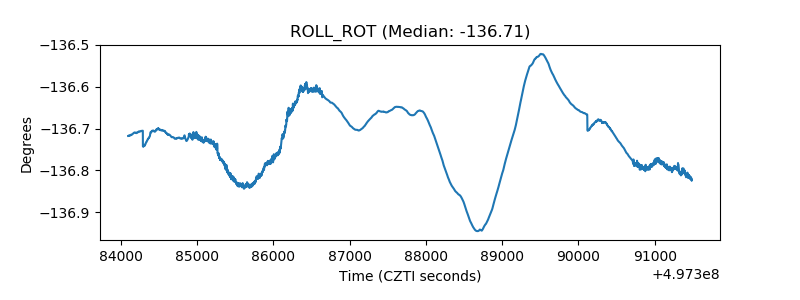 |
| _Roll_DEC | 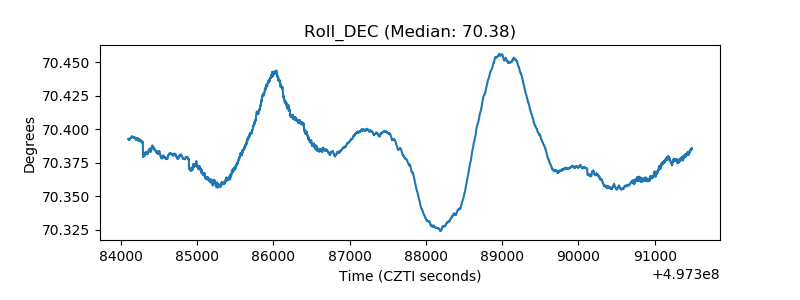 |
| _Roll_RA | 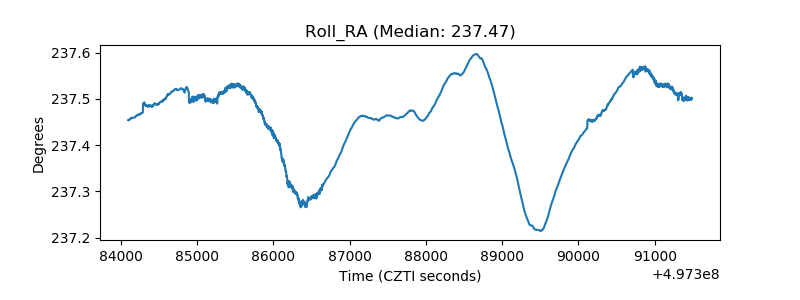 |
| Veto Counter | 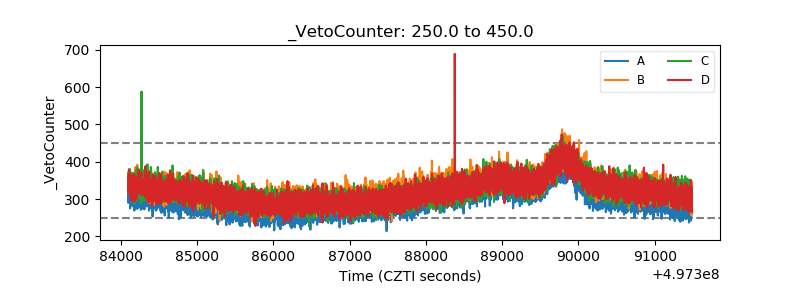 |