| Param | Original file | Final file |
|---|---|---|
| Filename | modeM0/AS1C09_004T08_9000006514_54217cztM0_level2.fits | modeM0/AS1C09_004T08_9000006514_54217cztM0_level2_quad_clean.evt |
| Size (bytes) | 878,405,760 | 95,682,240 |
| Size | 837.7 MB | 91.2 MB |
| Events in quadrant A | 4,747,715 | 711,301 |
| Events in quadrant B | 4,047,986 | 793,491 |
| Events in quadrant C | 6,156,460 | 596,490 |
| Events in quadrant D | 16,961,981 | 255,158 |
| Mode M0 | |||
|---|---|---|---|
| Quadrant | BADHDUFLAG | Total packets | Discarded packets |
| A | 0 | 19673 | 0 |
| B | 0 | 17559 | 0 |
| C | 0 | 23943 | 0 |
| D | 0 | 55732 | 8 |
| Mode SS | |||
|---|---|---|---|
| Quadrant | BADHDUFLAG | Total packets | Discarded packets |
| A | 0 | 156 | 0 |
| B | 0 | 156 | 0 |
| C | 0 | 156 | 0 |
| D | 0 | 156 | 0 |
| Quadrant | Total seconds | Saturated seconds | Saturation percentage |
|---|---|---|---|
| A | 7768 | 362 | 4.660144% |
| B | 7768 | 82 | 1.055613% |
| C | 7768 | 1106 | 14.237899% |
| D | 7767 | 4942 | 63.628170% |
Noise dominated data is calculated using 1-second bins in cleaned event files. If a bin has >2000 counts, and if more than 50% of those come from <1% of pixels, then it is considered to be noise-dominated and hence unusable.
| Quadrant | # 1 sec bins | Bins with >0 counts | Bins with >2000 counts | High rate bins dominated by noise | Noise dominated (total time) | Noise dominated (detector-on time) | Marked lightcurve |
|---|---|---|---|---|---|---|---|
| A | 7767 | 7767 | 285 | 285 | 3.67% | 3.67% | 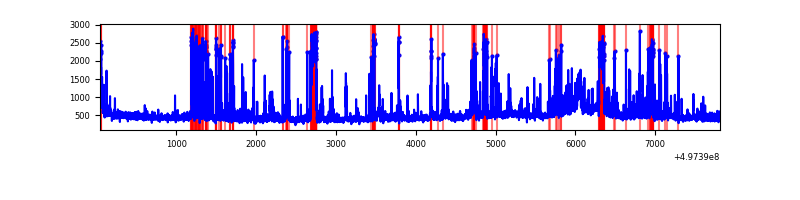 |
| B | 7767 | 7767 | 57 | 57 | 0.73% | 0.73% | 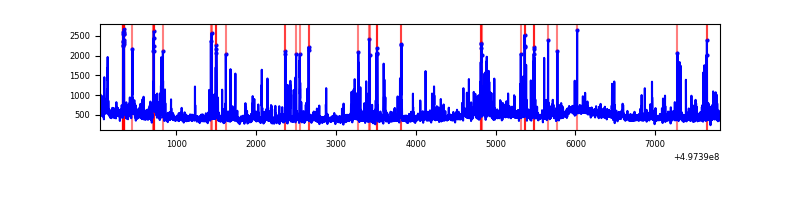 |
| C | 7767 | 7767 | 936 | 936 | 12.05% | 12.05% | 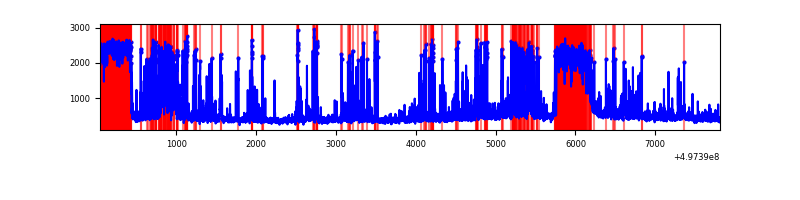 |
| D | 7767 | 7766 | 5077 | 5077 | 65.37% | 65.37% | 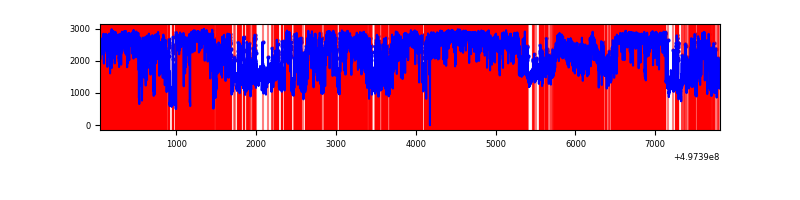 |
Top three noisy pixels from each quadrant. If the there are fewer than three noisy pixels in the level2.evt file, extra rows are filled as -1
| Pixel properties | Quadrant properties | ||||||
|---|---|---|---|---|---|---|---|
| Quadrant | DetID | PixID | Counts | Sigma | Mean | Median | Sigma |
| A | 7 | 29 | 663232 | 3264.24 | 806 | 784 | 202.9 |
| A | 15 | 174 | 300085 | 1474.82 | 806 | 784 | 202.9 |
| A | 4 | 3 | 116870 | 572.02 | 806 | 784 | 202.9 |
| B | 8 | 234 | 247438 | 1419.84 | 816 | 788 | 173.7 |
| B | 4 | 171 | 175053 | 1003.15 | 816 | 788 | 173.7 |
| B | 5 | 236 | 151193 | 865.8 | 816 | 788 | 173.7 |
| C | 15 | 198 | 1188327 | 5975.51 | 727 | 719 | 198.7 |
| C | 15 | 215 | 1055022 | 5304.78 | 727 | 719 | 198.7 |
| C | 15 | 216 | 485033 | 2436.85 | 727 | 719 | 198.7 |
| D | 8 | 176 | 10867181 | 73311.85 | 513 | 490 | 148.2 |
| D | 2 | 172 | 3374945 | 22765.67 | 513 | 490 | 148.2 |
| D | 1 | 3 | 121027 | 813.2 | 513 | 490 | 148.2 |
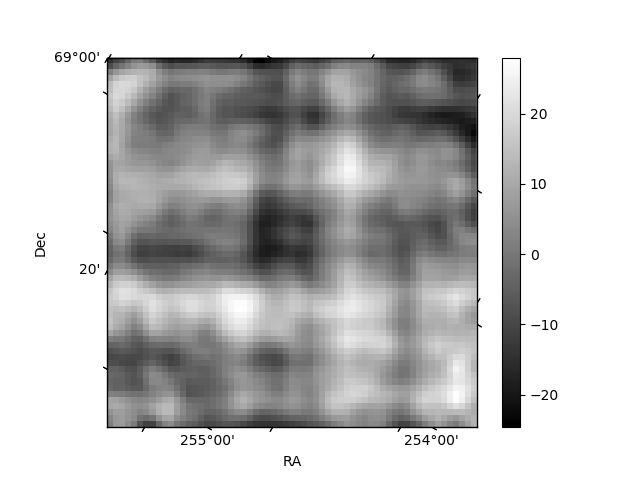
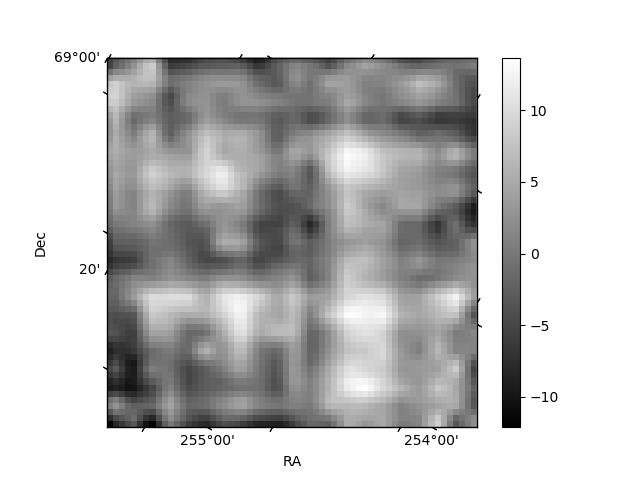
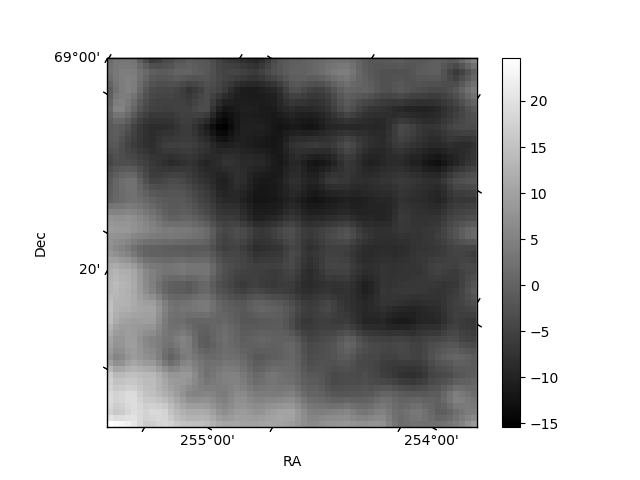
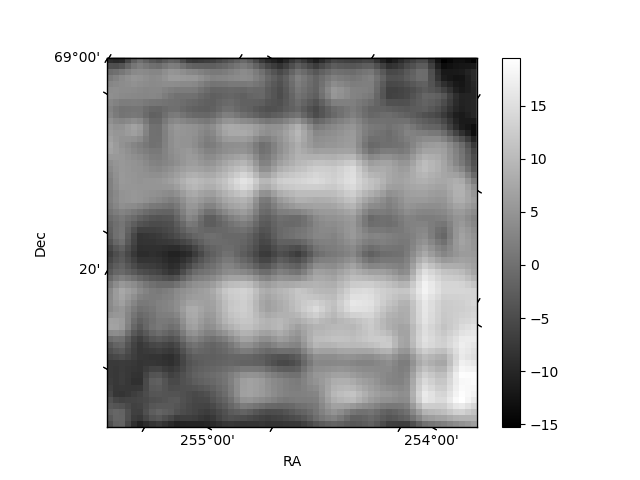
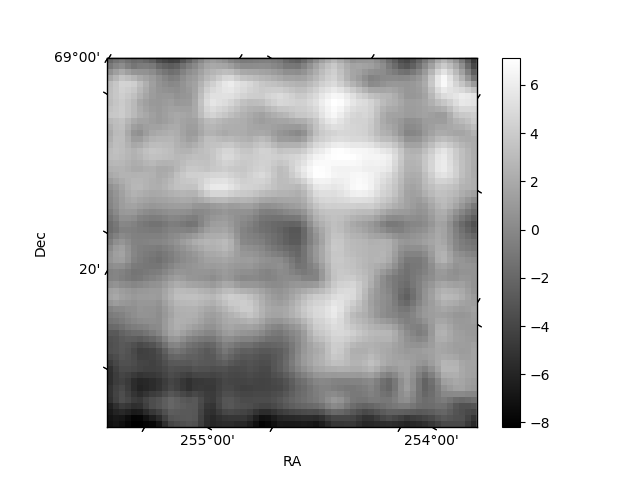
Histogram calculated using DETX and DETY for each event in the final _common_clean file
| Quadrant A | 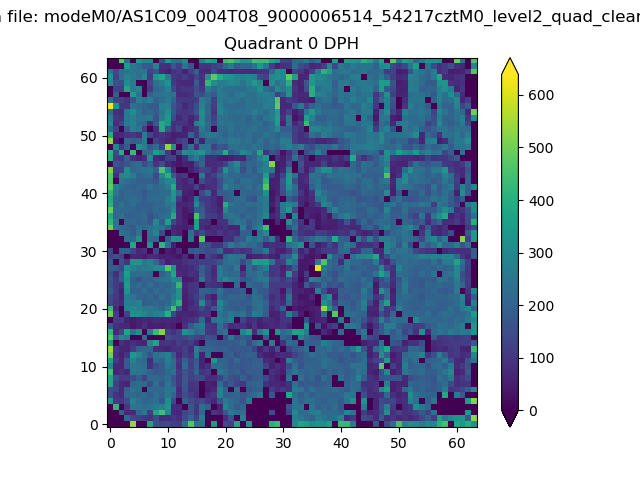 |
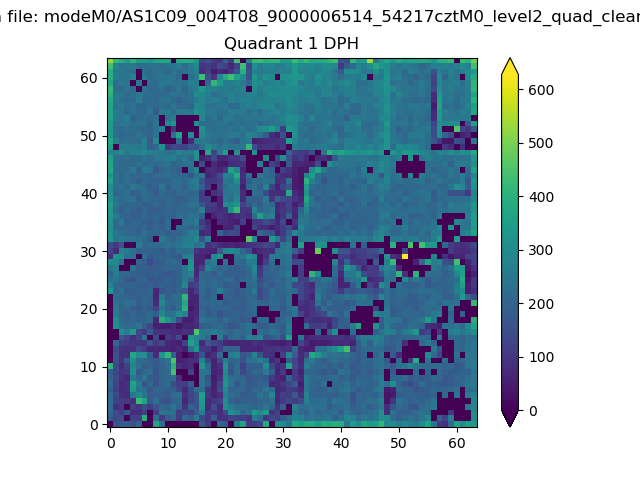 |
Quadrant B |
|---|---|---|---|
| Quadrant D | 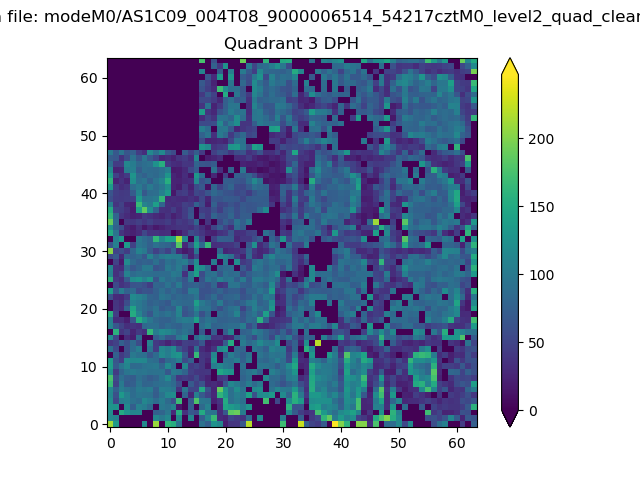 |
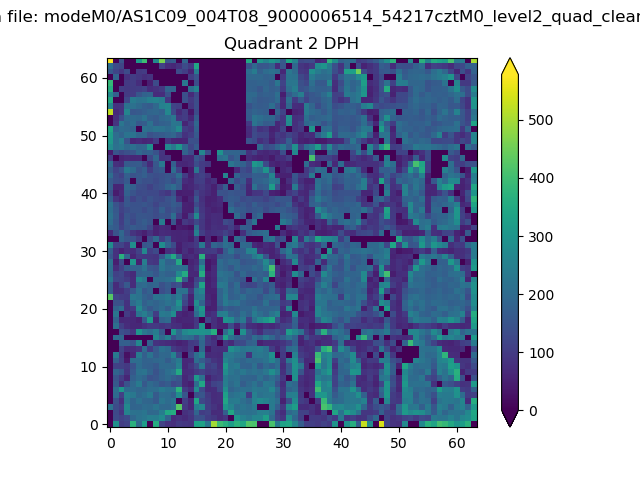 |
Quadrant C |
| Plot type | Count rate plots | Images |
|---|---|---|
| Comparison with Poisson distribution Blue bars denote a histogram of data divided into 1 sec bins. Red curve is a Poisson curve with rate = median count rate of data. |
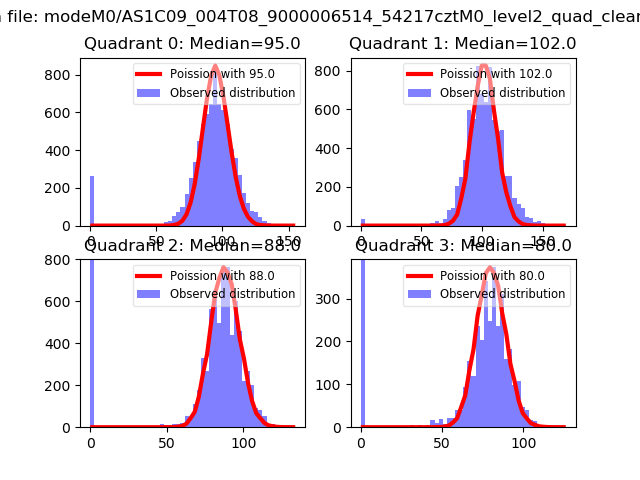 |
 |
| Quadrant-wise count rates Data is divided into 100 sec bins |
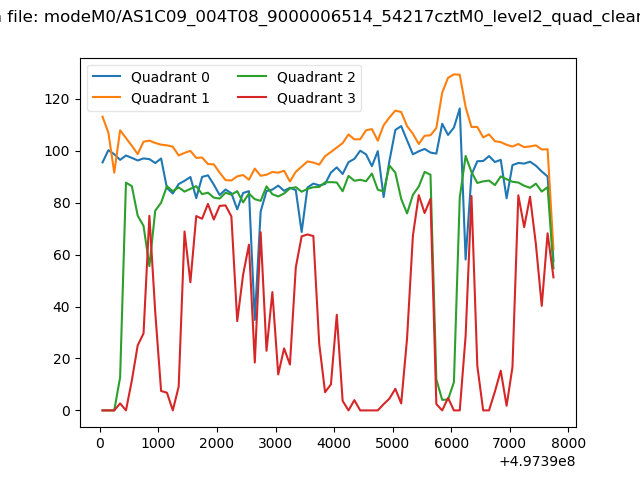 |
|
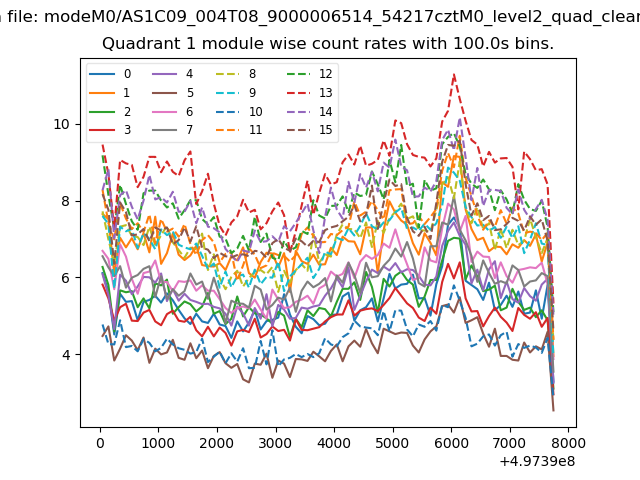
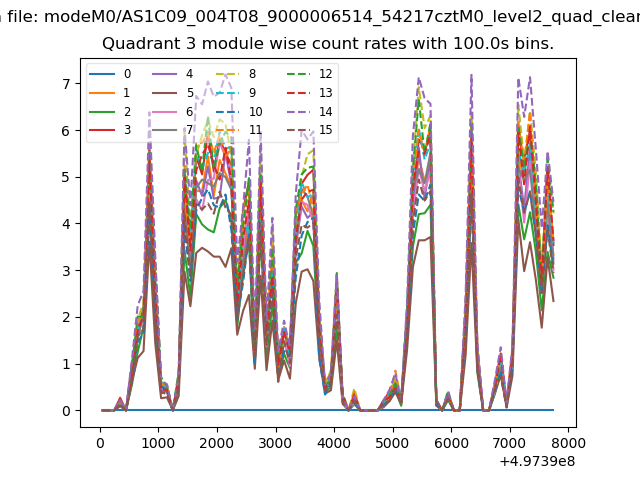
| Module-wise count rates for Quadrant A Data is divided into 100 sec bins |
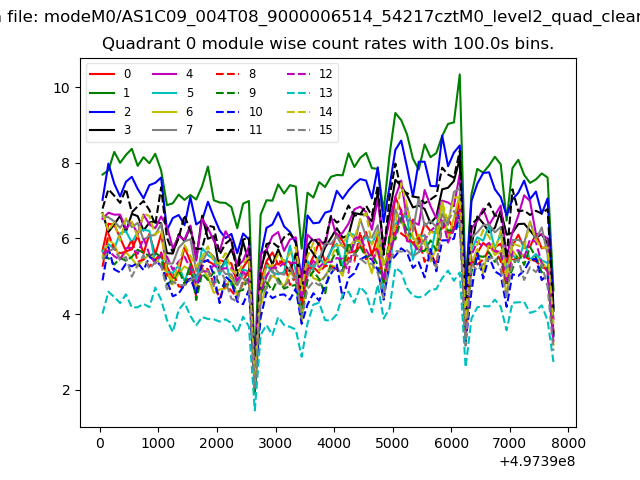 |
 |
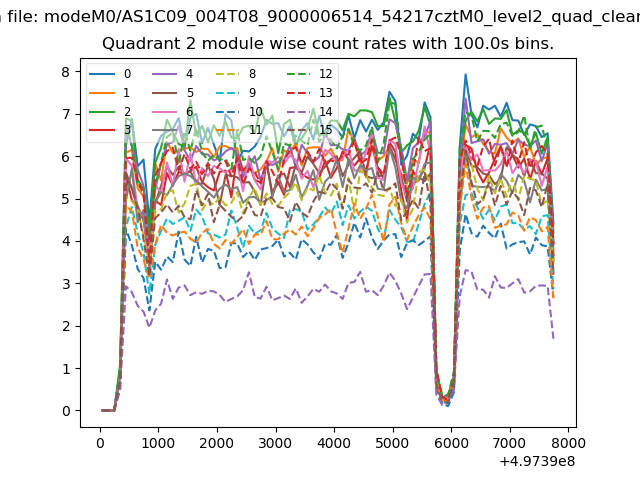
| Module-wise count rates for Quadrant B Data is divided into 100 sec bins |
 |
 |
| Module-wise count rates for Quadrant C Data is divided into 100 sec bins |
 |
 |
| Module-wise count rates for Quadrant D Data is divided into 100 sec bins |
 |
 |
| Parameter | Plot |
|---|---|
| CZT HV Monitor | 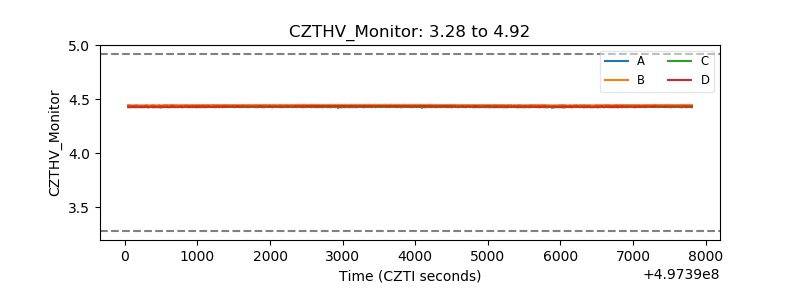 |
| D_VDD | 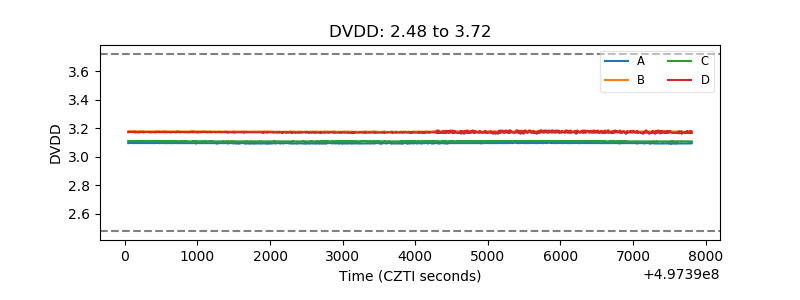 |
| Temperature 1 | 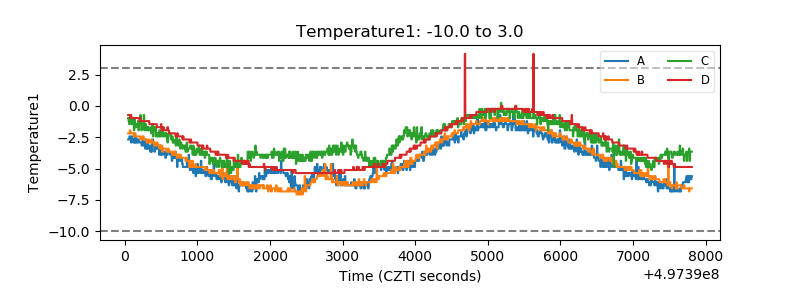 |
| Veto HV Monitor | 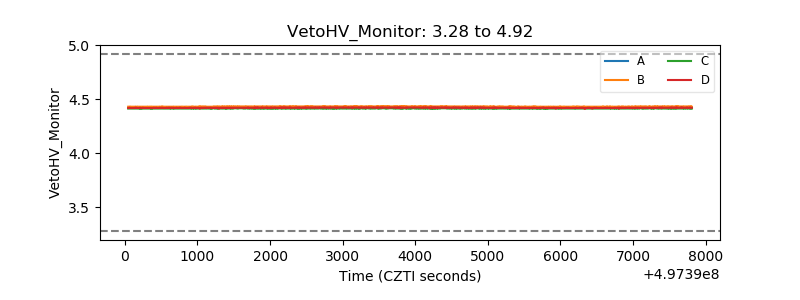 |
| Veto LLD | 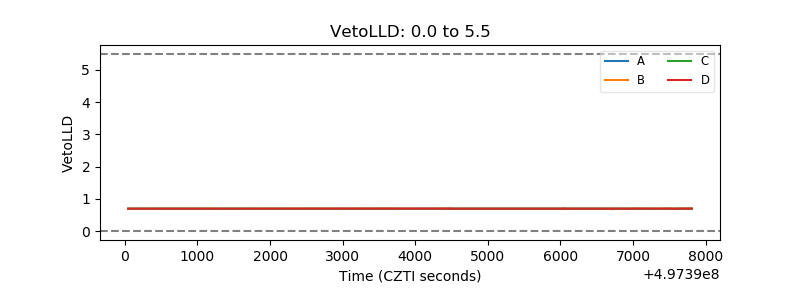 |
| Alpha Counter | 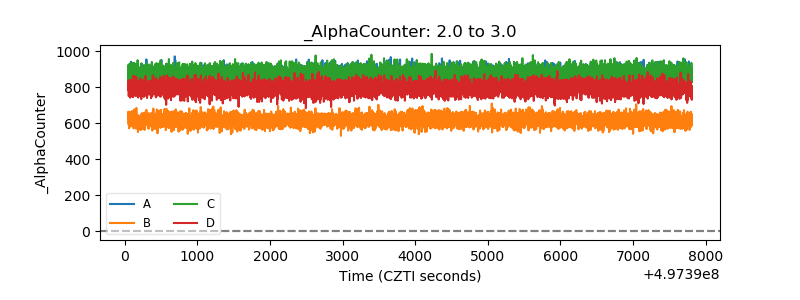 |
| _CPM_Rate | 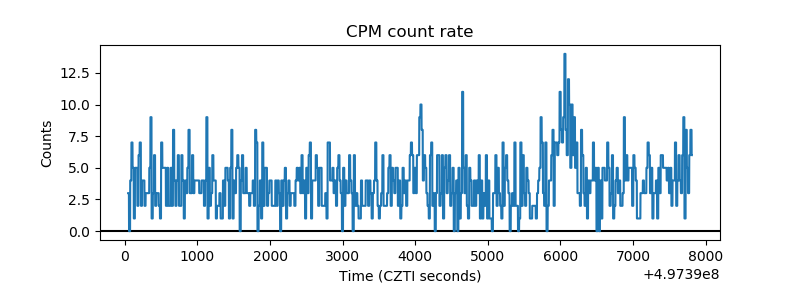 |
| CZT Counter | 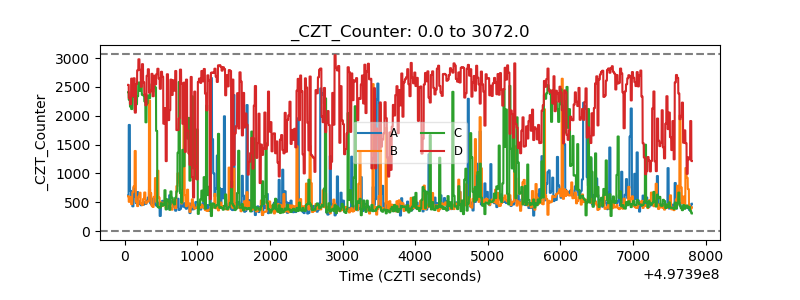 |
| +2.5 Volts monitor | 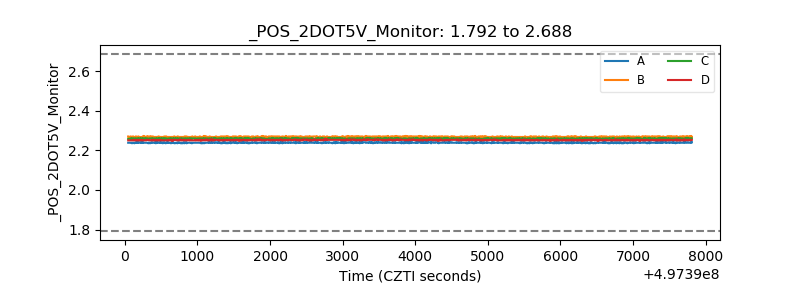 |
| +5 Volts monitor | 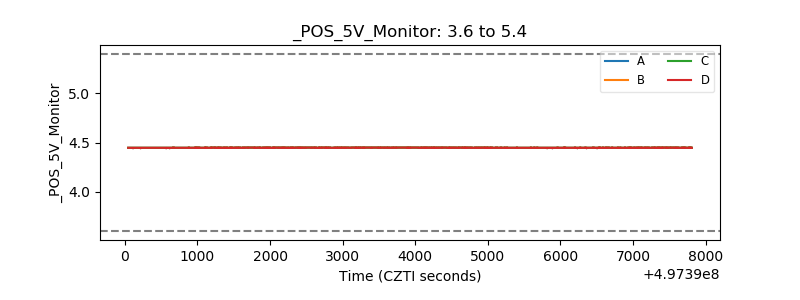 |
| _ROLL_ROT | 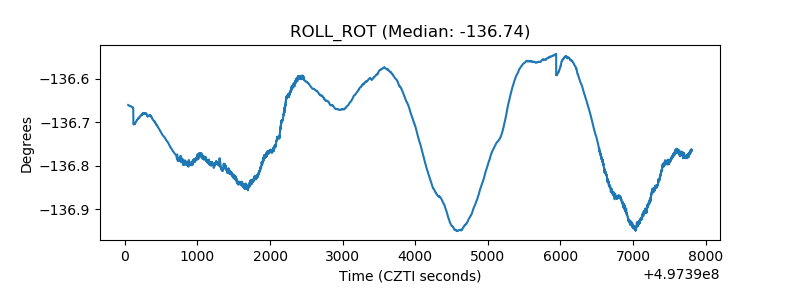 |
| _Roll_DEC | 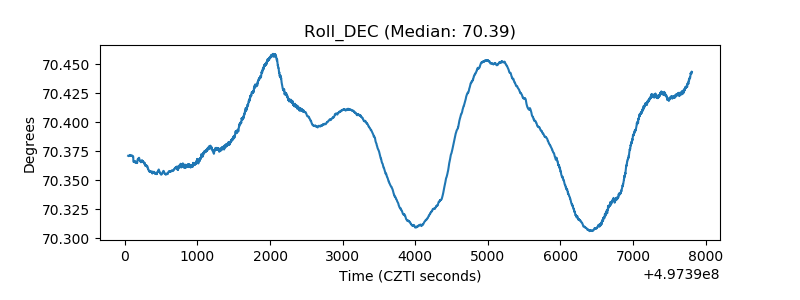 |
| _Roll_RA | 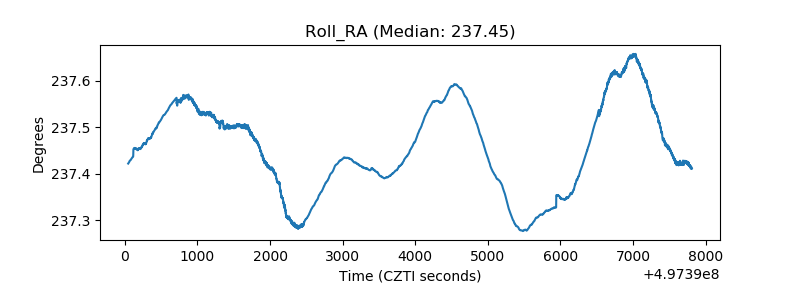 |
| Veto Counter | 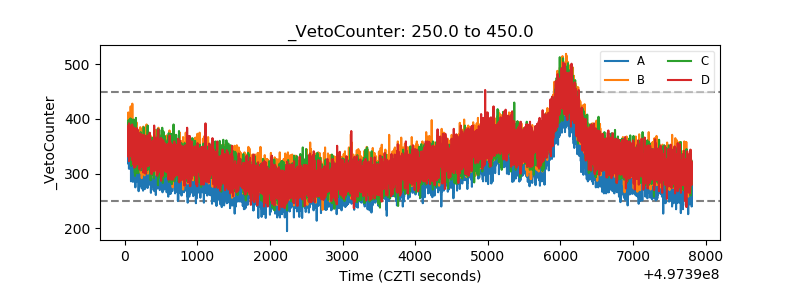 |