| Param | Original file | Final file |
|---|---|---|
| Filename | modeM0/AS1C09_004T08_9000006514_54220cztM0_level2.fits | modeM0/AS1C09_004T08_9000006514_54220cztM0_level2_quad_clean.evt |
| Size (bytes) | 1,814,042,880 | 238,593,600 |
| Size | 1.7 GB | 227.5 MB |
| Events in quadrant A | 10,633,461 | 1,717,850 |
| Events in quadrant B | 9,700,190 | 1,902,737 |
| Events in quadrant C | 9,954,903 | 1,629,745 |
| Events in quadrant D | 35,387,258 | 661,187 |
| Mode M0 | |||
|---|---|---|---|
| Quadrant | BADHDUFLAG | Total packets | Discarded packets |
| A | 0 | 45394 | 3 |
| B | 0 | 42624 | 3 |
| C | 0 | 44139 | 4 |
| D | 0 | 118312 | 3 |
| Mode M9 | |||
|---|---|---|---|
| Quadrant | BADHDUFLAG | Total packets | Discarded packets |
| A | 0 | 16 | 0 |
| B | 0 | 16 | 0 |
| C | 0 | 16 | 0 |
| D | 0 | 16 | 0 |
| Mode SS | |||
|---|---|---|---|
| Quadrant | BADHDUFLAG | Total packets | Discarded packets |
| A | 0 | 386 | 0 |
| B | 0 | 386 | 0 |
| C | 0 | 386 | 0 |
| D | 0 | 386 | 0 |
| Quadrant | Total seconds | Saturated seconds | Saturation percentage |
|---|---|---|---|
| A | 19040 | 555 | 2.914916% |
| B | 19041 | 321 | 1.685836% |
| C | 19040 | 570 | 2.993697% |
| D | 19040 | 11424 | 60.000000% |
Noise dominated data is calculated using 1-second bins in cleaned event files. If a bin has >2000 counts, and if more than 50% of those come from <1% of pixels, then it is considered to be noise-dominated and hence unusable.
| Quadrant | # 1 sec bins | Bins with >0 counts | Bins with >2000 counts | High rate bins dominated by noise | Noise dominated (total time) | Noise dominated (detector-on time) | Marked lightcurve |
|---|---|---|---|---|---|---|---|
| A | 20639 | 19042 | 369 | 369 | 1.79% | 1.94% |  |
| B | 20640 | 19044 | 123 | 123 | 0.60% | 0.65% | 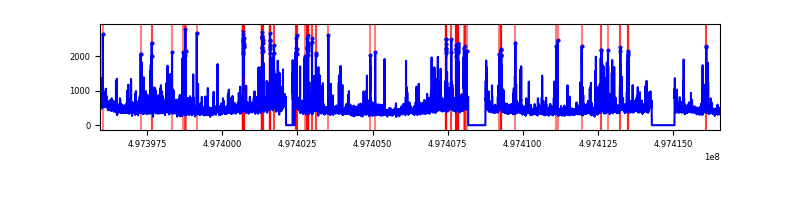 |
| C | 20639 | 19043 | 432 | 432 | 2.09% | 2.27% | 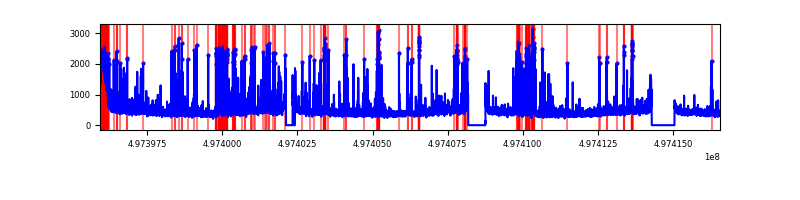 |
| D | 20639 | 19043 | 10334 | 10334 | 50.07% | 54.27% | 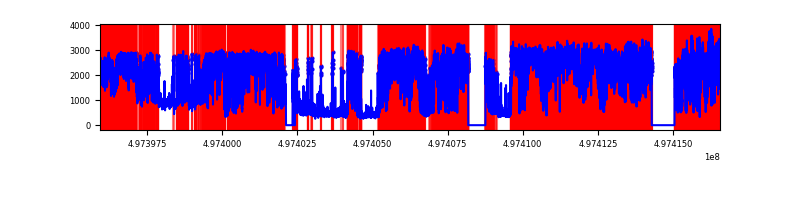 |
Top three noisy pixels from each quadrant. If the there are fewer than three noisy pixels in the level2.evt file, extra rows are filled as -1
| Pixel properties | Quadrant properties | ||||||
|---|---|---|---|---|---|---|---|
| Quadrant | DetID | PixID | Counts | Sigma | Mean | Median | Sigma |
| A | 3 | 130 | 614896 | 1260.59 | 1985 | 1937 | 486.2 |
| A | 12 | 17 | 472769 | 968.3 | 1985 | 1937 | 486.2 |
| A | 14 | 235 | 434758 | 890.13 | 1985 | 1937 | 486.2 |
| B | 5 | 236 | 599240 | 1419.71 | 1992 | 1923 | 420.7 |
| B | 4 | 171 | 478541 | 1132.83 | 1992 | 1923 | 420.7 |
| B | 0 | 213 | 157968 | 370.89 | 1992 | 1923 | 420.7 |
| C | 15 | 198 | 475186 | 903.33 | 1925 | 1907 | 523.9 |
| C | 15 | 215 | 452659 | 860.34 | 1925 | 1907 | 523.9 |
| C | 14 | 254 | 290615 | 551.05 | 1925 | 1907 | 523.9 |
| D | 8 | 176 | 26441950 | 77610.24 | 1173 | 1121 | 340.7 |
| D | 2 | 172 | 2219346 | 6511.03 | 1173 | 1121 | 340.7 |
| D | 2 | 62 | 1039096 | 3046.71 | 1173 | 1121 | 340.7 |
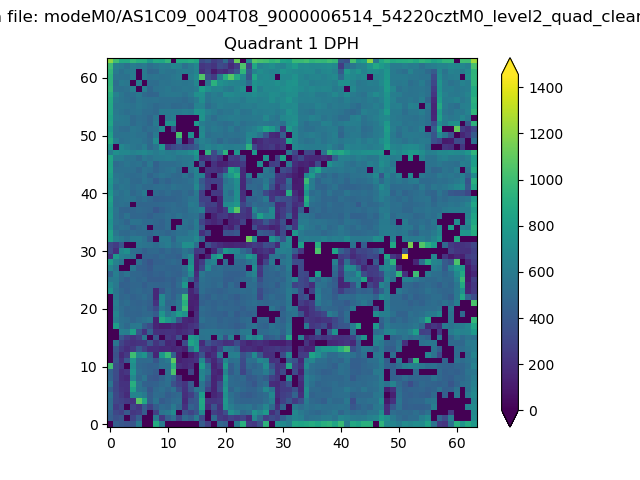
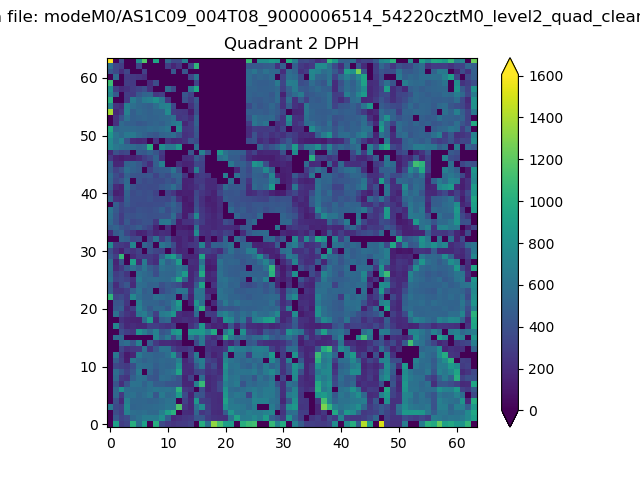
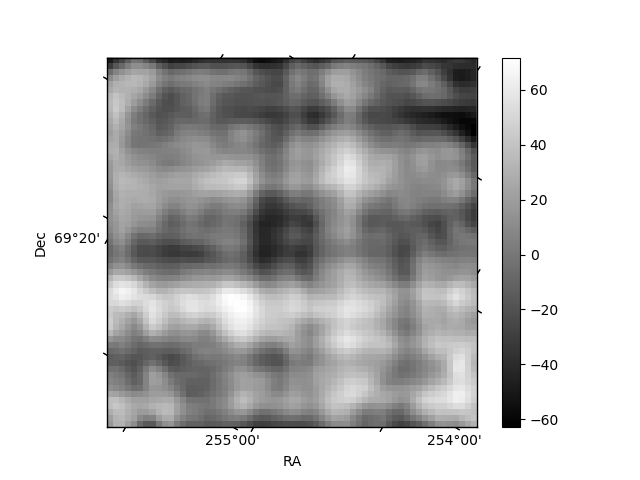
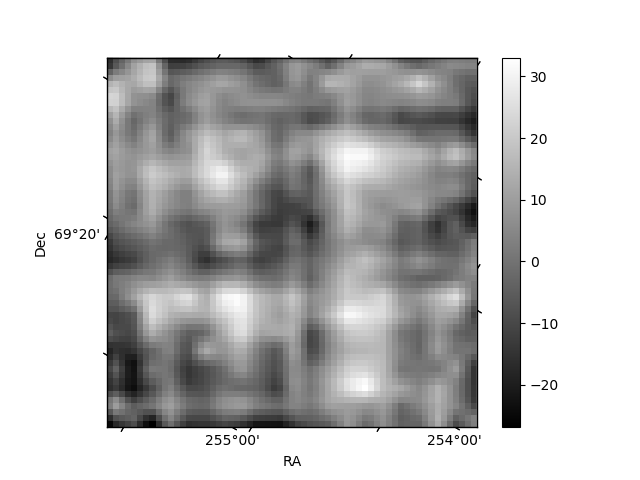
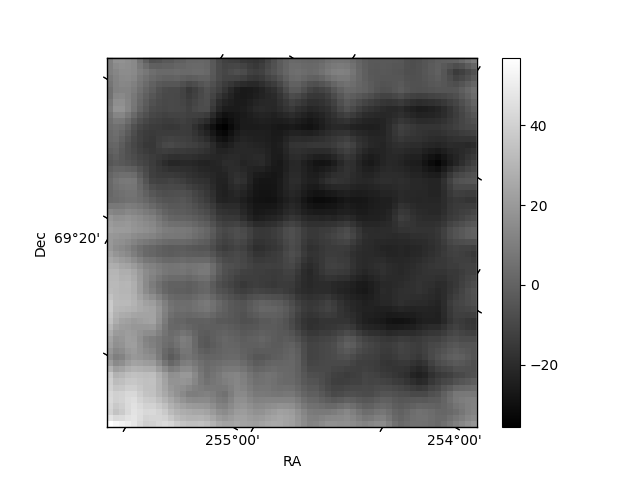
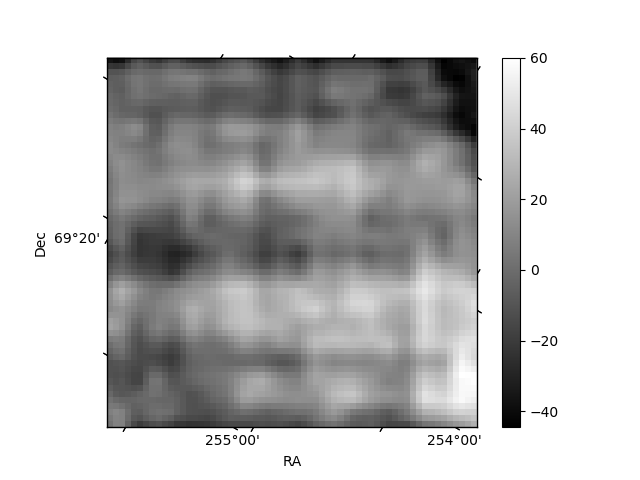
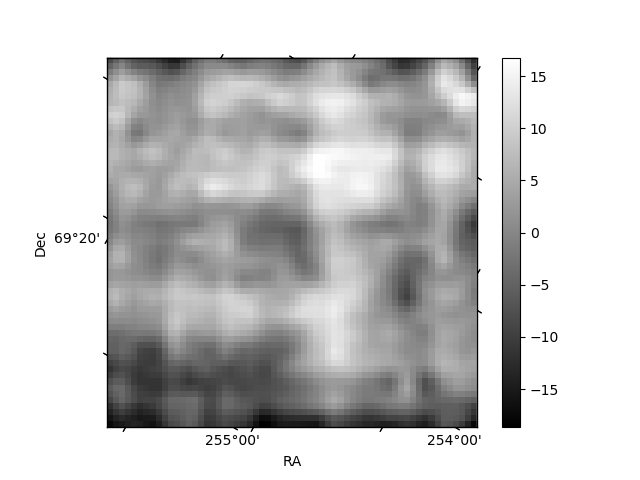
Histogram calculated using DETX and DETY for each event in the final _common_clean file
| Quadrant A | 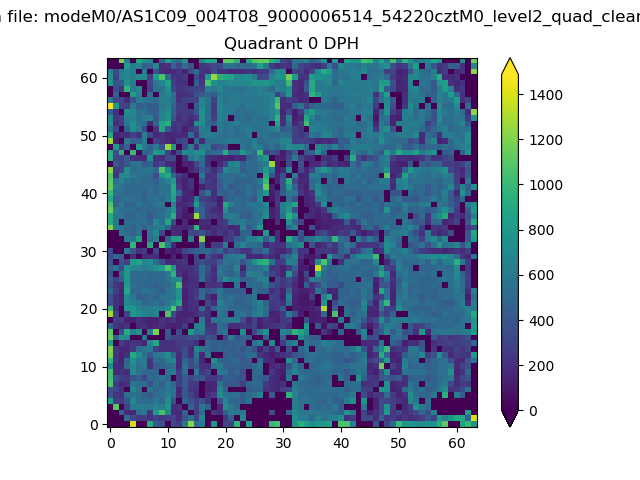 |
 |
Quadrant B |
|---|---|---|---|
| Quadrant D | 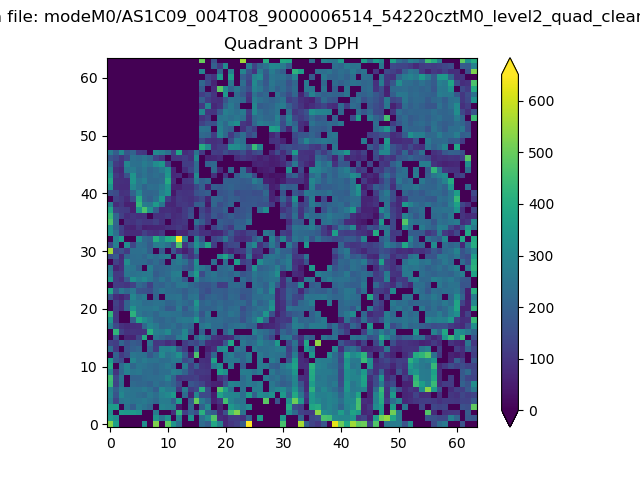 |
 |
Quadrant C |
| Plot type | Count rate plots | Images |
|---|---|---|
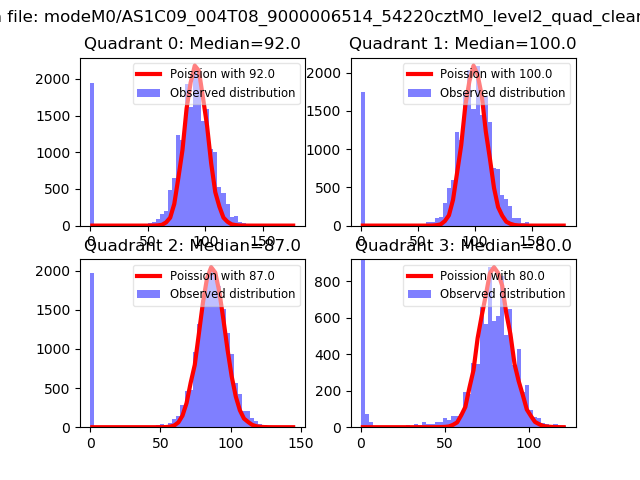
| Comparison with Poisson distribution Blue bars denote a histogram of data divided into 1 sec bins. Red curve is a Poisson curve with rate = median count rate of data. |
 |
 |
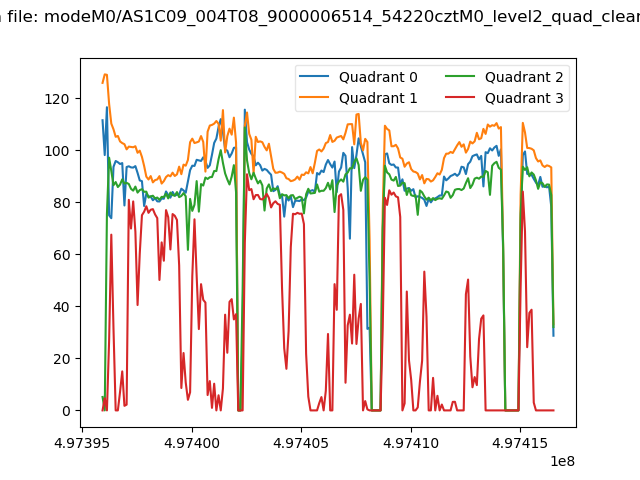
| Quadrant-wise count rates Data is divided into 100 sec bins |
 |
|
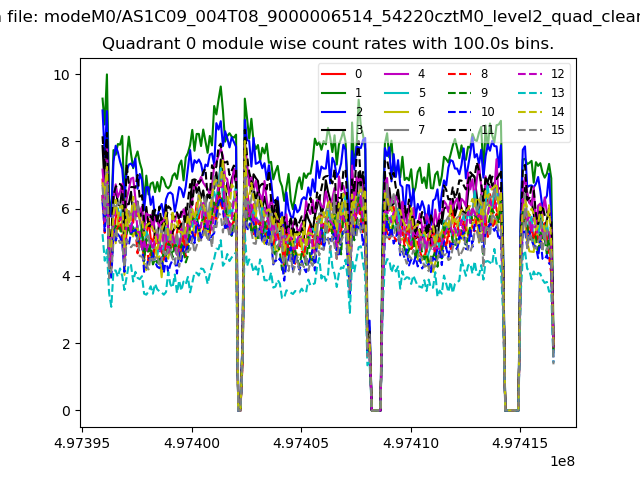
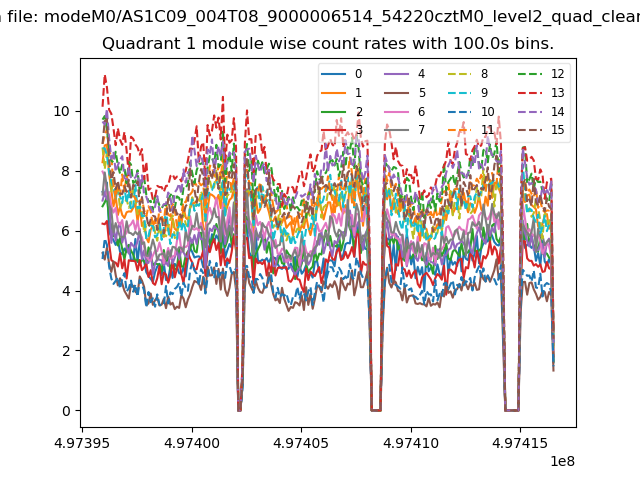
| Module-wise count rates for Quadrant A Data is divided into 100 sec bins |
 |
 |
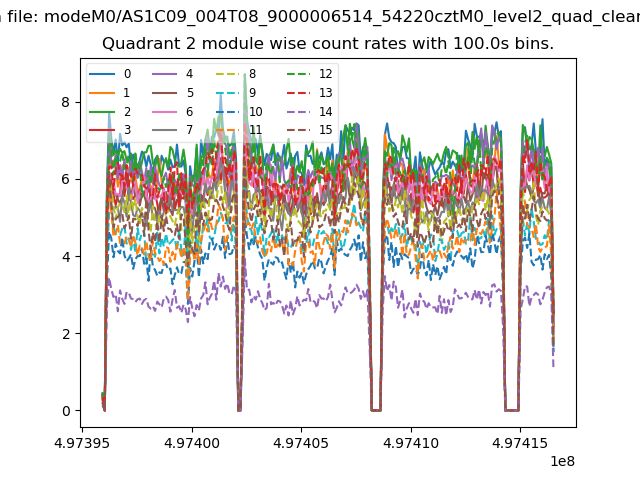
| Module-wise count rates for Quadrant B Data is divided into 100 sec bins |
 |
 |
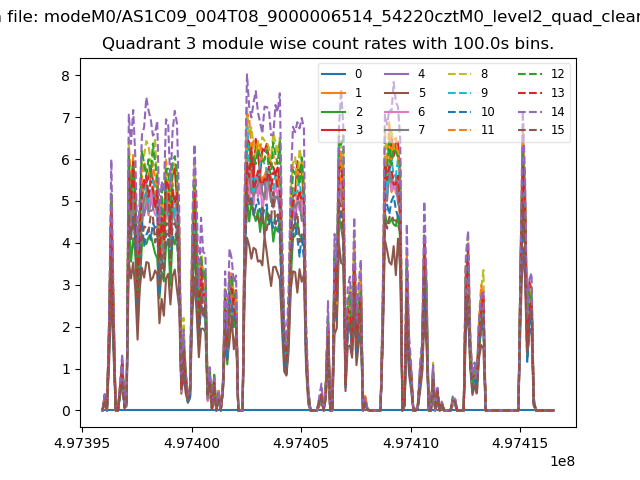
| Module-wise count rates for Quadrant C Data is divided into 100 sec bins |
 |
 |
| Module-wise count rates for Quadrant D Data is divided into 100 sec bins |
 |
 |
| Parameter | Plot |
|---|---|
| CZT HV Monitor |  |
| D_VDD | 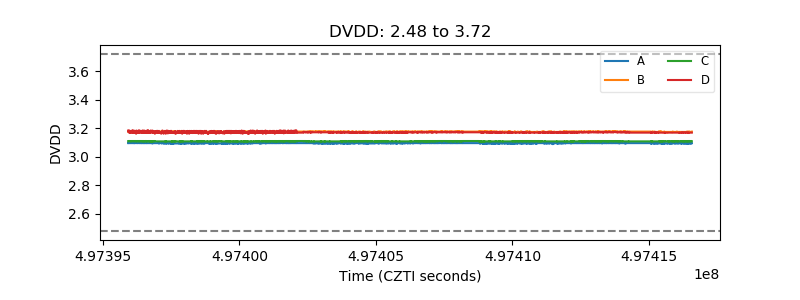 |
| Temperature 1 | 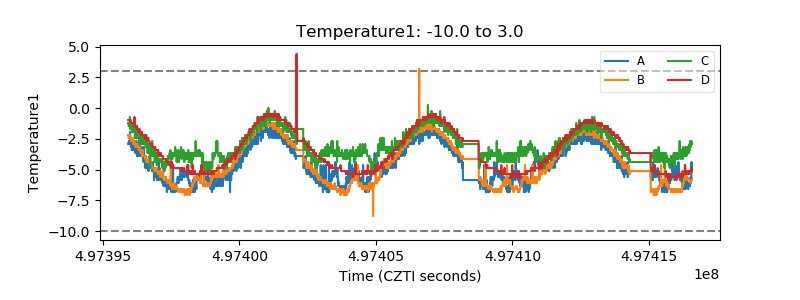 |
| Veto HV Monitor | 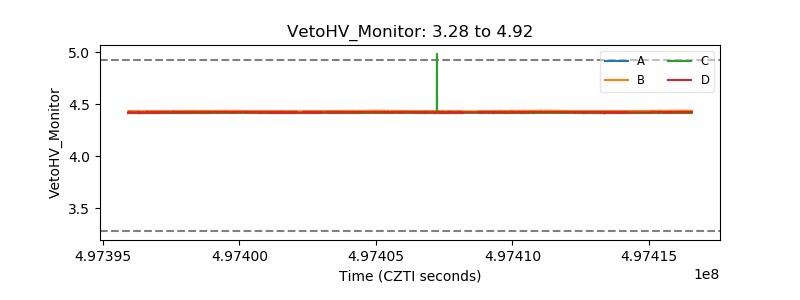 |
| Veto LLD | 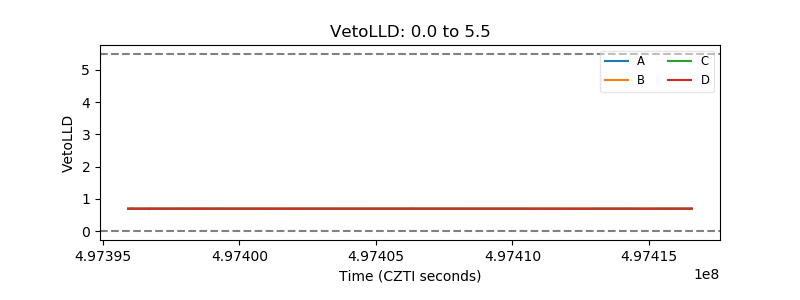 |
| Alpha Counter | 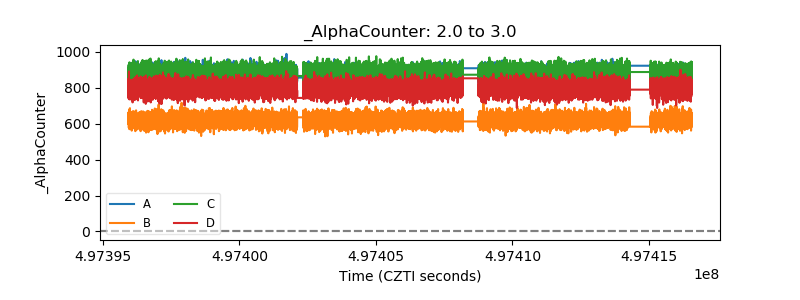 |
| _CPM_Rate | 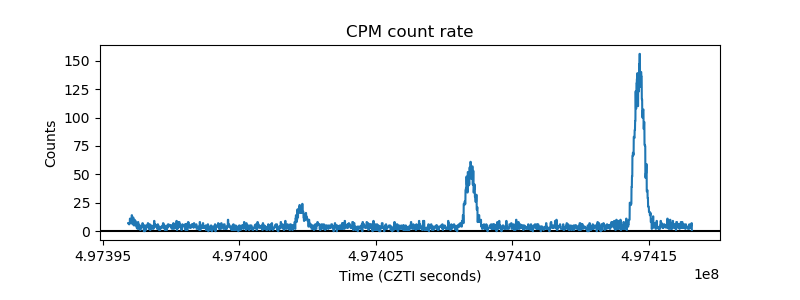 |
| CZT Counter |  |
| +2.5 Volts monitor | 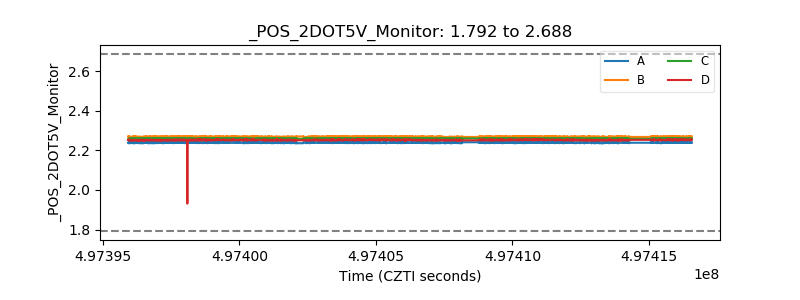 |
| +5 Volts monitor |  |
| _ROLL_ROT | 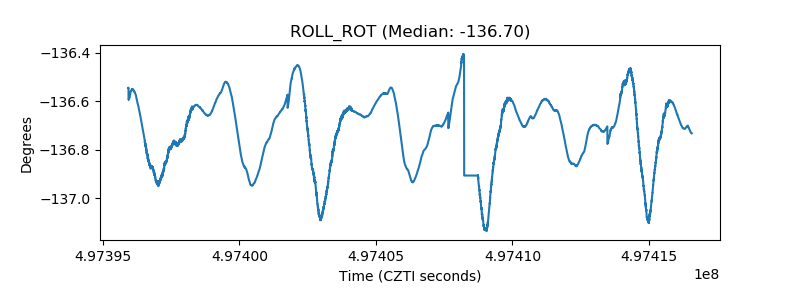 |
| _Roll_DEC | 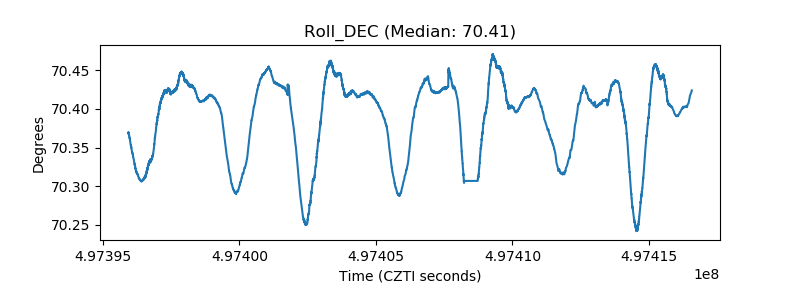 |
| _Roll_RA | 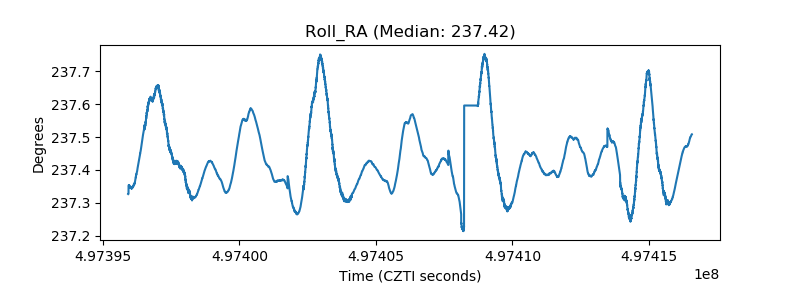 |
| Veto Counter | 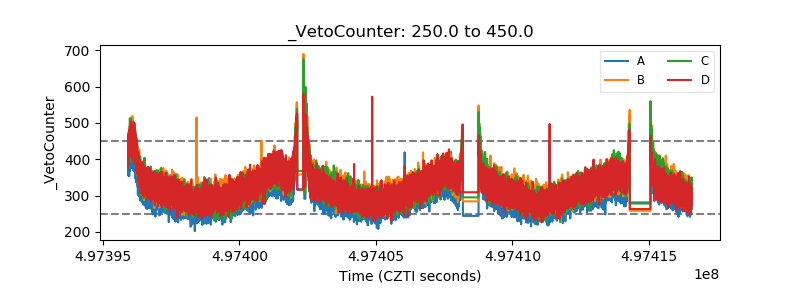 |