| Param | Original file | Final file |
|---|---|---|
| Filename | modeM0/AS1C09_004T08_9000006514_54221cztM0_level2.fits | modeM0/AS1C09_004T08_9000006514_54221cztM0_level2_quad_clean.evt |
| Size (bytes) | 619,122,240 | 75,306,240 |
| Size | 590.4 MB | 71.8 MB |
| Events in quadrant A | 3,776,248 | 543,186 |
| Events in quadrant B | 3,140,899 | 610,250 |
| Events in quadrant C | 2,742,340 | 543,230 |
| Events in quadrant D | 12,780,082 | 154,721 |
| Mode M0 | |||
|---|---|---|---|
| Quadrant | BADHDUFLAG | Total packets | Discarded packets |
| A | 0 | 15630 | 1 |
| B | 0 | 13752 | 1 |
| C | 0 | 12920 | 1 |
| D | 0 | 42184 | 1 |
| Mode M9 | |||
|---|---|---|---|
| Quadrant | BADHDUFLAG | Total packets | Discarded packets |
| A | 0 | 9 | 0 |
| B | 0 | 9 | 0 |
| C | 0 | 9 | 0 |
| D | 0 | 9 | 0 |
| Mode SS | |||
|---|---|---|---|
| Quadrant | BADHDUFLAG | Total packets | Discarded packets |
| A | 0 | 124 | 0 |
| B | 0 | 124 | 0 |
| C | 0 | 124 | 0 |
| D | 0 | 124 | 0 |
| Quadrant | Total seconds | Saturated seconds | Saturation percentage |
|---|---|---|---|
| A | 6141 | 361 | 5.878521% |
| B | 6141 | 125 | 2.035499% |
| C | 6141 | 32 | 0.521088% |
| D | 6142 | 4487 | 73.054380% |
Noise dominated data is calculated using 1-second bins in cleaned event files. If a bin has >2000 counts, and if more than 50% of those come from <1% of pixels, then it is considered to be noise-dominated and hence unusable.
| Quadrant | # 1 sec bins | Bins with >0 counts | Bins with >2000 counts | High rate bins dominated by noise | Noise dominated (total time) | Noise dominated (detector-on time) | Marked lightcurve |
|---|---|---|---|---|---|---|---|
| A | 7041 | 6142 | 309 | 309 | 4.39% | 5.03% | 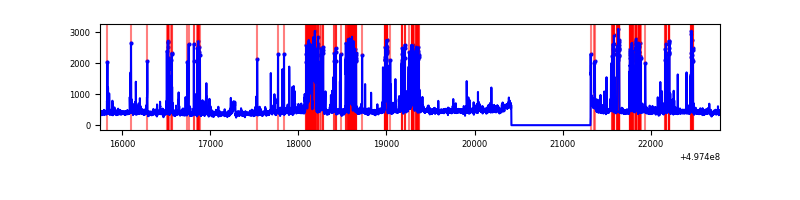 |
| B | 7041 | 6142 | 67 | 67 | 0.95% | 1.09% | 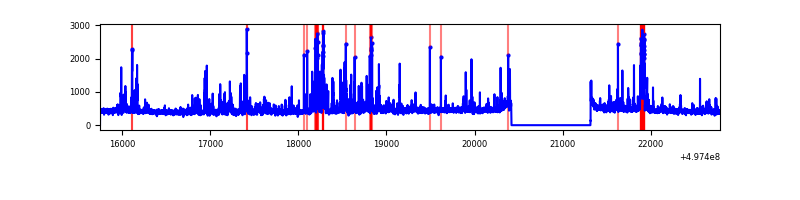 |
| C | 7041 | 6142 | 14 | 14 | 0.20% | 0.23% | 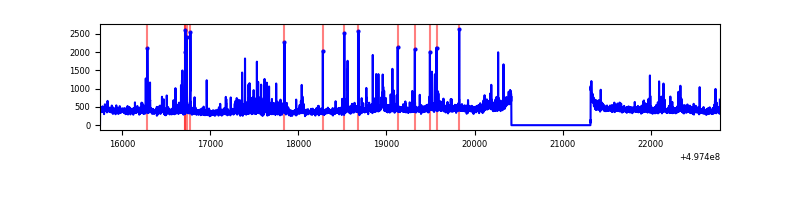 |
| D | 7042 | 6143 | 3747 | 3747 | 53.21% | 61.00% | 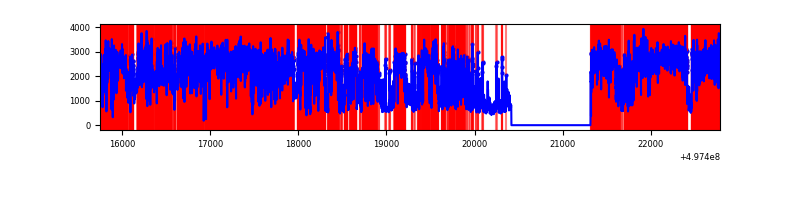 |
Top three noisy pixels from each quadrant. If the there are fewer than three noisy pixels in the level2.evt file, extra rows are filled as -1
| Pixel properties | Quadrant properties | ||||||
|---|---|---|---|---|---|---|---|
| Quadrant | DetID | PixID | Counts | Sigma | Mean | Median | Sigma |
| A | 12 | 17 | 964628 | 6278.22 | 623 | 608 | 153.5 |
| A | 12 | 194 | 128645 | 833.84 | 623 | 608 | 153.5 |
| A | 4 | 78 | 79193 | 511.78 | 623 | 608 | 153.5 |
| B | 4 | 171 | 258398 | 1863.58 | 632 | 610 | 138.3 |
| B | 5 | 236 | 130940 | 942.17 | 632 | 610 | 138.3 |
| B | 5 | 185 | 95672 | 687.22 | 632 | 610 | 138.3 |
| C | 15 | 198 | 112773 | 660.3 | 616 | 610 | 169.9 |
| C | 14 | 254 | 55635 | 323.93 | 616 | 610 | 169.9 |
| C | 12 | 252 | 43428 | 252.07 | 616 | 610 | 169.9 |
| D | 8 | 176 | 11306595 | 136949.19 | 284 | 270 | 82.6 |
| D | 13 | 84 | 58479 | 705.06 | 284 | 270 | 82.6 |
| D | 2 | 62 | 55356 | 667.23 | 284 | 270 | 82.6 |
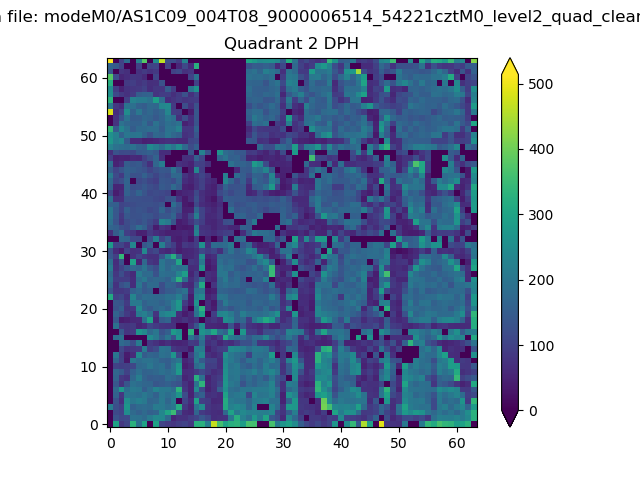
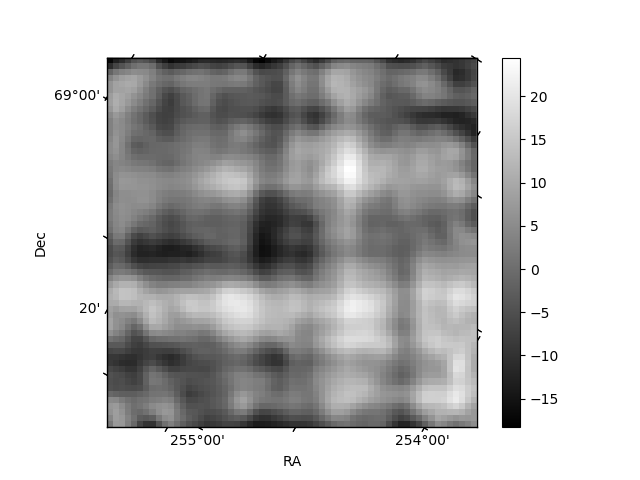
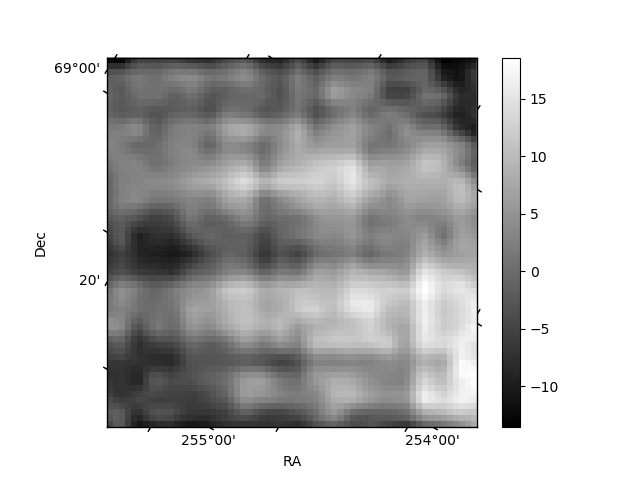
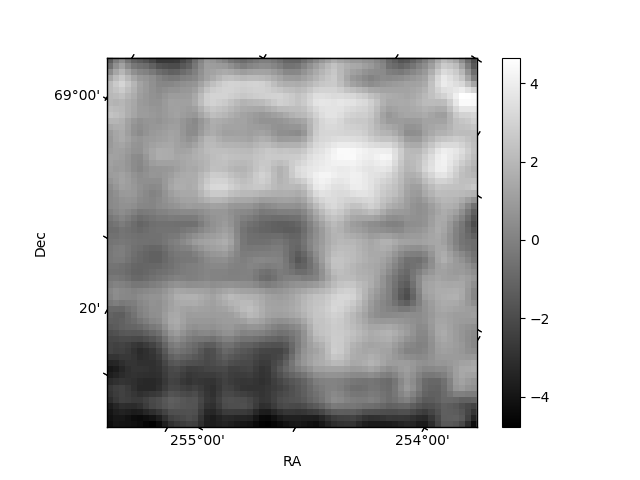
Histogram calculated using DETX and DETY for each event in the final _common_clean file
| Quadrant A | 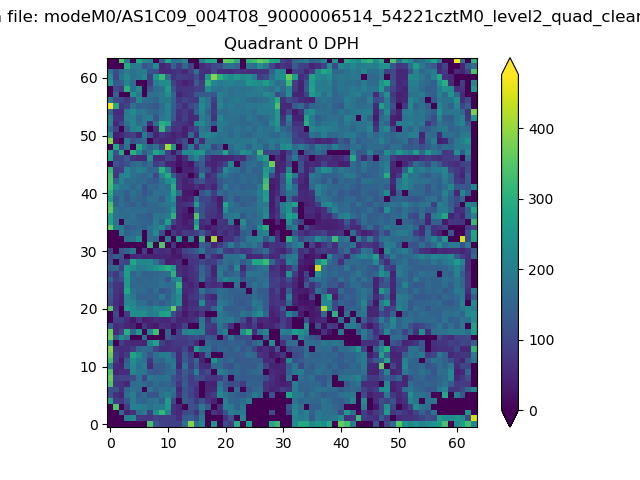 |
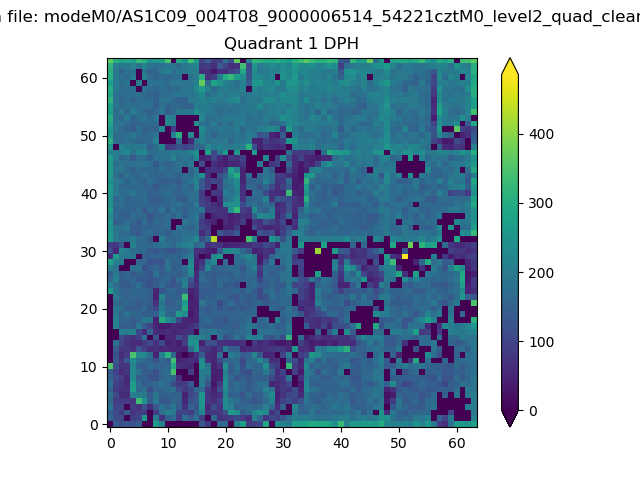 |
Quadrant B |
|---|---|---|---|
| Quadrant D | 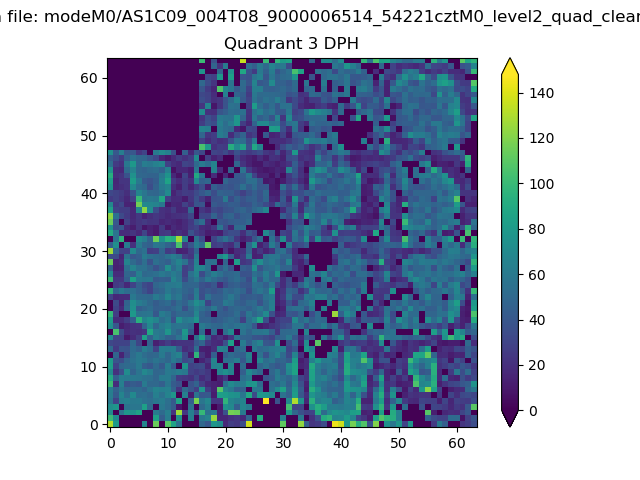 |
 |
Quadrant C |
| Plot type | Count rate plots | Images |
|---|---|---|
| Comparison with Poisson distribution Blue bars denote a histogram of data divided into 1 sec bins. Red curve is a Poisson curve with rate = median count rate of data. |
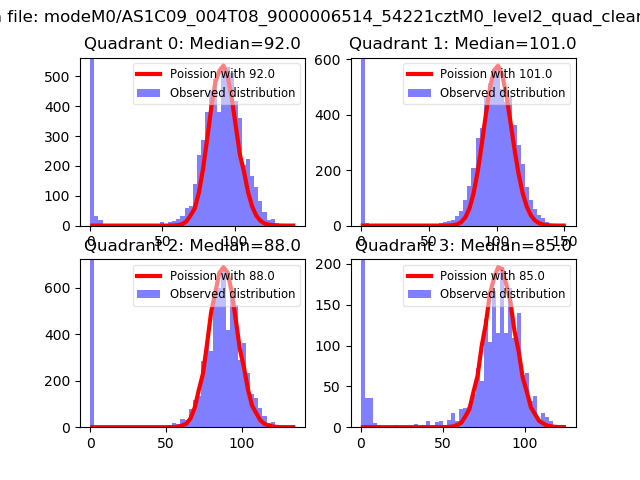 |
 |
| Quadrant-wise count rates Data is divided into 100 sec bins |
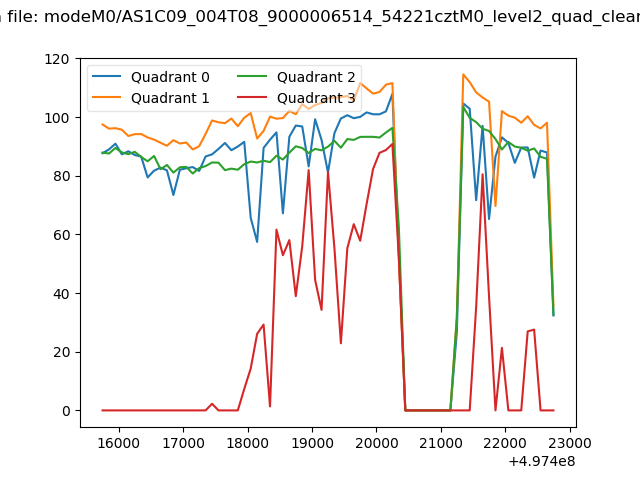 |
|
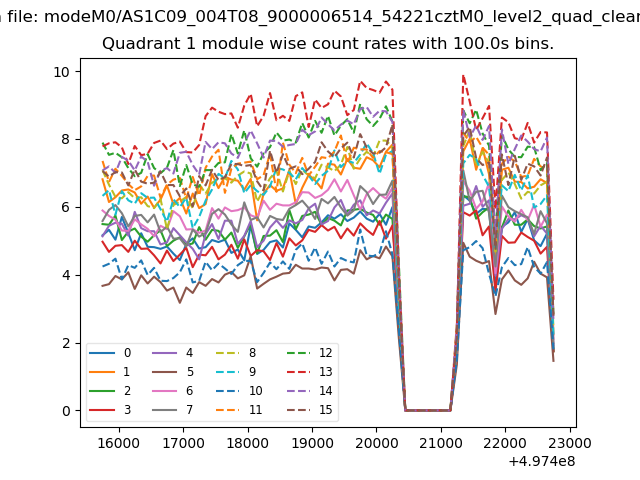
| Module-wise count rates for Quadrant A Data is divided into 100 sec bins |
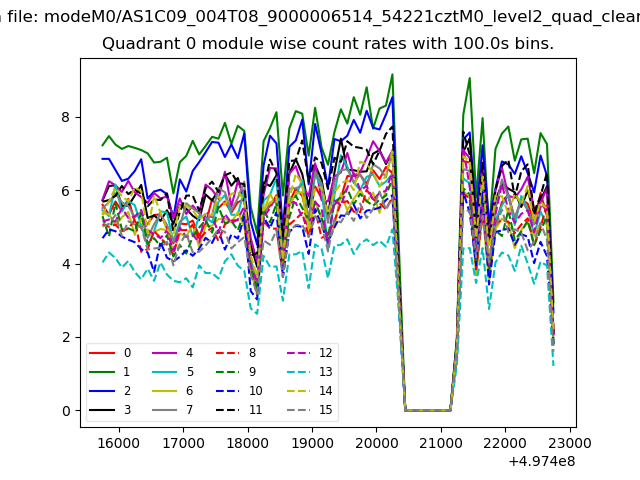 |
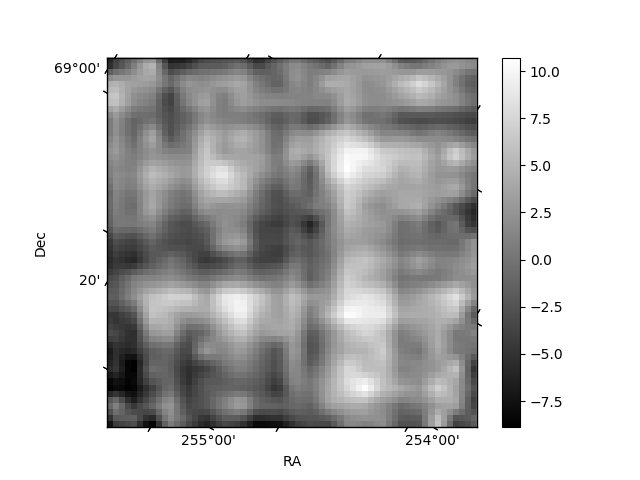 |
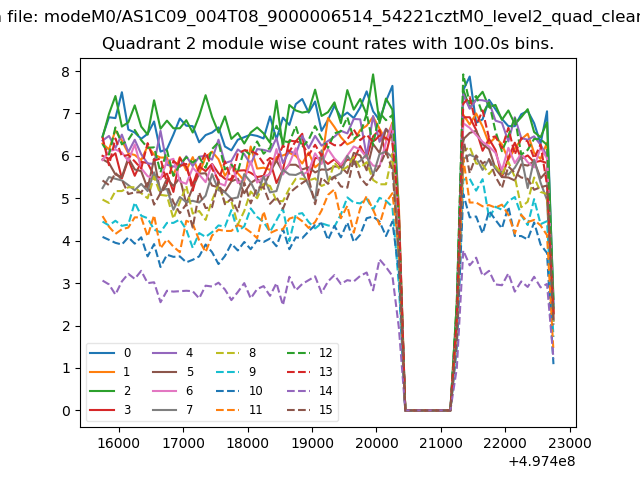
| Module-wise count rates for Quadrant B Data is divided into 100 sec bins |
 |
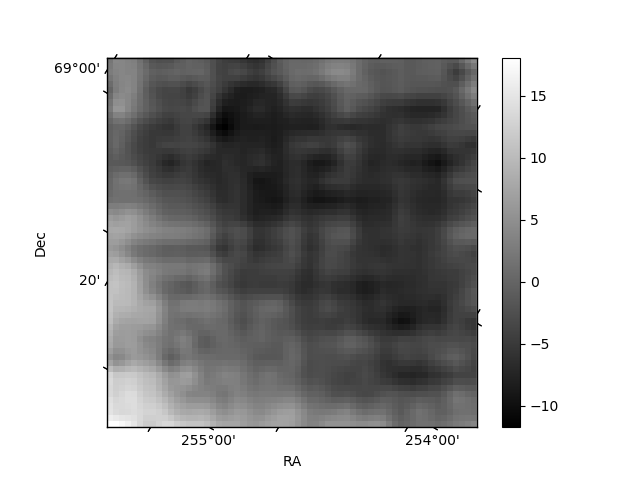 |
| Module-wise count rates for Quadrant C Data is divided into 100 sec bins |
 |
 |
| Module-wise count rates for Quadrant D Data is divided into 100 sec bins |
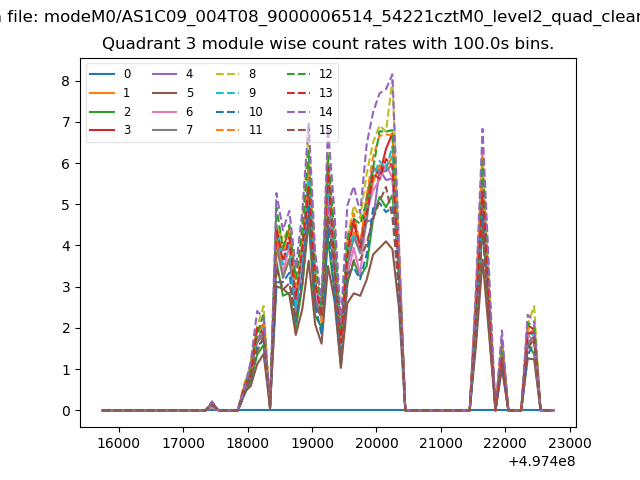 |
 |
| Parameter | Plot |
|---|---|
| CZT HV Monitor | 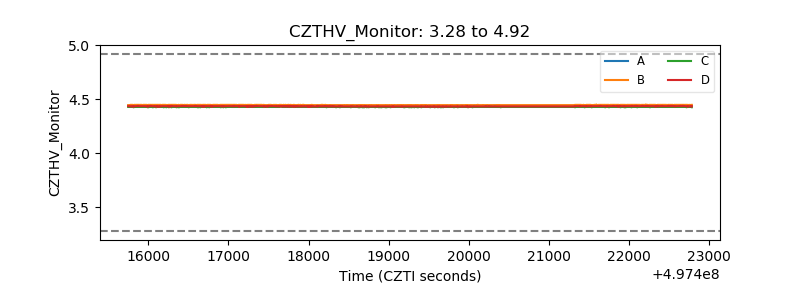 |
| D_VDD | 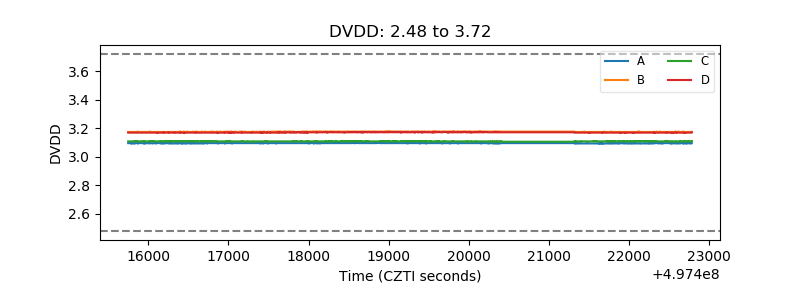 |
| Temperature 1 | 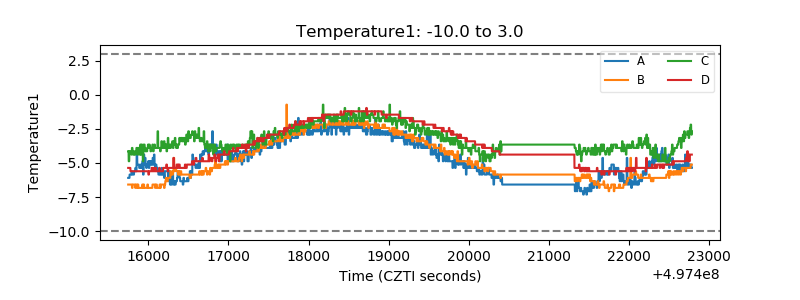 |
| Veto HV Monitor | 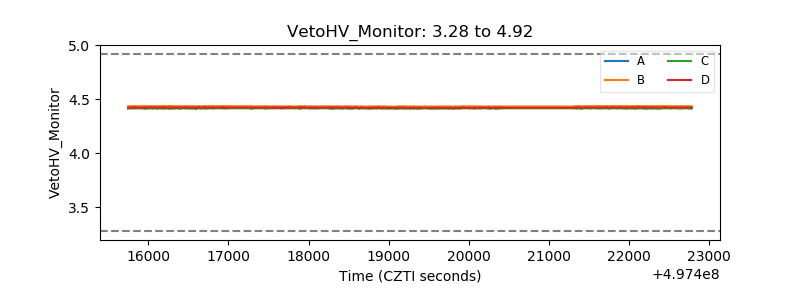 |
| Veto LLD | 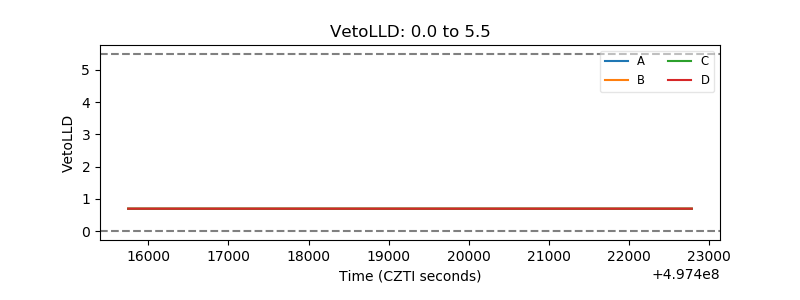 |
| Alpha Counter | 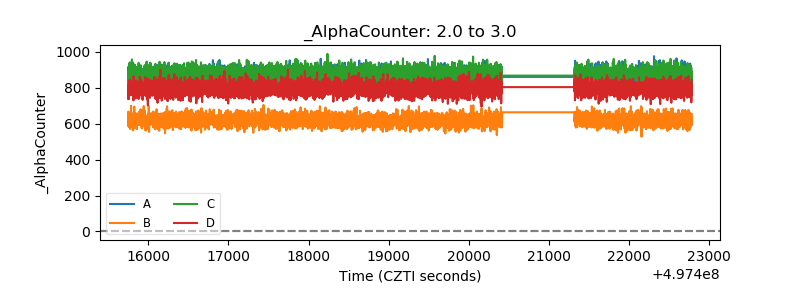 |
| _CPM_Rate | 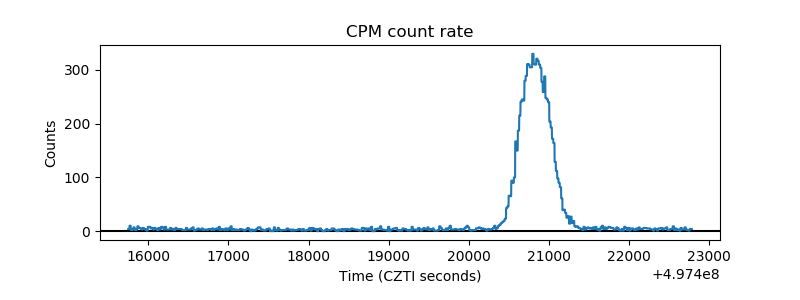 |
| CZT Counter | 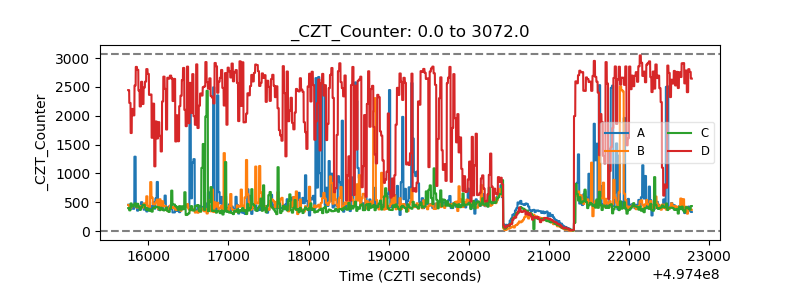 |
| +2.5 Volts monitor | 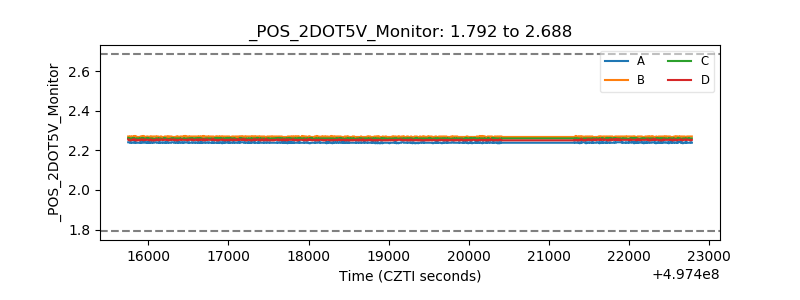 |
| +5 Volts monitor | 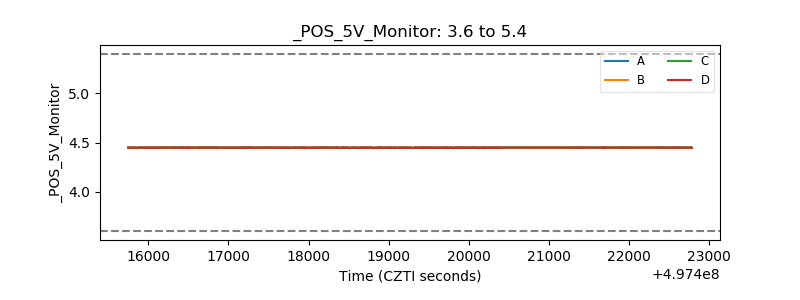 |
| _ROLL_ROT | 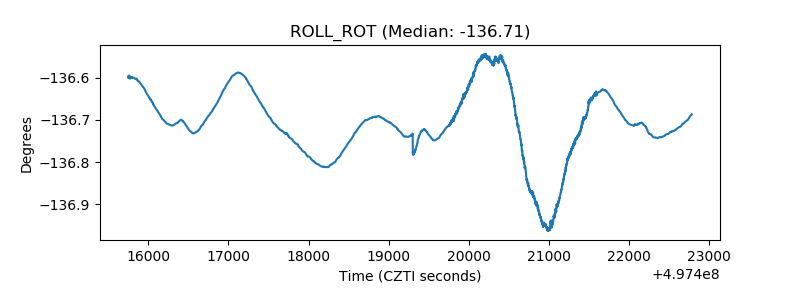 |
| _Roll_DEC | 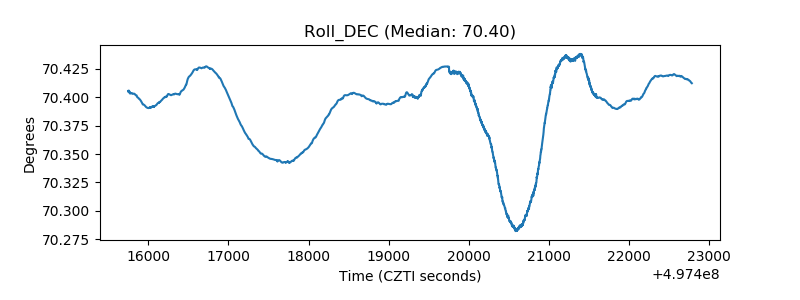 |
| _Roll_RA | 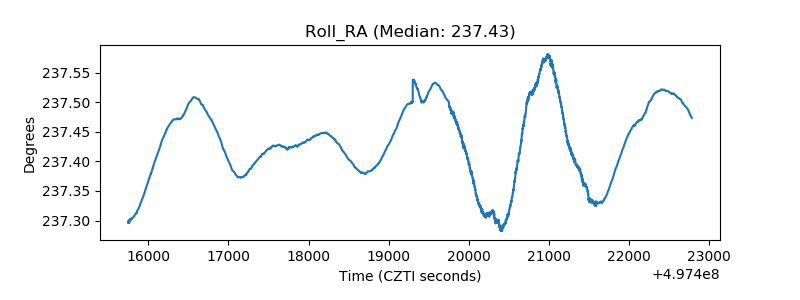 |
| Veto Counter | 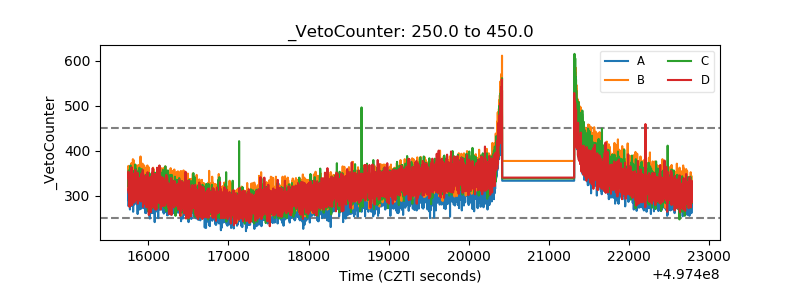 |