| Param | Original file | Final file |
|---|---|---|
| Filename | modeM0/AS1C09_004T08_9000006514_54223cztM0_level2.fits | modeM0/AS1C09_004T08_9000006514_54223cztM0_level2_quad_clean.evt |
| Size (bytes) | 631,543,680 | 72,046,080 |
| Size | 602.3 MB | 68.7 MB |
| Events in quadrant A | 3,555,310 | 548,260 |
| Events in quadrant B | 3,131,443 | 609,983 |
| Events in quadrant C | 2,875,320 | 527,606 |
| Events in quadrant D | 13,354,076 | 81,342 |
| Mode M0 | |||
|---|---|---|---|
| Quadrant | BADHDUFLAG | Total packets | Discarded packets |
| A | 0 | 14699 | 1 |
| B | 0 | 13564 | 1 |
| C | 0 | 13045 | 1 |
| D | 0 | 43746 | 7 |
| Mode M9 | |||
|---|---|---|---|
| Quadrant | BADHDUFLAG | Total packets | Discarded packets |
| A | 0 | 10 | 0 |
| B | 0 | 10 | 0 |
| C | 0 | 10 | 0 |
| D | 0 | 10 | 0 |
| Mode SS | |||
|---|---|---|---|
| Quadrant | BADHDUFLAG | Total packets | Discarded packets |
| A | 0 | 122 | 0 |
| B | 0 | 122 | 0 |
| C | 0 | 122 | 0 |
| D | 0 | 122 | 0 |
| Quadrant | Total seconds | Saturated seconds | Saturation percentage |
|---|---|---|---|
| A | 5924 | 254 | 4.287643% |
| B | 5925 | 75 | 1.265823% |
| C | 5925 | 59 | 0.995781% |
| D | 5924 | 5001 | 84.419311% |
Noise dominated data is calculated using 1-second bins in cleaned event files. If a bin has >2000 counts, and if more than 50% of those come from <1% of pixels, then it is considered to be noise-dominated and hence unusable.
| Quadrant | # 1 sec bins | Bins with >0 counts | Bins with >2000 counts | High rate bins dominated by noise | Noise dominated (total time) | Noise dominated (detector-on time) | Marked lightcurve |
|---|---|---|---|---|---|---|---|
| A | 6969 | 5925 | 202 | 202 | 2.90% | 3.41% | 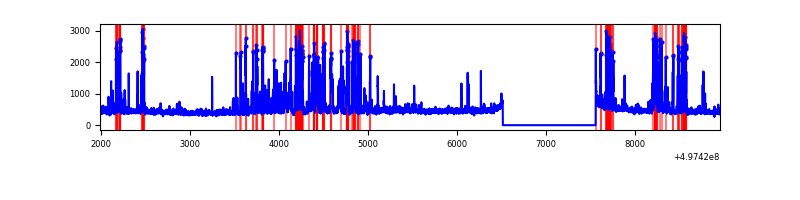 |
| B | 6970 | 5926 | 27 | 27 | 0.39% | 0.46% | 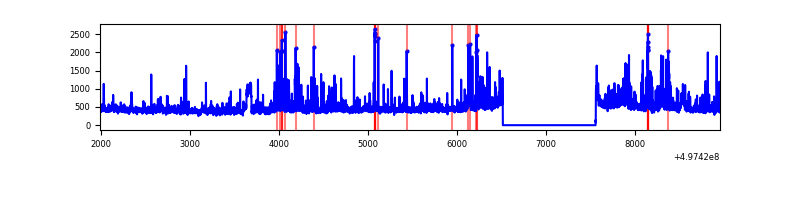 |
| C | 6970 | 5926 | 46 | 46 | 0.66% | 0.78% | 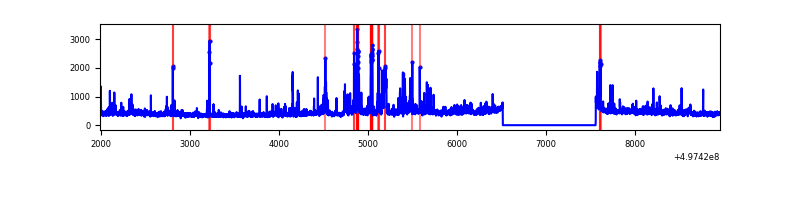 |
| D | 6969 | 5925 | 4372 | 4372 | 62.73% | 73.79% | 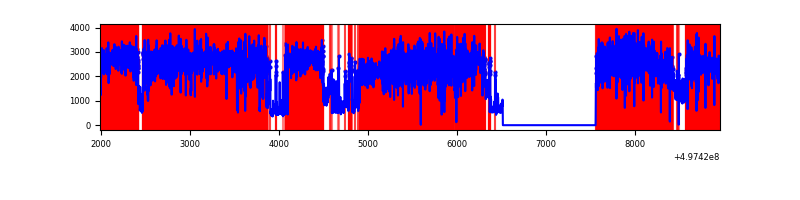 |
Top three noisy pixels from each quadrant. If the there are fewer than three noisy pixels in the level2.evt file, extra rows are filled as -1
| Pixel properties | Quadrant properties | ||||||
|---|---|---|---|---|---|---|---|
| Quadrant | DetID | PixID | Counts | Sigma | Mean | Median | Sigma |
| A | 12 | 17 | 576705 | 3799.79 | 612 | 600 | 151.6 |
| A | 15 | 174 | 253700 | 1669.36 | 612 | 600 | 151.6 |
| A | 3 | 14 | 96789 | 634.43 | 612 | 600 | 151.6 |
| B | 5 | 236 | 201427 | 1535.29 | 612 | 591 | 130.8 |
| B | 4 | 171 | 177699 | 1353.9 | 612 | 591 | 130.8 |
| B | 5 | 185 | 164961 | 1256.53 | 612 | 591 | 130.8 |
| C | 12 | 250 | 188141 | 1144.69 | 593 | 586 | 163.8 |
| C | 10 | 171 | 114003 | 692.21 | 593 | 586 | 163.8 |
| C | 15 | 189 | 79806 | 483.5 | 593 | 586 | 163.8 |
| D | 8 | 176 | 12248260 | 203681.01 | 207 | 197 | 60.1 |
| D | 8 | 160 | 110636 | 1836.56 | 207 | 197 | 60.1 |
| D | 15 | 170 | 31239 | 516.22 | 207 | 197 | 60.1 |
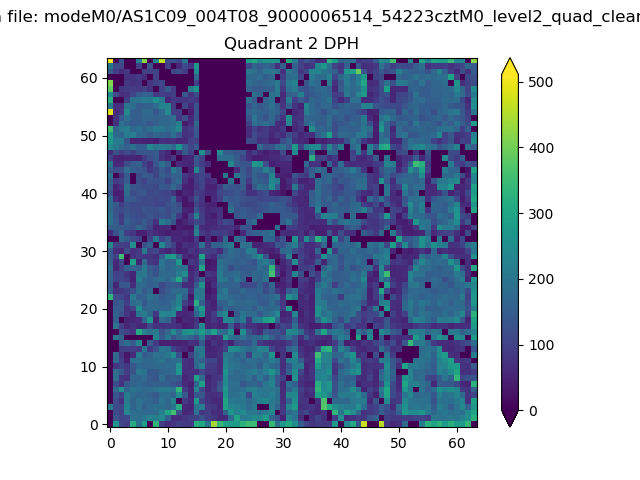
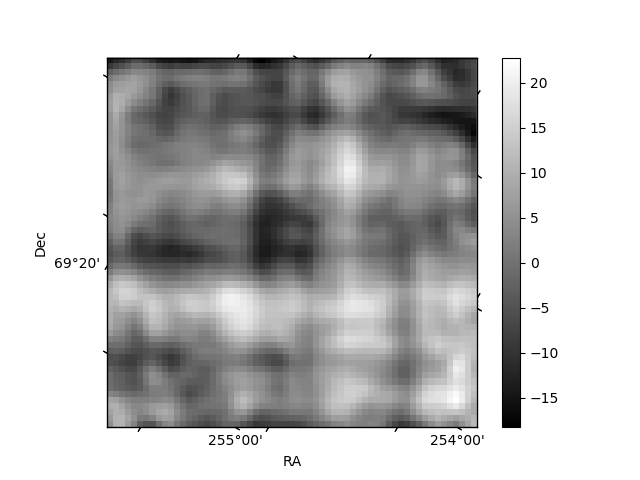
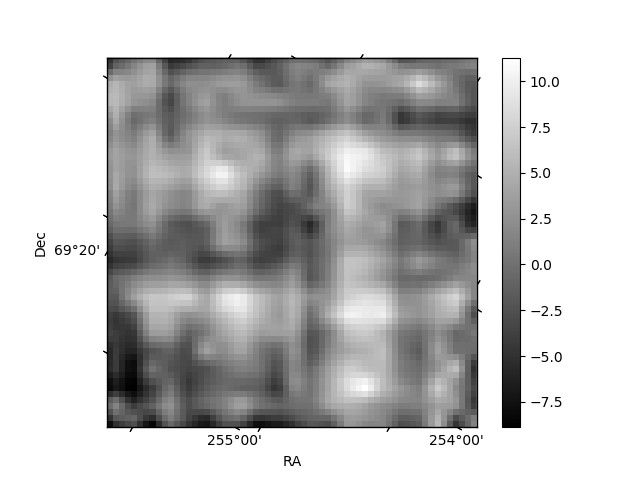
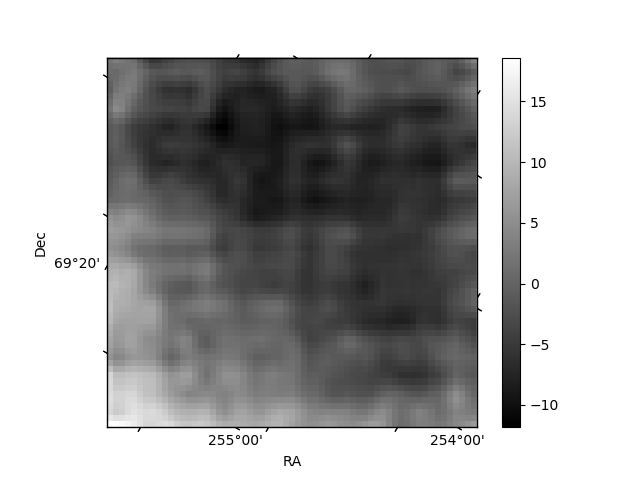
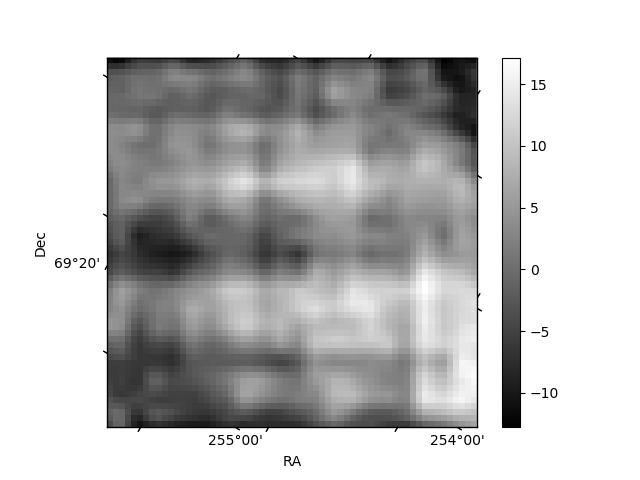
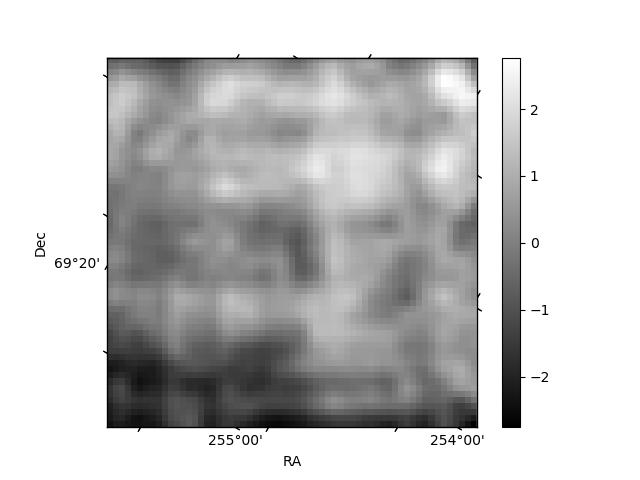
Histogram calculated using DETX and DETY for each event in the final _common_clean file
| Quadrant A | 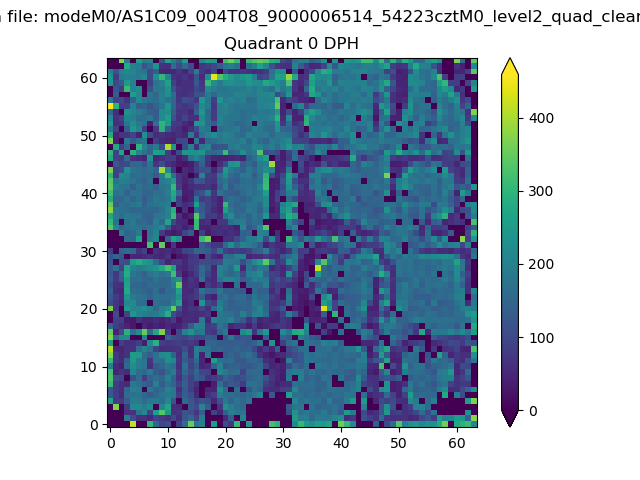 |
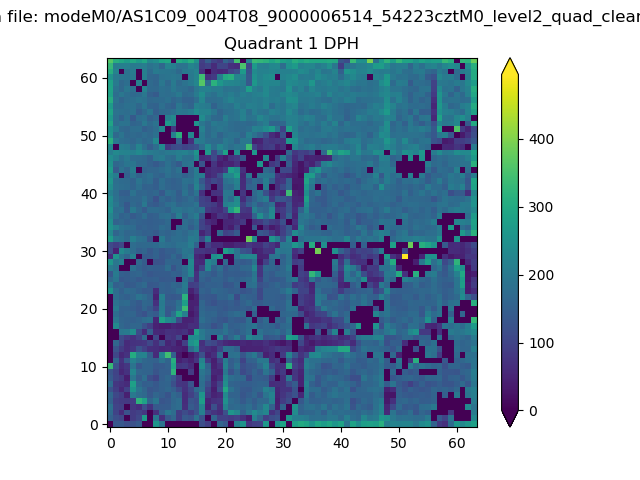 |
Quadrant B |
|---|---|---|---|
| Quadrant D | 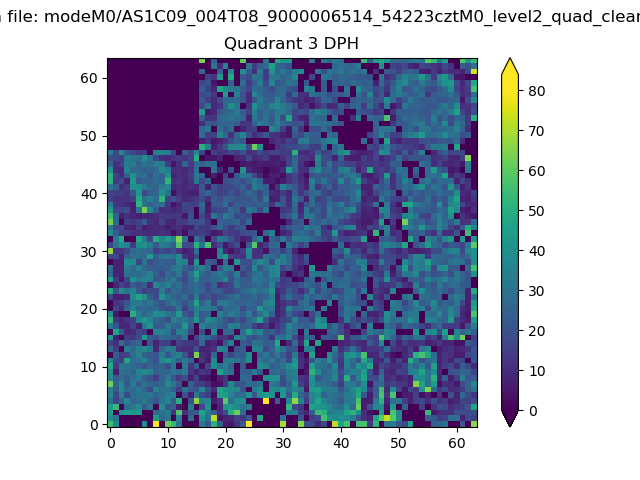 |
 |
Quadrant C |
| Plot type | Count rate plots | Images |
|---|---|---|
| Comparison with Poisson distribution Blue bars denote a histogram of data divided into 1 sec bins. Red curve is a Poisson curve with rate = median count rate of data. |
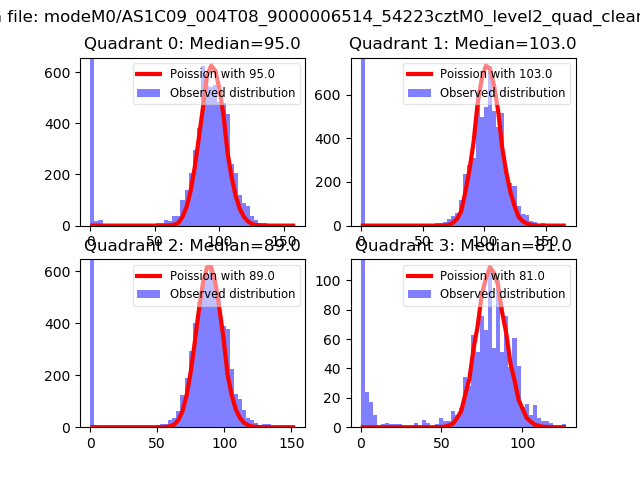 |
 |
| Quadrant-wise count rates Data is divided into 100 sec bins |
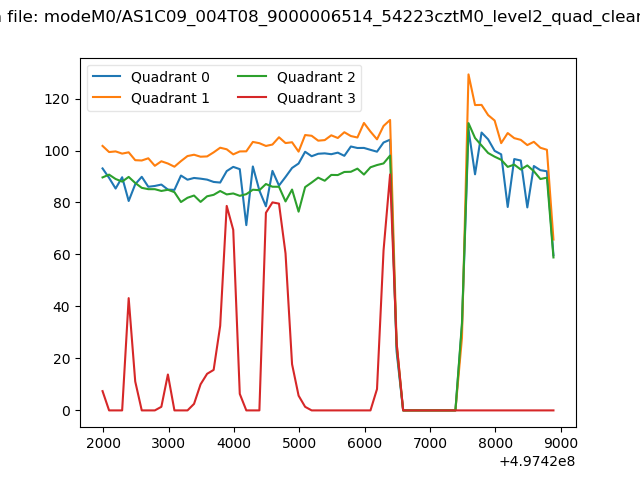 |
|
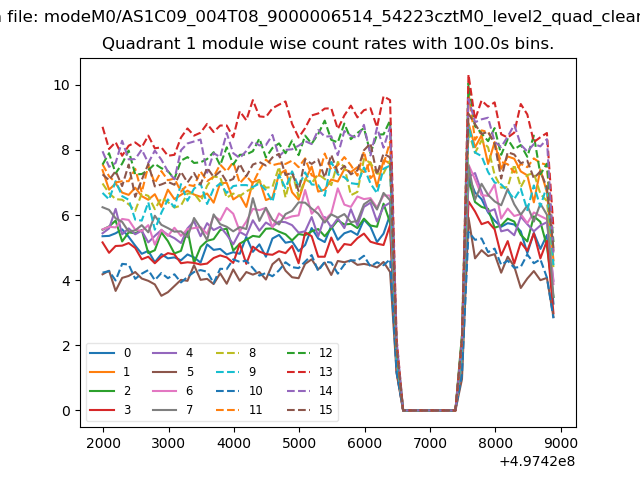
| Module-wise count rates for Quadrant A Data is divided into 100 sec bins |
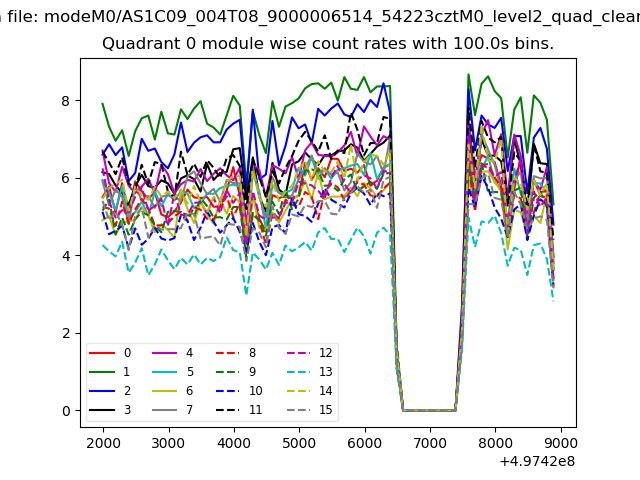 |
 |
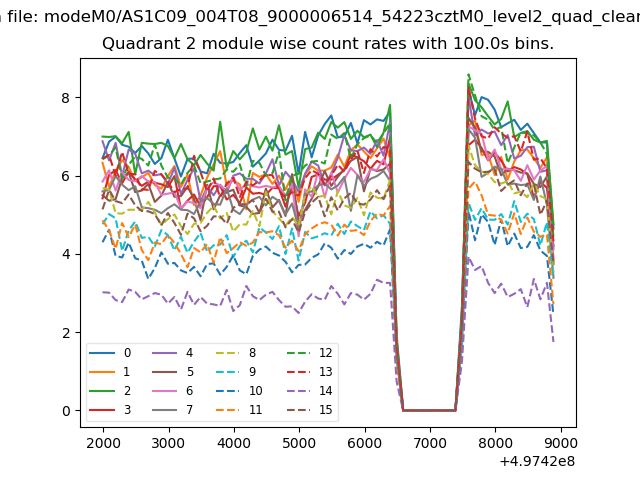
| Module-wise count rates for Quadrant B Data is divided into 100 sec bins |
 |
 |
| Module-wise count rates for Quadrant C Data is divided into 100 sec bins |
 |
 |
| Module-wise count rates for Quadrant D Data is divided into 100 sec bins |
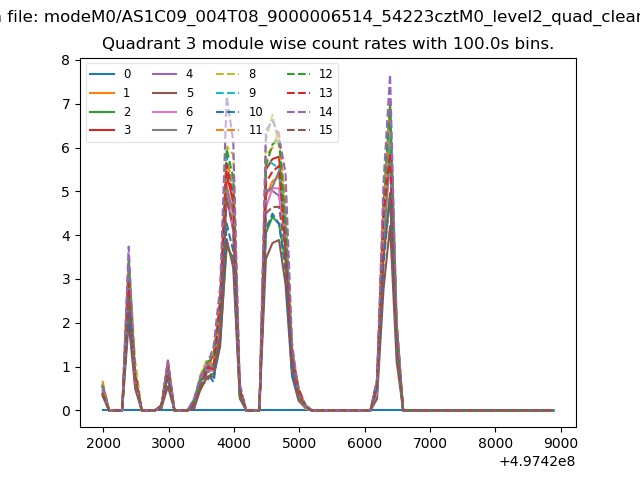 |
 |
| Parameter | Plot |
|---|---|
| CZT HV Monitor | 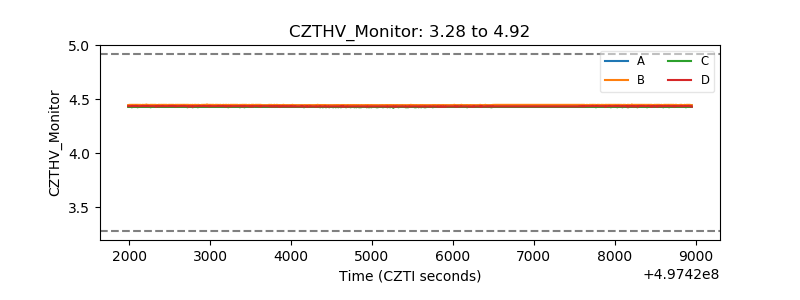 |
| D_VDD | 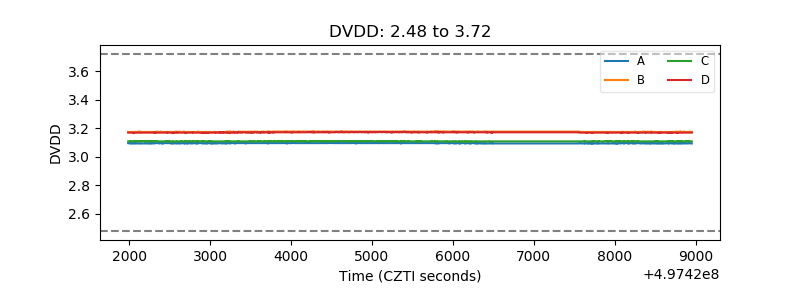 |
| Temperature 1 | 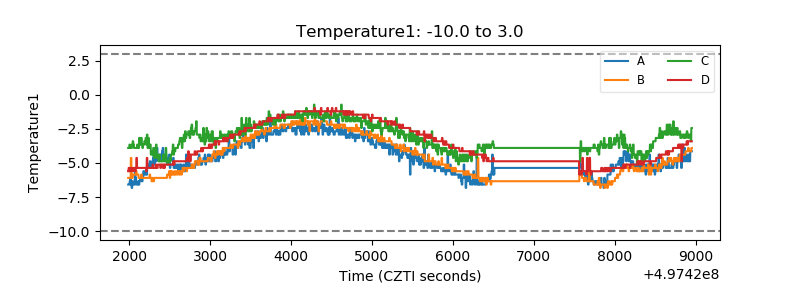 |
| Veto HV Monitor | 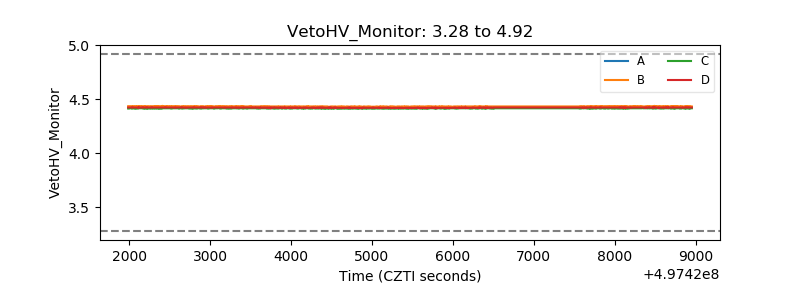 |
| Veto LLD | 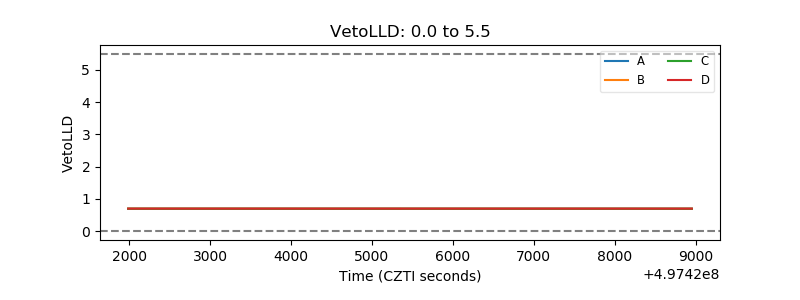 |
| Alpha Counter | 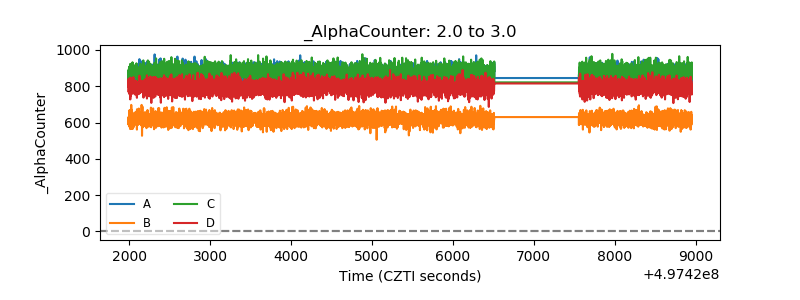 |
| _CPM_Rate | 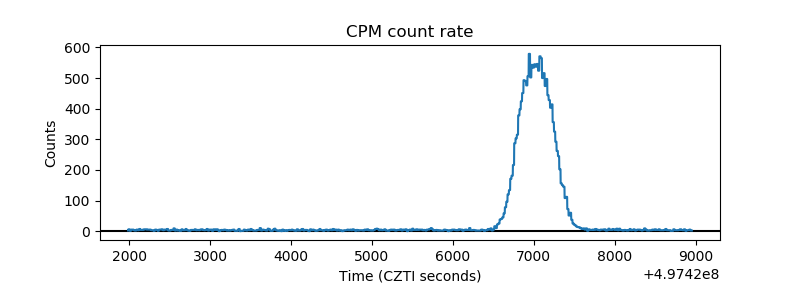 |
| CZT Counter | 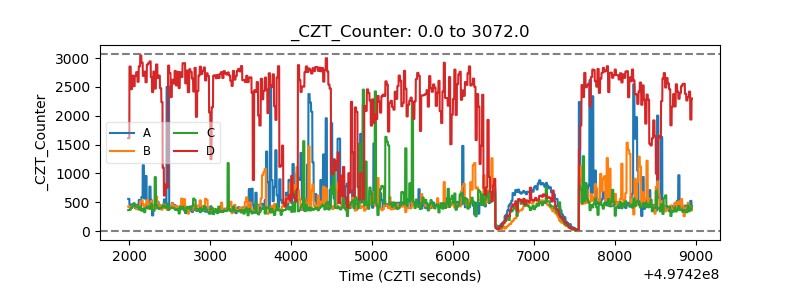 |
| +2.5 Volts monitor | 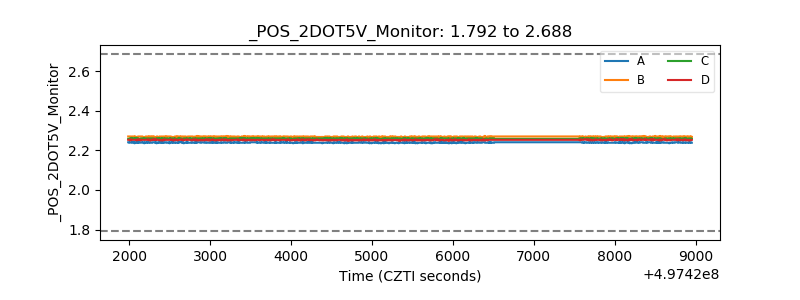 |
| +5 Volts monitor |  |
| _ROLL_ROT | 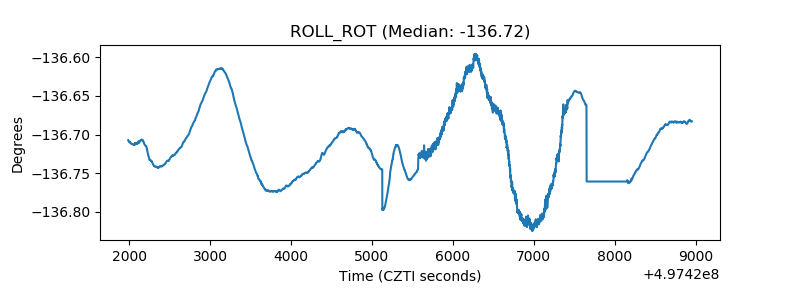 |
| _Roll_DEC | 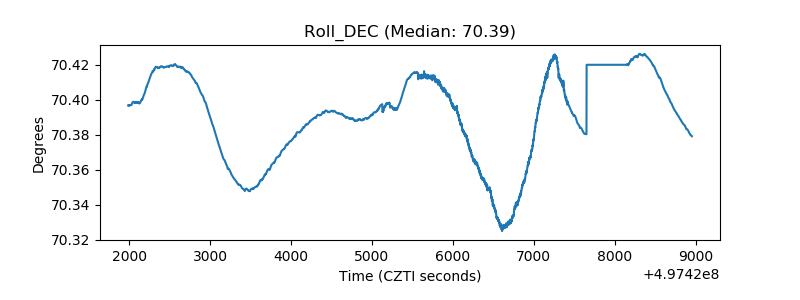 |
| _Roll_RA | 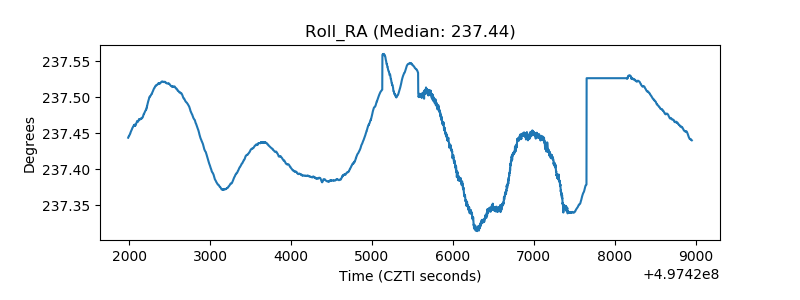 |
| Veto Counter | 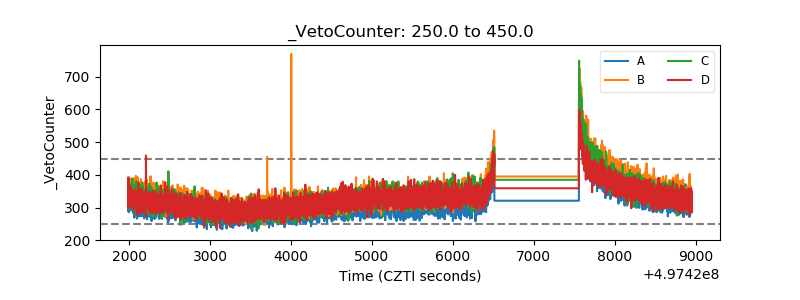 |