| Param | Original file | Final file |
|---|---|---|
| Filename | modeM0/AS1C09_004T08_9000006514_54225cztM0_level2.fits | modeM0/AS1C09_004T08_9000006514_54225cztM0_level2_quad_clean.evt |
| Size (bytes) | 648,313,920 | 75,424,320 |
| Size | 618.3 MB | 71.9 MB |
| Events in quadrant A | 5,166,378 | 535,366 |
| Events in quadrant B | 3,990,406 | 638,309 |
| Events in quadrant C | 3,024,955 | 559,408 |
| Events in quadrant D | 11,349,586 | 131,653 |
| Mode M0 | |||
|---|---|---|---|
| Quadrant | BADHDUFLAG | Total packets | Discarded packets |
| A | 0 | 19434 | 1 |
| B | 0 | 15968 | 1 |
| C | 0 | 13450 | 1 |
| D | 0 | 37895 | 1 |
| Mode M9 | |||
|---|---|---|---|
| Quadrant | BADHDUFLAG | Total packets | Discarded packets |
| A | 0 | 11 | 0 |
| B | 0 | 11 | 0 |
| C | 0 | 11 | 0 |
| D | 0 | 11 | 0 |
| Mode SS | |||
|---|---|---|---|
| Quadrant | BADHDUFLAG | Total packets | Discarded packets |
| A | 0 | 122 | 0 |
| B | 0 | 122 | 0 |
| C | 0 | 122 | 0 |
| D | 0 | 122 | 0 |
| Quadrant | Total seconds | Saturated seconds | Saturation percentage |
|---|---|---|---|
| A | 5999 | 913 | 15.219203% |
| B | 5999 | 257 | 4.284047% |
| C | 5999 | 104 | 1.733622% |
| D | 5999 | 4665 | 77.762960% |
Noise dominated data is calculated using 1-second bins in cleaned event files. If a bin has >2000 counts, and if more than 50% of those come from <1% of pixels, then it is considered to be noise-dominated and hence unusable.
| Quadrant | # 1 sec bins | Bins with >0 counts | Bins with >2000 counts | High rate bins dominated by noise | Noise dominated (total time) | Noise dominated (detector-on time) | Marked lightcurve |
|---|---|---|---|---|---|---|---|
| A | 7114 | 6000 | 740 | 740 | 10.40% | 12.33% | 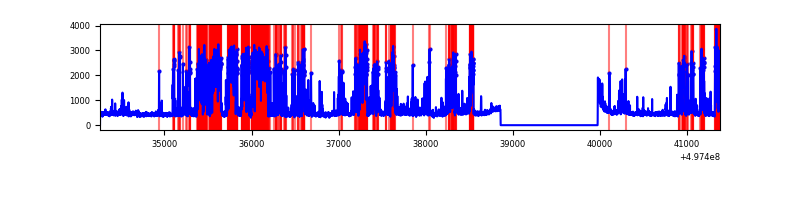 |
| B | 7114 | 6000 | 102 | 102 | 1.43% | 1.70% | 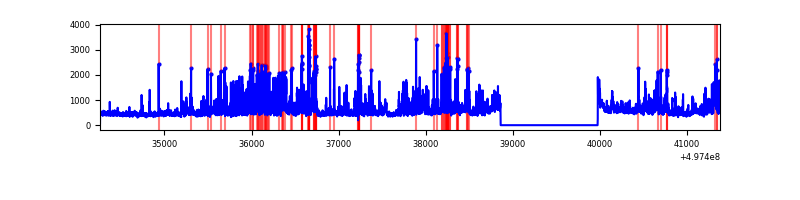 |
| C | 7114 | 6000 | 54 | 54 | 0.76% | 0.90% | 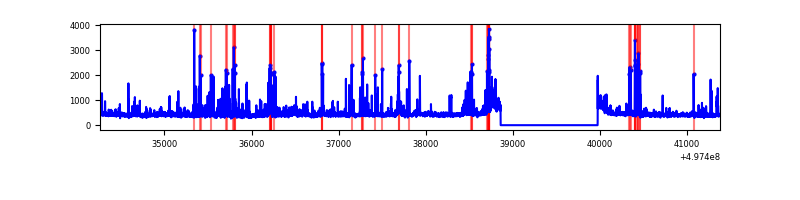 |
| D | 7113 | 5998 | 2930 | 2930 | 41.19% | 48.85% | 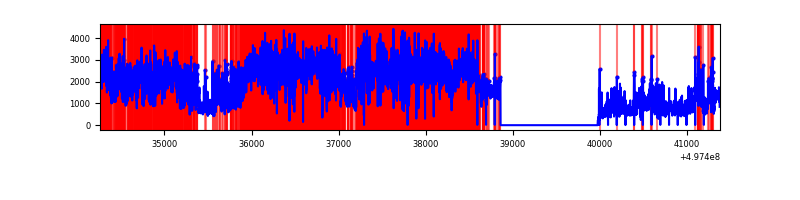 |
Top three noisy pixels from each quadrant. If the there are fewer than three noisy pixels in the level2.evt file, extra rows are filled as -1
| Pixel properties | Quadrant properties | ||||||
|---|---|---|---|---|---|---|---|
| Quadrant | DetID | PixID | Counts | Sigma | Mean | Median | Sigma |
| A | 12 | 17 | 1726674 | 11366.02 | 609 | 594 | 151.9 |
| A | 7 | 29 | 279166 | 1834.36 | 609 | 594 | 151.9 |
| A | 12 | 194 | 216693 | 1422.98 | 609 | 594 | 151.9 |
| B | 4 | 171 | 476524 | 3510.9 | 634 | 612 | 135.6 |
| B | 5 | 236 | 393711 | 2899.98 | 634 | 612 | 135.6 |
| B | 8 | 234 | 147711 | 1085.18 | 634 | 612 | 135.6 |
| C | 13 | 3 | 274806 | 1610.1 | 616 | 609 | 170.3 |
| C | 14 | 254 | 51619 | 299.53 | 616 | 609 | 170.3 |
| C | 15 | 189 | 45658 | 264.53 | 616 | 609 | 170.3 |
| D | 8 | 176 | 9657491 | 142686.16 | 233 | 222 | 67.7 |
| D | 2 | 172 | 341605 | 5043.93 | 233 | 222 | 67.7 |
| D | 12 | 2 | 132090 | 1948.35 | 233 | 222 | 67.7 |
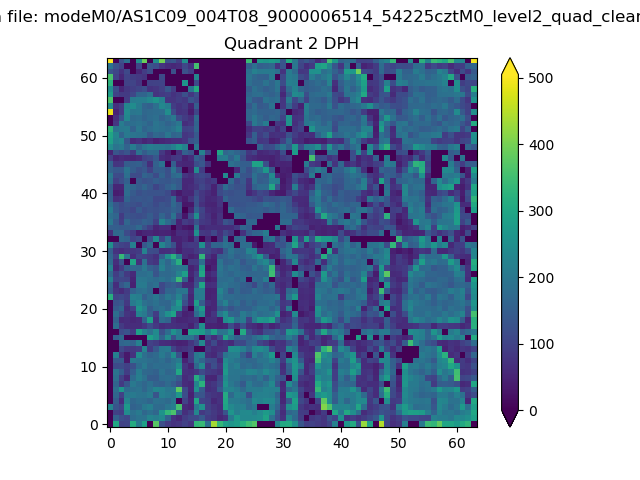
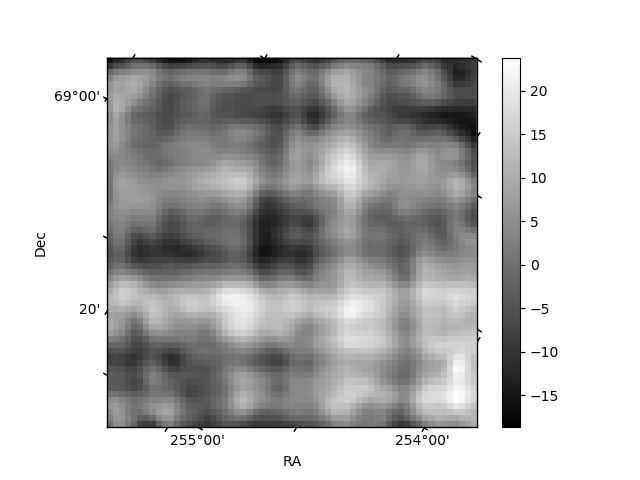
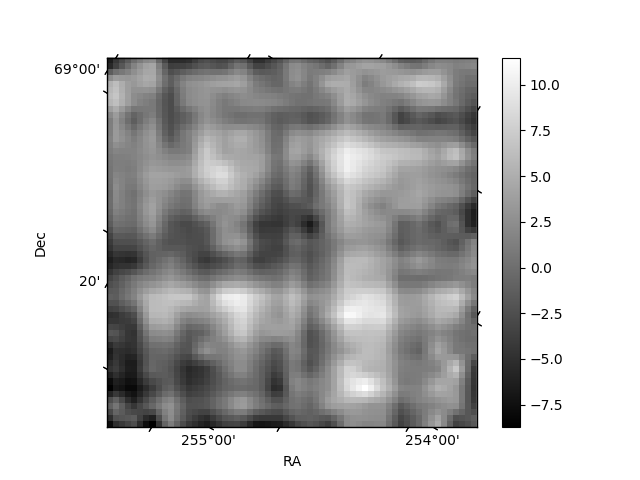
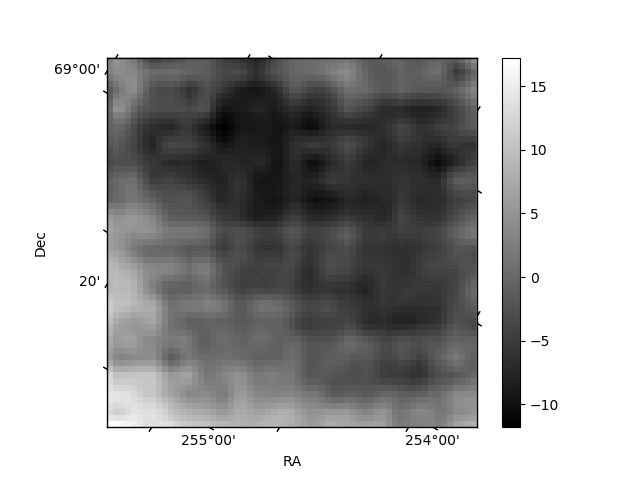
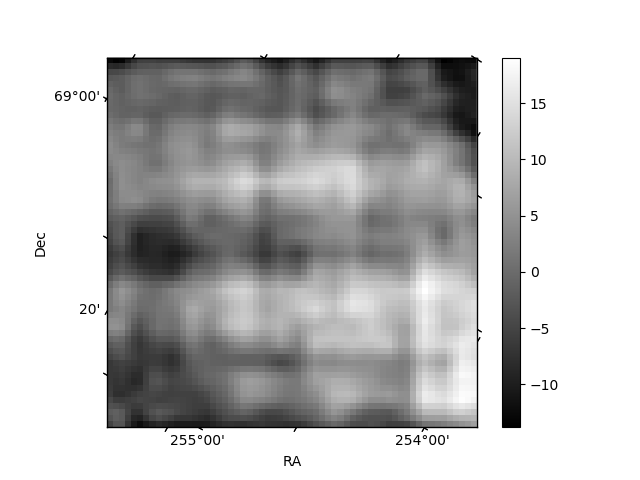
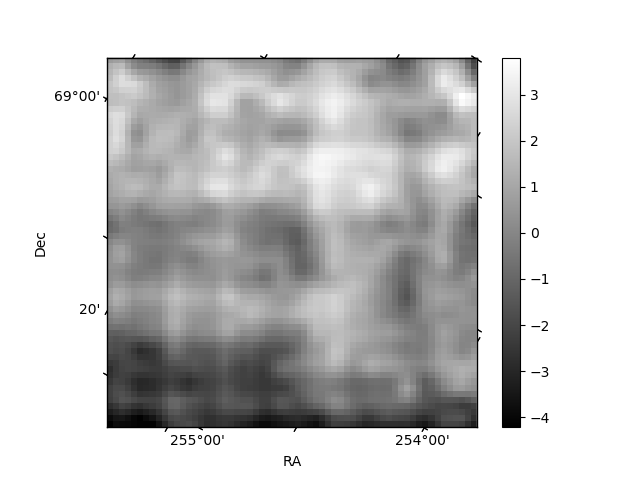
Histogram calculated using DETX and DETY for each event in the final _common_clean file
| Quadrant A | 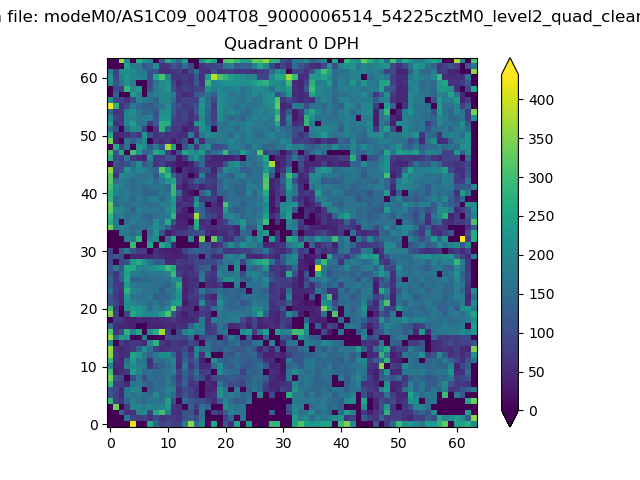 |
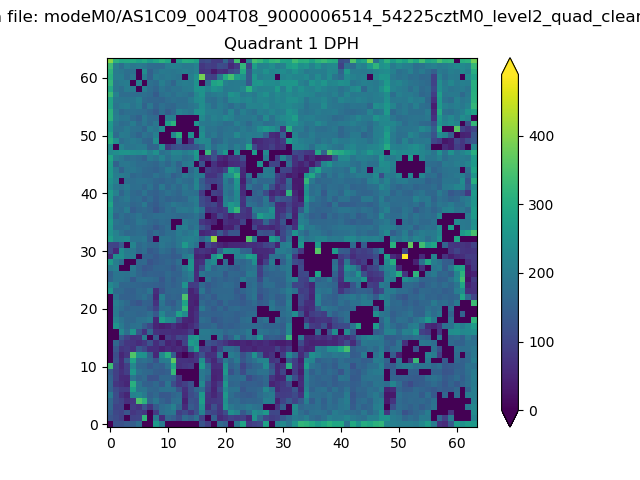 |
Quadrant B |
|---|---|---|---|
| Quadrant D | 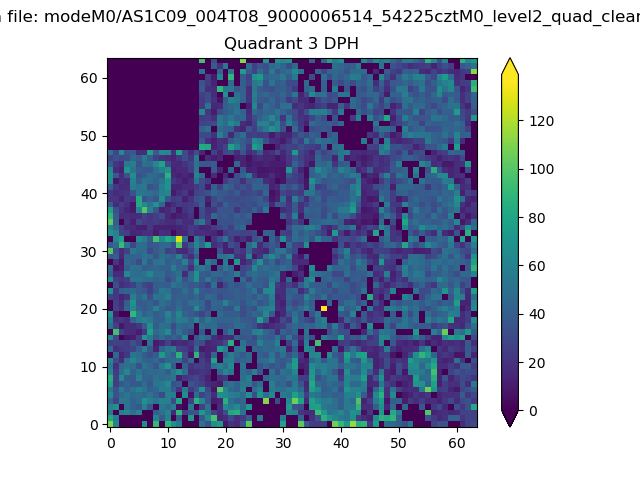 |
 |
Quadrant C |
| Plot type | Count rate plots | Images |
|---|---|---|
| Comparison with Poisson distribution Blue bars denote a histogram of data divided into 1 sec bins. Red curve is a Poisson curve with rate = median count rate of data. |
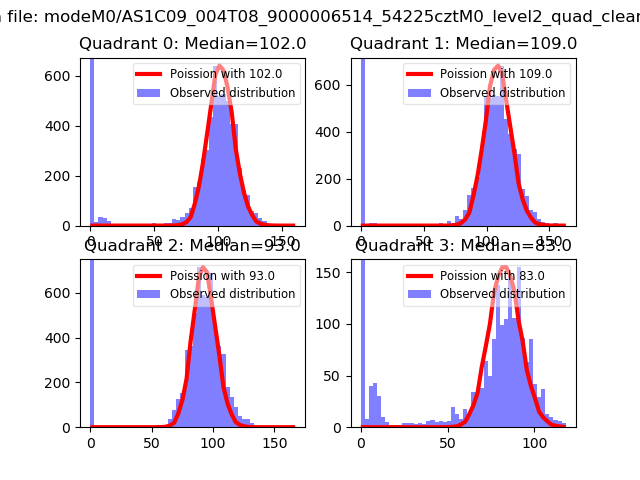 |
 |
| Quadrant-wise count rates Data is divided into 100 sec bins |
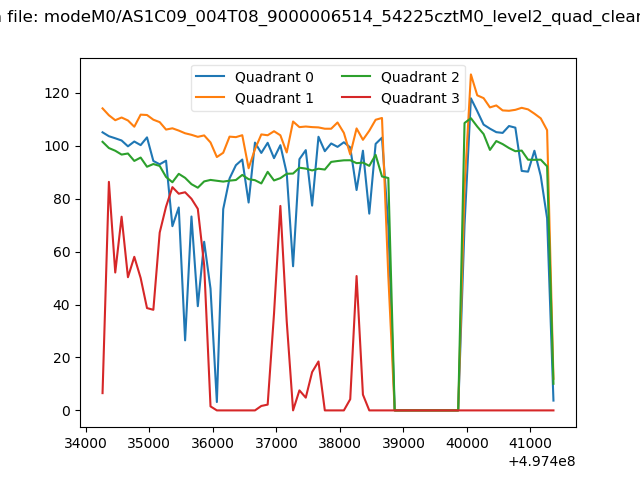 |
|
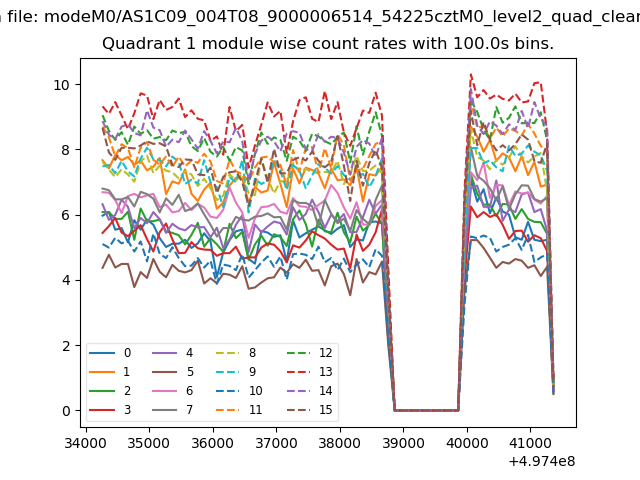
| Module-wise count rates for Quadrant A Data is divided into 100 sec bins |
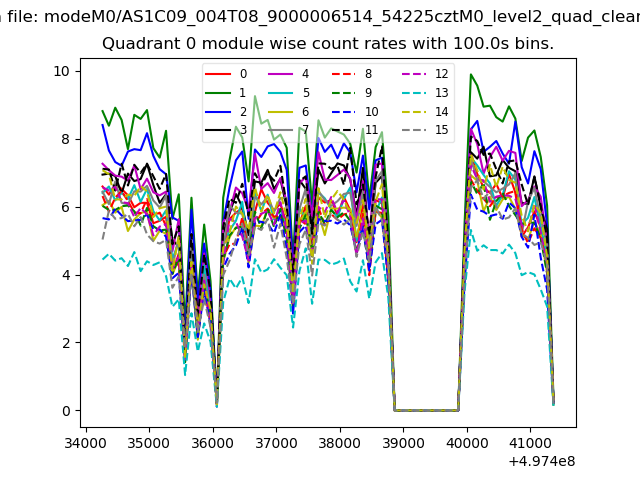 |
 |
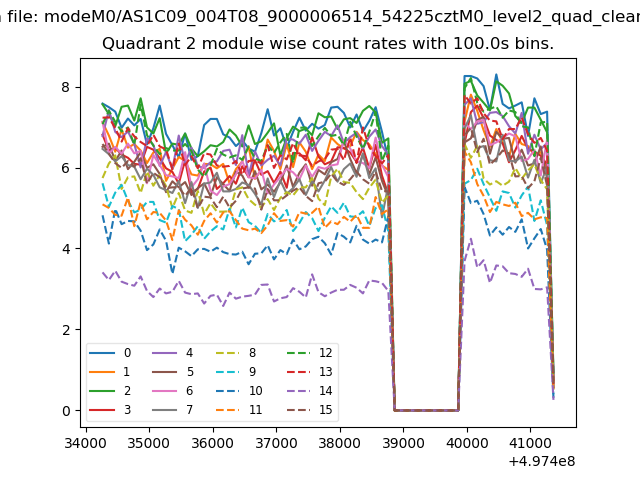
| Module-wise count rates for Quadrant B Data is divided into 100 sec bins |
 |
 |
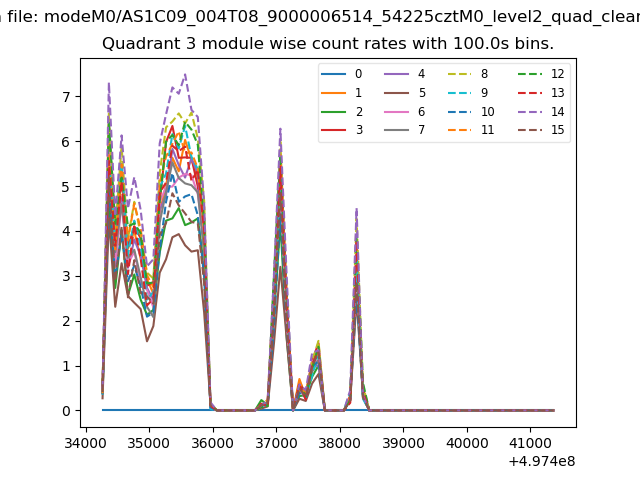
| Module-wise count rates for Quadrant C Data is divided into 100 sec bins |
 |
 |
| Module-wise count rates for Quadrant D Data is divided into 100 sec bins |
 |
 |
| Parameter | Plot |
|---|---|
| CZT HV Monitor | 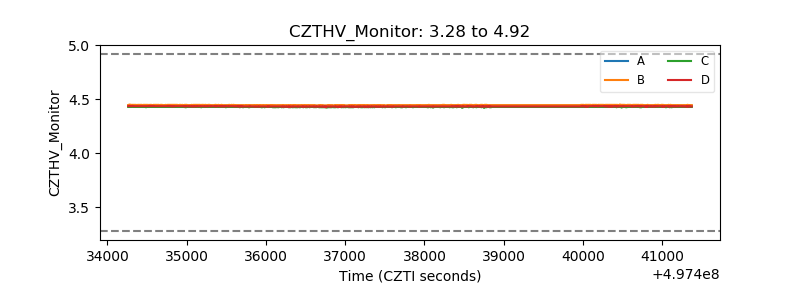 |
| D_VDD | 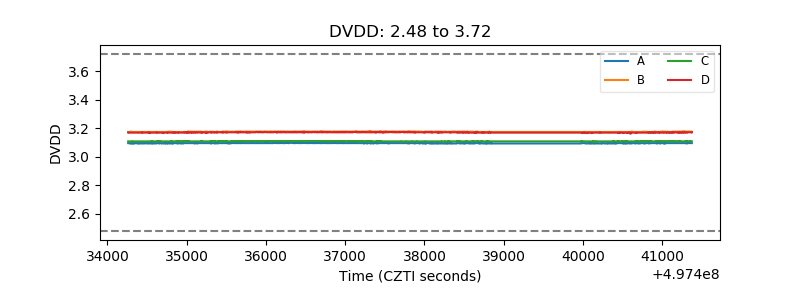 |
| Temperature 1 | 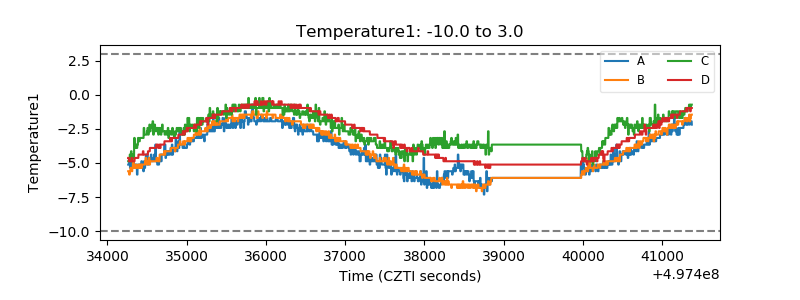 |
| Veto HV Monitor | 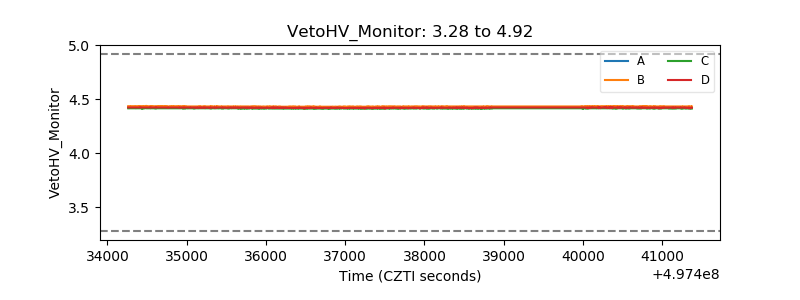 |
| Veto LLD | 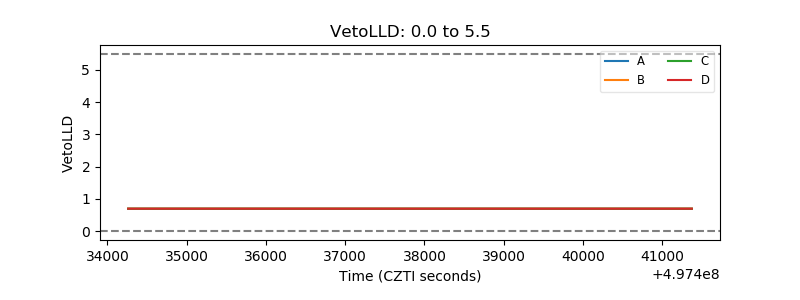 |
| Alpha Counter | 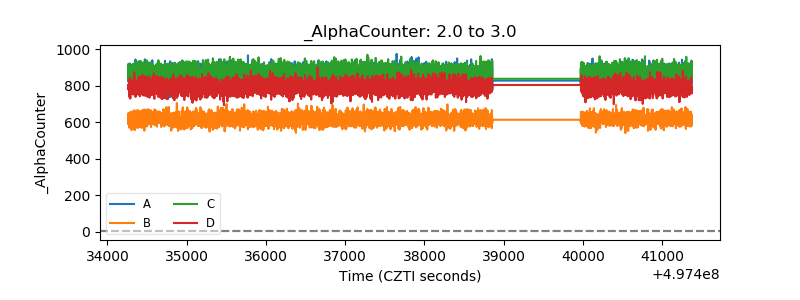 |
| _CPM_Rate | 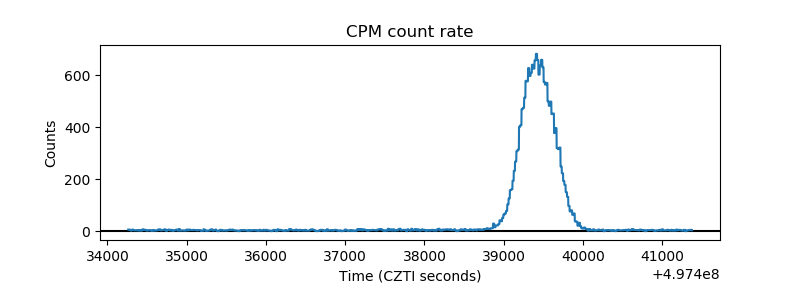 |
| CZT Counter | 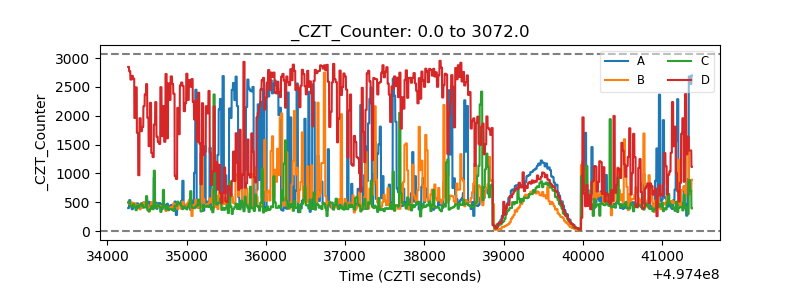 |
| +2.5 Volts monitor | 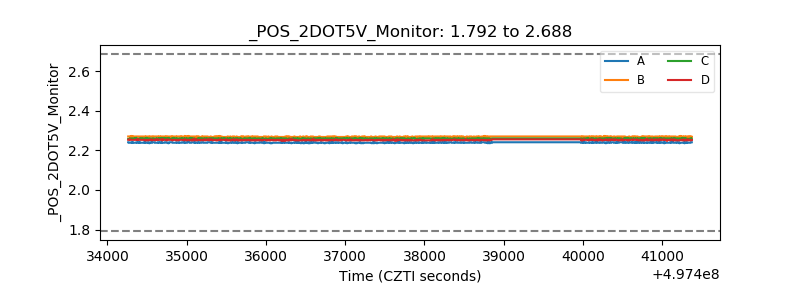 |
| +5 Volts monitor | 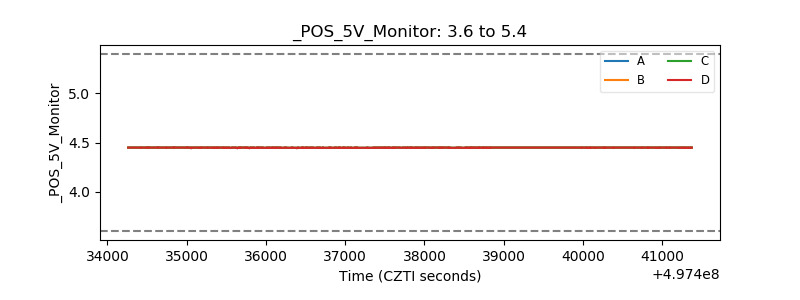 |
| _ROLL_ROT | 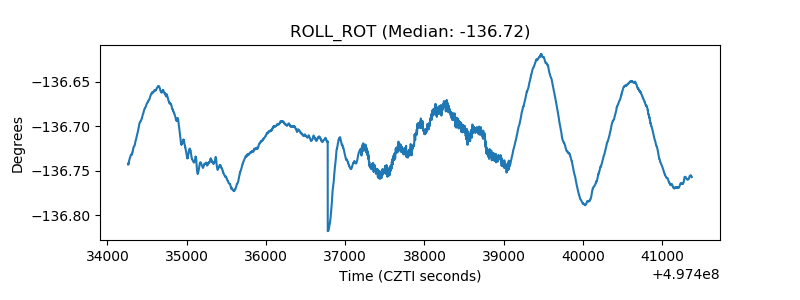 |
| _Roll_DEC | 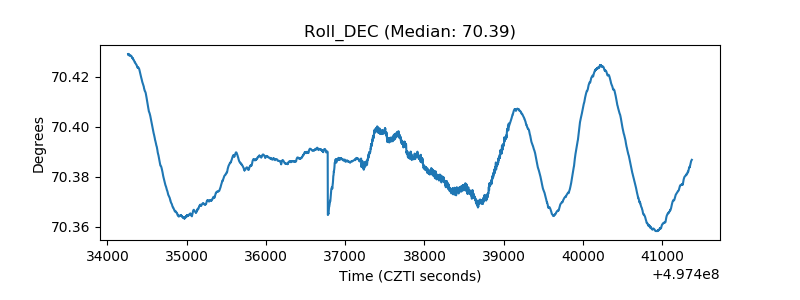 |
| _Roll_RA | 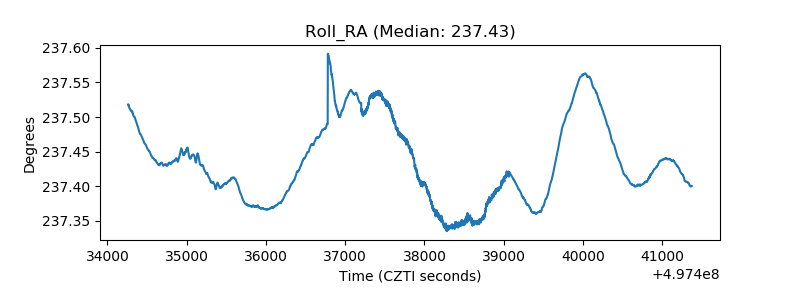 |
| Veto Counter | 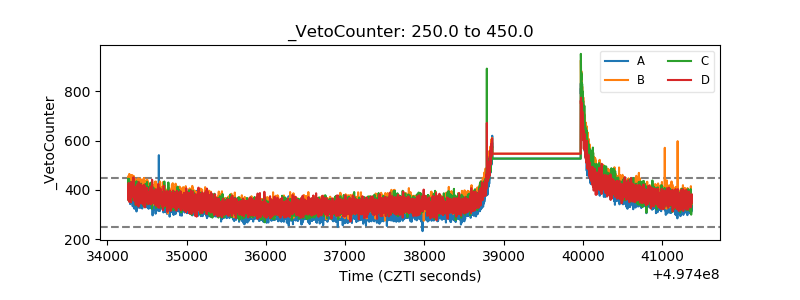 |