| Param | Original file | Final file |
|---|---|---|
| Filename | modeM0/AS1C09_004T08_9000006514_54226cztM0_level2.fits | modeM0/AS1C09_004T08_9000006514_54226cztM0_level2_quad_clean.evt |
| Size (bytes) | 697,982,400 | 71,772,480 |
| Size | 665.6 MB | 68.4 MB |
| Events in quadrant A | 6,412,786 | 490,717 |
| Events in quadrant B | 4,281,435 | 649,508 |
| Events in quadrant C | 3,064,227 | 568,469 |
| Events in quadrant D | 11,601,797 | 37,494 |
| Mode M0 | |||
|---|---|---|---|
| Quadrant | BADHDUFLAG | Total packets | Discarded packets |
| A | 0 | 23152 | 1 |
| B | 0 | 16936 | 1 |
| C | 0 | 13680 | 1 |
| D | 0 | 38698 | 2 |
| Mode M9 | |||
|---|---|---|---|
| Quadrant | BADHDUFLAG | Total packets | Discarded packets |
| A | 0 | 11 | 0 |
| B | 0 | 11 | 0 |
| C | 0 | 11 | 0 |
| D | 0 | 11 | 0 |
| Mode SS | |||
|---|---|---|---|
| Quadrant | BADHDUFLAG | Total packets | Discarded packets |
| A | 0 | 124 | 0 |
| B | 0 | 124 | 0 |
| C | 0 | 124 | 0 |
| D | 0 | 124 | 0 |
| Quadrant | Total seconds | Saturated seconds | Saturation percentage |
|---|---|---|---|
| A | 6115 | 1427 | 23.336059% |
| B | 6116 | 275 | 4.496403% |
| C | 6116 | 98 | 1.602354% |
| D | 6115 | 5731 | 93.720360% |
Noise dominated data is calculated using 1-second bins in cleaned event files. If a bin has >2000 counts, and if more than 50% of those come from <1% of pixels, then it is considered to be noise-dominated and hence unusable.
| Quadrant | # 1 sec bins | Bins with >0 counts | Bins with >2000 counts | High rate bins dominated by noise | Noise dominated (total time) | Noise dominated (detector-on time) | Marked lightcurve |
|---|---|---|---|---|---|---|---|
| A | 7230 | 6116 | 1184 | 1184 | 16.38% | 19.36% | 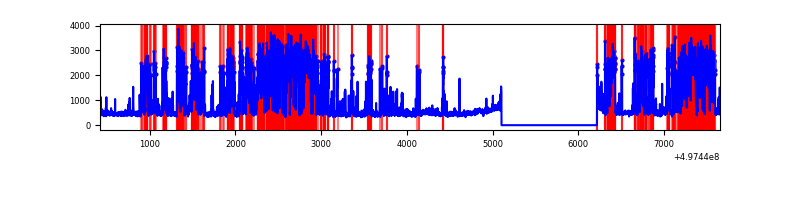 |
| B | 7231 | 6117 | 105 | 105 | 1.45% | 1.72% | 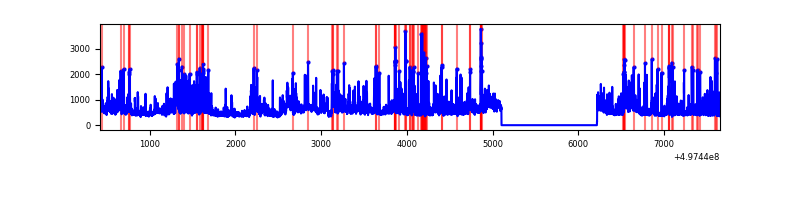 |
| C | 7231 | 6117 | 58 | 58 | 0.80% | 0.95% | 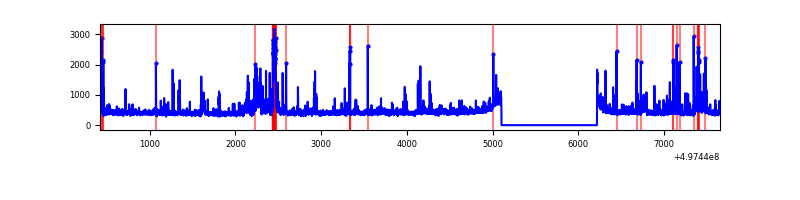 |
| D | 7230 | 6116 | 2848 | 2848 | 39.39% | 46.57% | 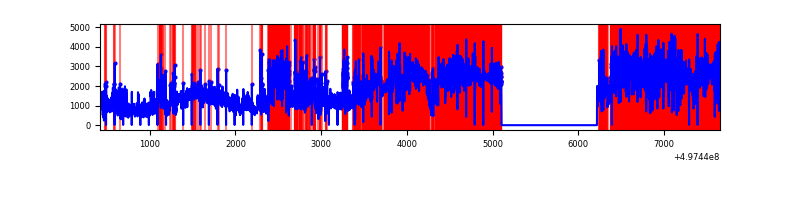 |
Top three noisy pixels from each quadrant. If the there are fewer than three noisy pixels in the level2.evt file, extra rows are filled as -1
| Pixel properties | Quadrant properties | ||||||
|---|---|---|---|---|---|---|---|
| Quadrant | DetID | PixID | Counts | Sigma | Mean | Median | Sigma |
| A | 12 | 17 | 3334852 | 22871.95 | 585 | 571 | 145.8 |
| A | 12 | 194 | 417464 | 2859.73 | 585 | 571 | 145.8 |
| A | 15 | 174 | 127081 | 867.81 | 585 | 571 | 145.8 |
| B | 5 | 236 | 868223 | 6229.89 | 643 | 620 | 139.3 |
| B | 4 | 171 | 227297 | 1627.67 | 643 | 620 | 139.3 |
| B | 8 | 234 | 217413 | 1556.7 | 643 | 620 | 139.3 |
| C | 12 | 2 | 190067 | 1079.47 | 630 | 624 | 175.5 |
| C | 13 | 3 | 88246 | 499.28 | 630 | 624 | 175.5 |
| C | 15 | 215 | 79238 | 447.95 | 630 | 624 | 175.5 |
| D | 8 | 176 | 10878894 | 313423.5 | 117 | 112 | 34.7 |
| D | 8 | 160 | 64961 | 1868.33 | 117 | 112 | 34.7 |
| D | 2 | 172 | 48467 | 1393.13 | 117 | 112 | 34.7 |
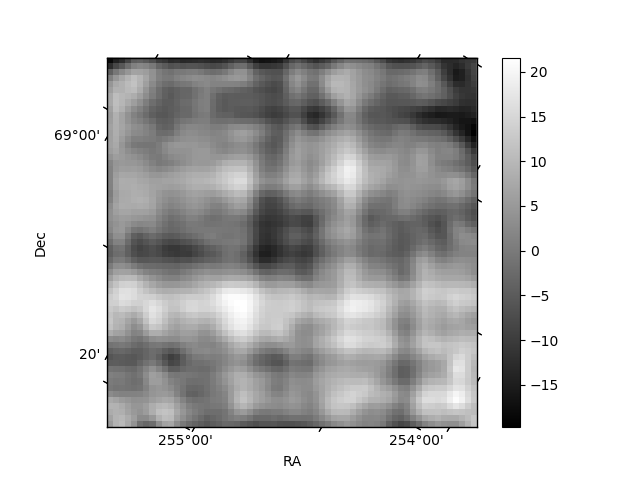
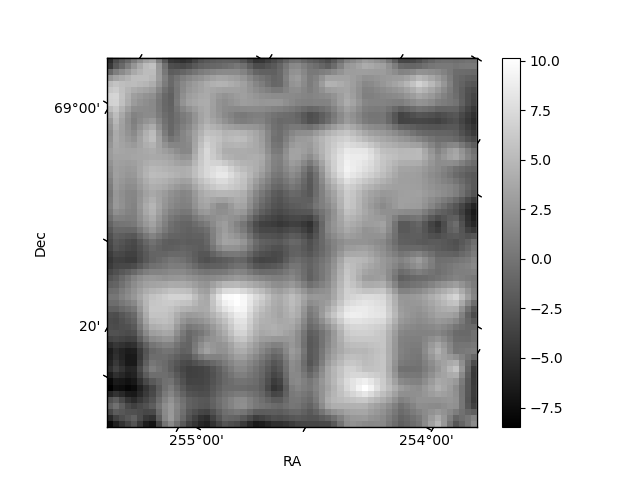
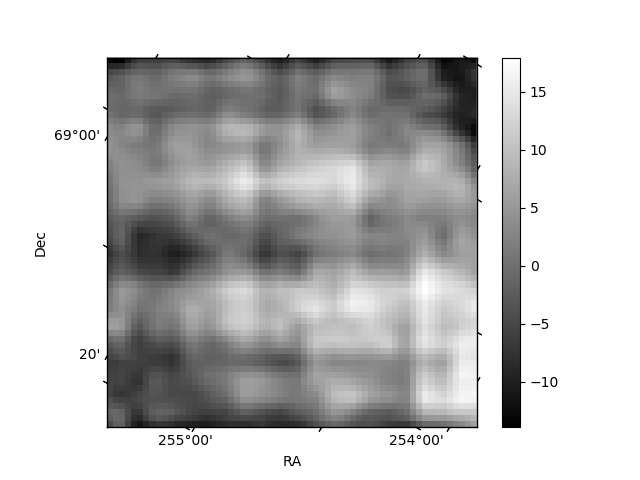
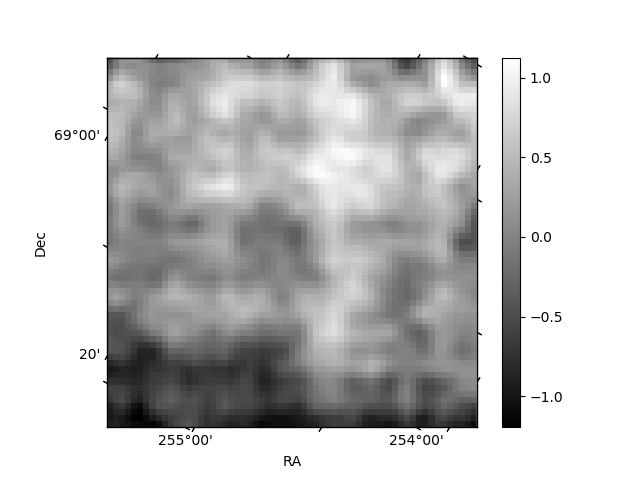
Histogram calculated using DETX and DETY for each event in the final _common_clean file
| Quadrant A | 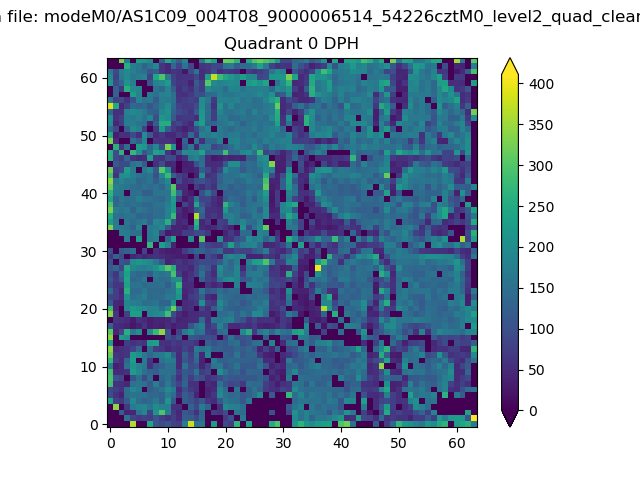 |
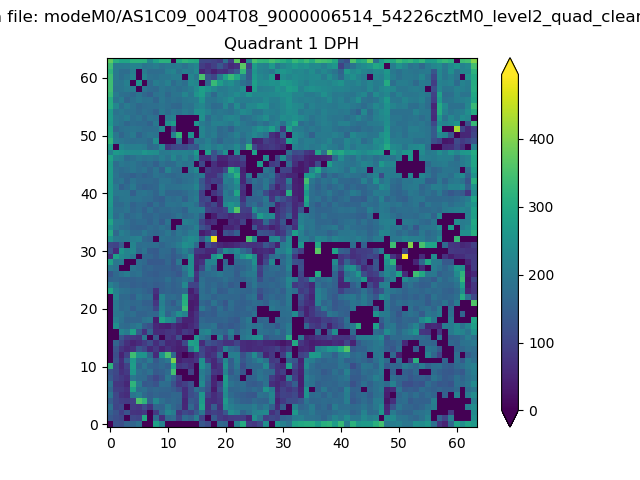 |
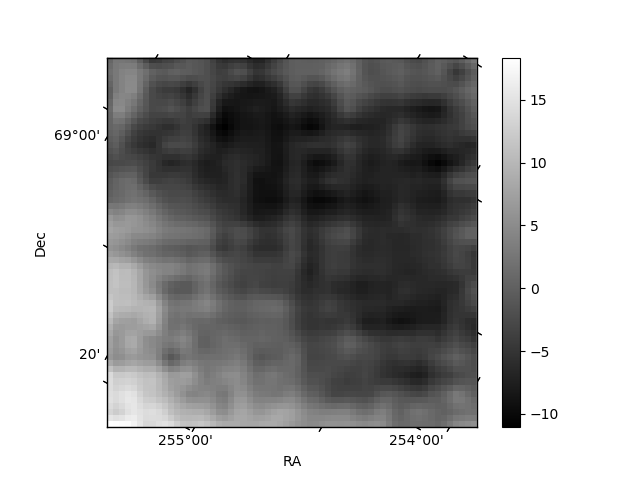
Quadrant B |
|---|---|---|---|
| Quadrant D | 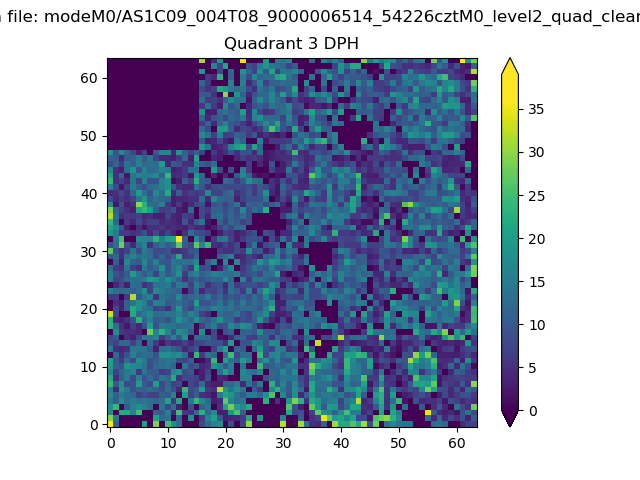 |
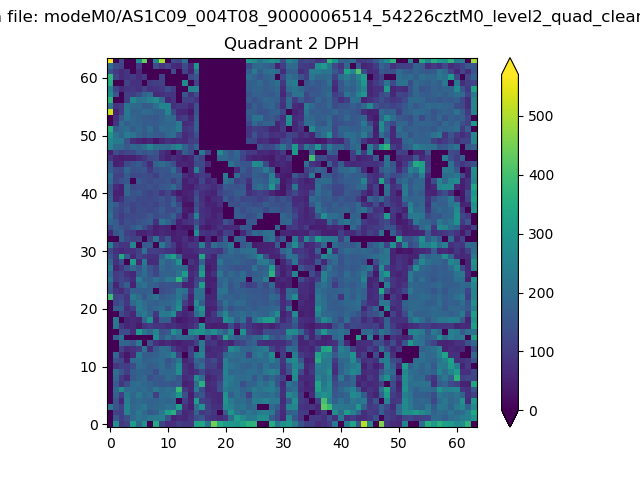 |
Quadrant C |
| Plot type | Count rate plots | Images |
|---|---|---|
| Comparison with Poisson distribution Blue bars denote a histogram of data divided into 1 sec bins. Red curve is a Poisson curve with rate = median count rate of data. |
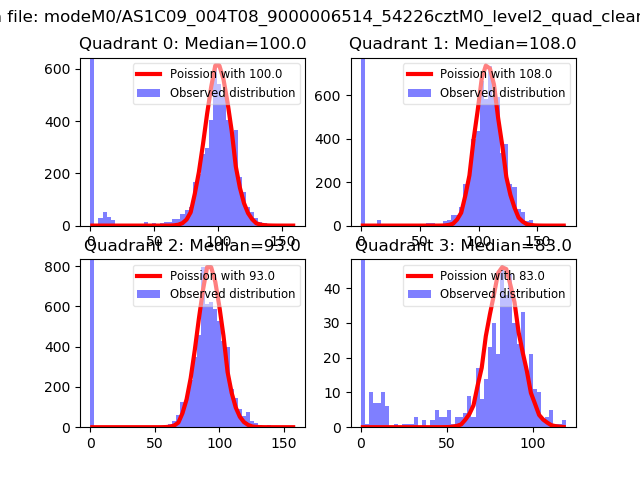 |
 |
| Quadrant-wise count rates Data is divided into 100 sec bins |
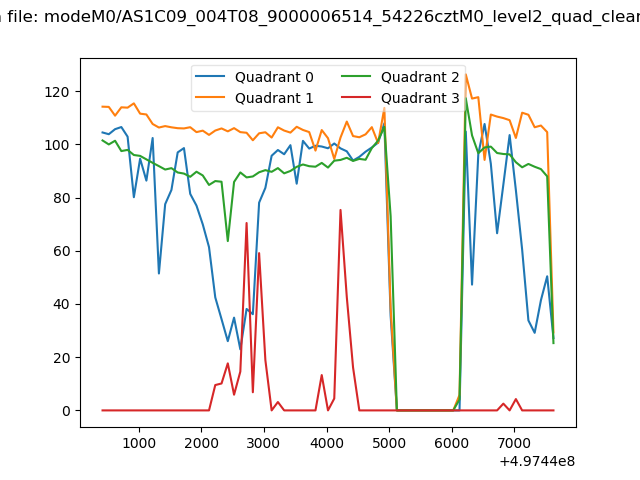 |
|
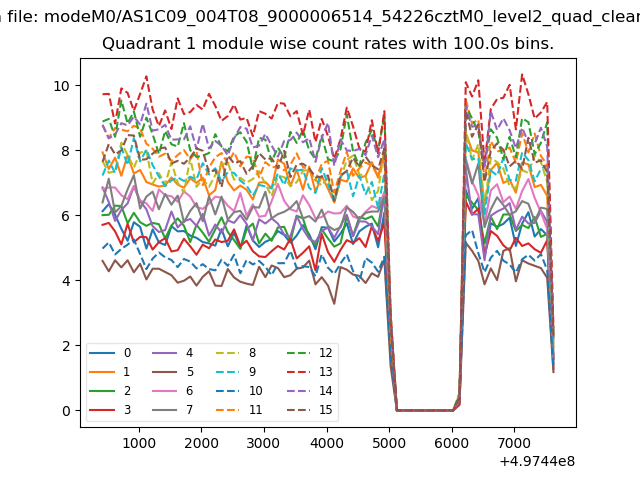
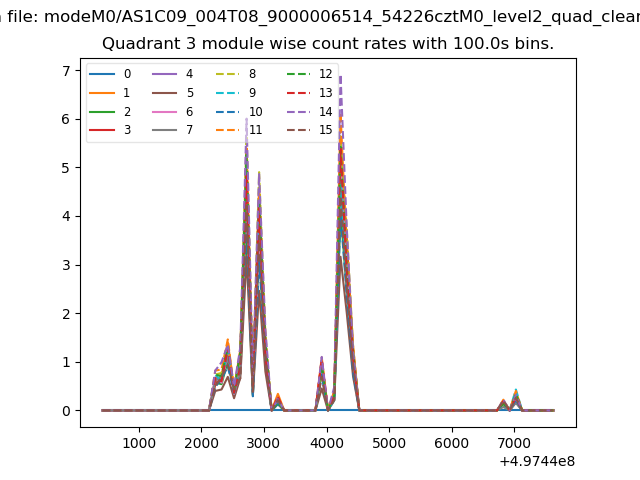
| Module-wise count rates for Quadrant A Data is divided into 100 sec bins |
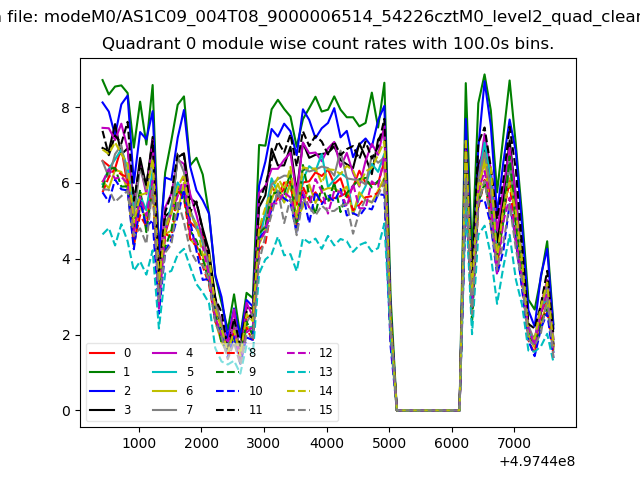 |
 |
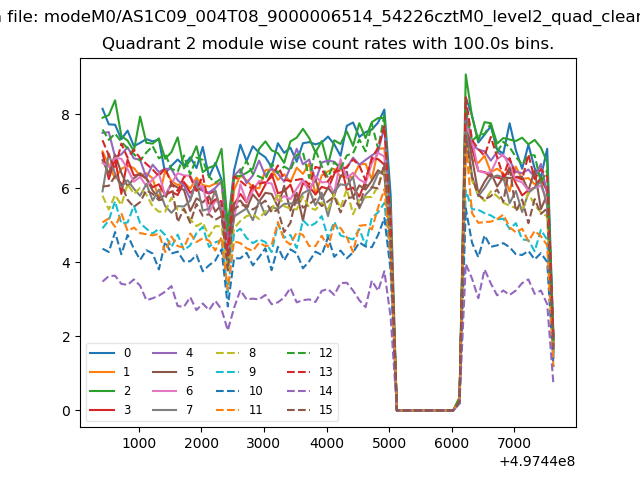
| Module-wise count rates for Quadrant B Data is divided into 100 sec bins |
 |
 |
| Module-wise count rates for Quadrant C Data is divided into 100 sec bins |
 |
 |
| Module-wise count rates for Quadrant D Data is divided into 100 sec bins |
 |
 |
| Parameter | Plot |
|---|---|
| CZT HV Monitor | 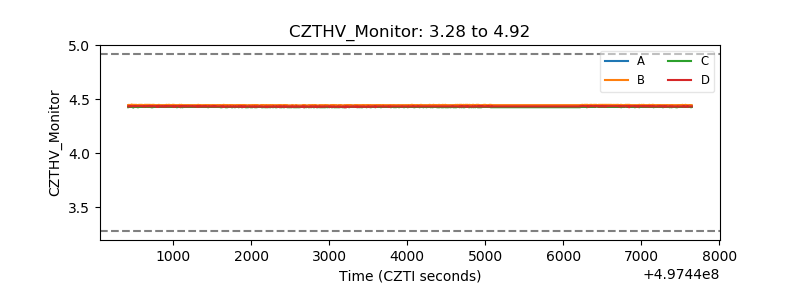 |
| D_VDD | 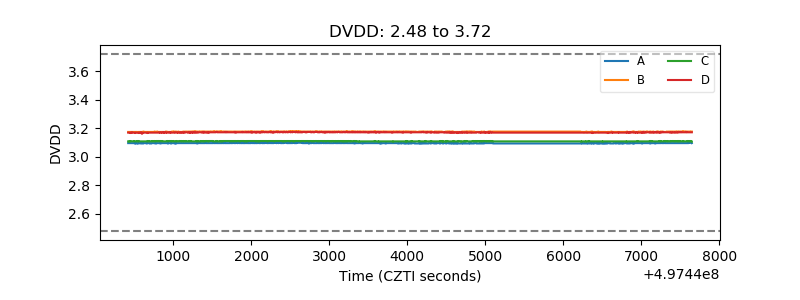 |
| Temperature 1 | 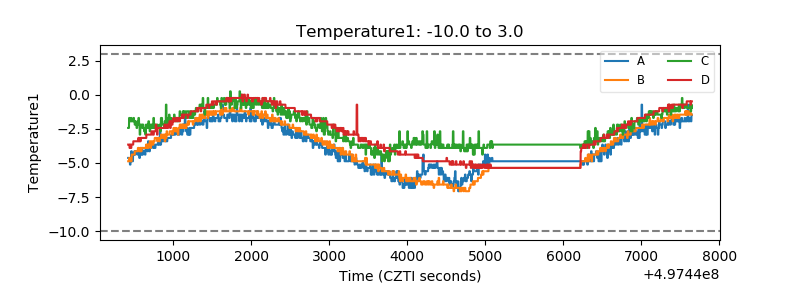 |
| Veto HV Monitor | 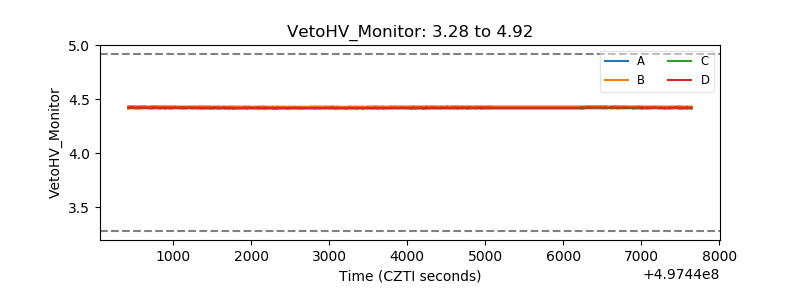 |
| Veto LLD | 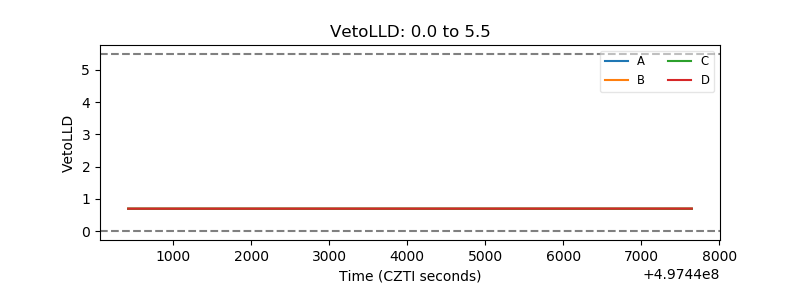 |
| Alpha Counter | 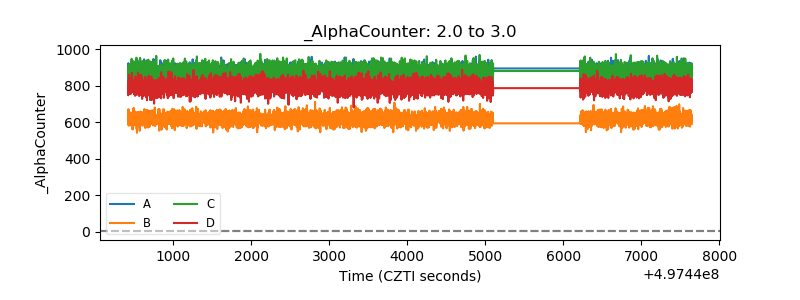 |
| _CPM_Rate | 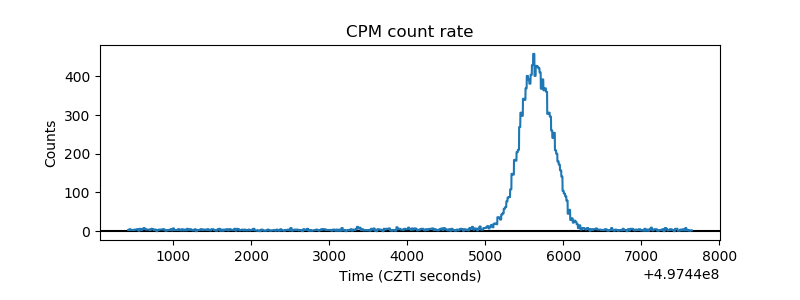 |
| CZT Counter | 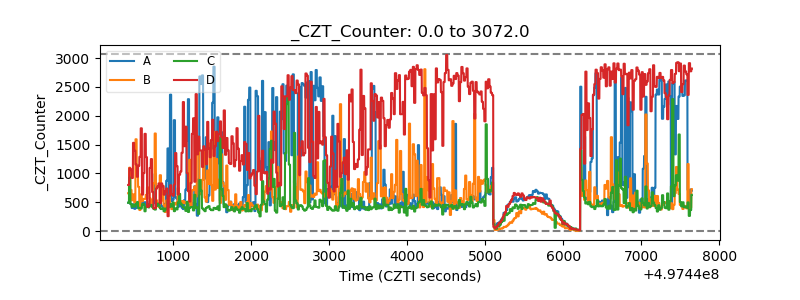 |
| +2.5 Volts monitor | 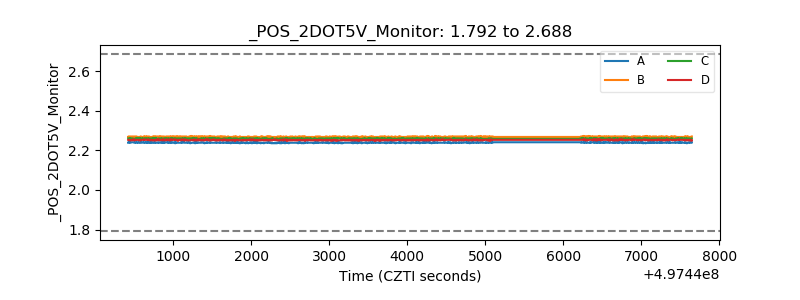 |
| +5 Volts monitor |  |
| _ROLL_ROT | 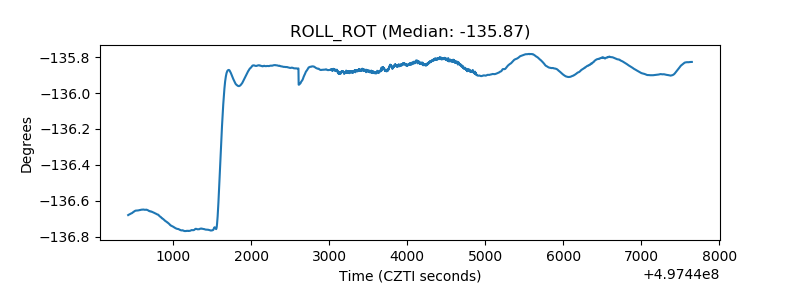 |
| _Roll_DEC | 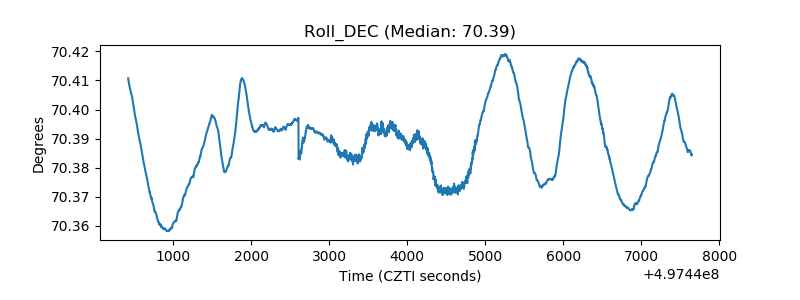 |
| _Roll_RA | 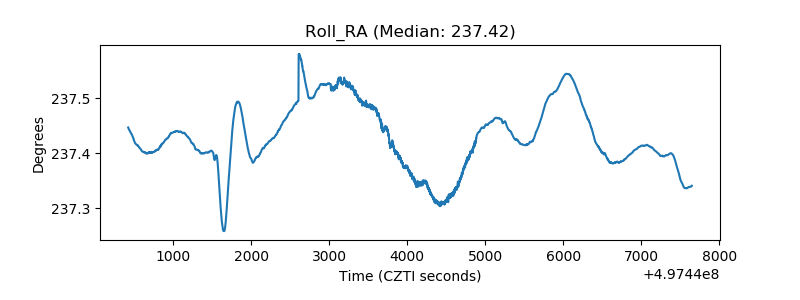 |
| Veto Counter | 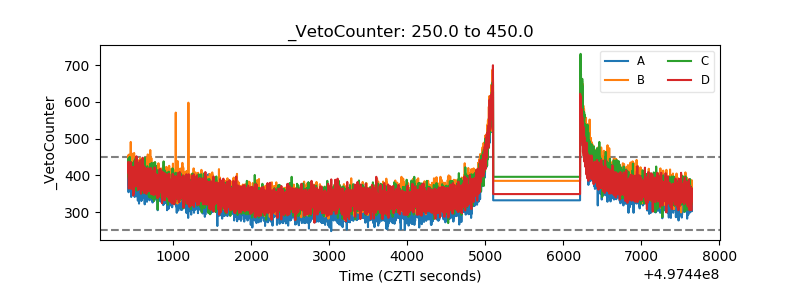 |