| Param | Original file | Final file |
|---|---|---|
| Filename | modeM0/AS1C09_004T08_9000006514_54227cztM0_level2.fits | modeM0/AS1C09_004T08_9000006514_54227cztM0_level2_quad_clean.evt |
| Size (bytes) | 747,074,880 | 78,428,160 |
| Size | 712.5 MB | 74.8 MB |
| Events in quadrant A | 5,140,091 | 569,948 |
| Events in quadrant B | 3,902,521 | 677,408 |
| Events in quadrant C | 3,415,403 | 587,432 |
| Events in quadrant D | 14,692,293 | 87,357 |
| Mode M0 | |||
|---|---|---|---|
| Quadrant | BADHDUFLAG | Total packets | Discarded packets |
| A | 0 | 19847 | 2 |
| B | 0 | 16040 | 1 |
| C | 0 | 14927 | 1 |
| D | 0 | 48084 | 1 |
| Mode M9 | |||
|---|---|---|---|
| Quadrant | BADHDUFLAG | Total packets | Discarded packets |
| A | 0 | 9 | 0 |
| B | 0 | 9 | 0 |
| C | 0 | 9 | 0 |
| D | 0 | 9 | 0 |
| Mode SS | |||
|---|---|---|---|
| Quadrant | BADHDUFLAG | Total packets | Discarded packets |
| A | 0 | 134 | 0 |
| B | 0 | 134 | 0 |
| C | 0 | 134 | 0 |
| D | 0 | 134 | 0 |
| Quadrant | Total seconds | Saturated seconds | Saturation percentage |
|---|---|---|---|
| A | 6479 | 819 | 12.640840% |
| B | 6479 | 202 | 3.117765% |
| C | 6480 | 134 | 2.067901% |
| D | 6480 | 5598 | 86.388889% |
Noise dominated data is calculated using 1-second bins in cleaned event files. If a bin has >2000 counts, and if more than 50% of those come from <1% of pixels, then it is considered to be noise-dominated and hence unusable.
| Quadrant | # 1 sec bins | Bins with >0 counts | Bins with >2000 counts | High rate bins dominated by noise | Noise dominated (total time) | Noise dominated (detector-on time) | Marked lightcurve |
|---|---|---|---|---|---|---|---|
| A | 7449 | 6480 | 616 | 616 | 8.27% | 9.51% | 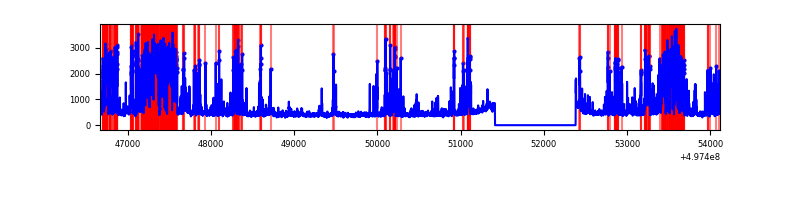 |
| B | 7449 | 6480 | 71 | 71 | 0.95% | 1.10% | 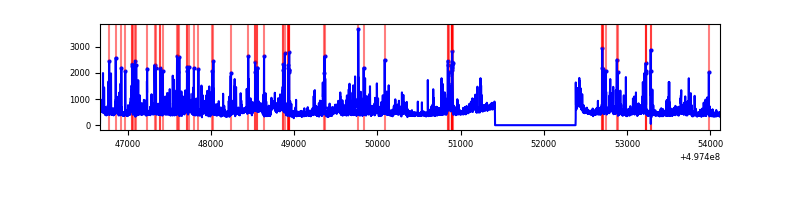 |
| C | 7450 | 6481 | 60 | 60 | 0.81% | 0.93% | 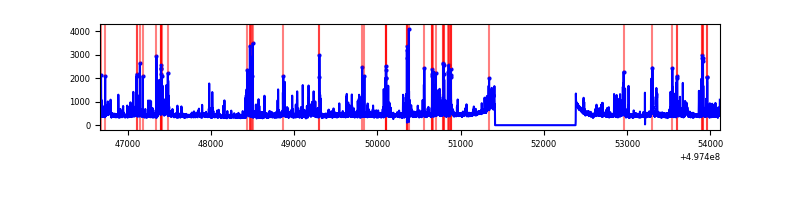 |
| D | 7449 | 6480 | 4561 | 4561 | 61.23% | 70.39% | 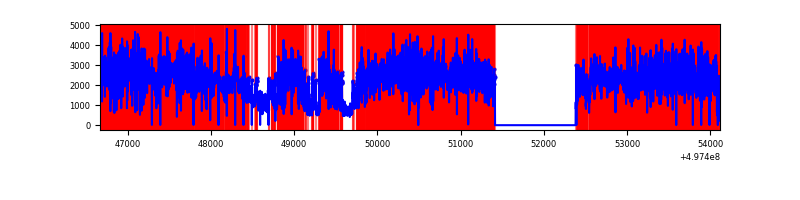 |
Top three noisy pixels from each quadrant. If the there are fewer than three noisy pixels in the level2.evt file, extra rows are filled as -1
| Pixel properties | Quadrant properties | ||||||
|---|---|---|---|---|---|---|---|
| Quadrant | DetID | PixID | Counts | Sigma | Mean | Median | Sigma |
| A | 12 | 17 | 1845298 | 11335.65 | 655 | 640 | 162.7 |
| A | 12 | 194 | 237316 | 1454.4 | 655 | 640 | 162.7 |
| A | 15 | 174 | 161761 | 990.11 | 655 | 640 | 162.7 |
| B | 5 | 236 | 451631 | 3101.97 | 678 | 654 | 145.4 |
| B | 4 | 171 | 295460 | 2027.77 | 678 | 654 | 145.4 |
| B | 8 | 234 | 164015 | 1123.65 | 678 | 654 | 145.4 |
| C | 15 | 215 | 203450 | 1109.03 | 665 | 656 | 182.9 |
| C | 13 | 3 | 102310 | 555.92 | 665 | 656 | 182.9 |
| C | 12 | 252 | 96284 | 522.96 | 665 | 656 | 182.9 |
| D | 8 | 176 | 13311891 | 179380.03 | 254 | 241 | 74.2 |
| D | 2 | 62 | 54407 | 729.91 | 254 | 241 | 74.2 |
| D | 2 | 153 | 40106 | 537.2 | 254 | 241 | 74.2 |
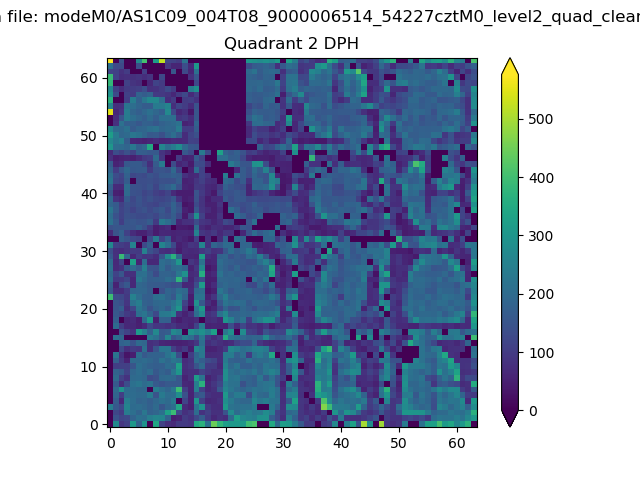
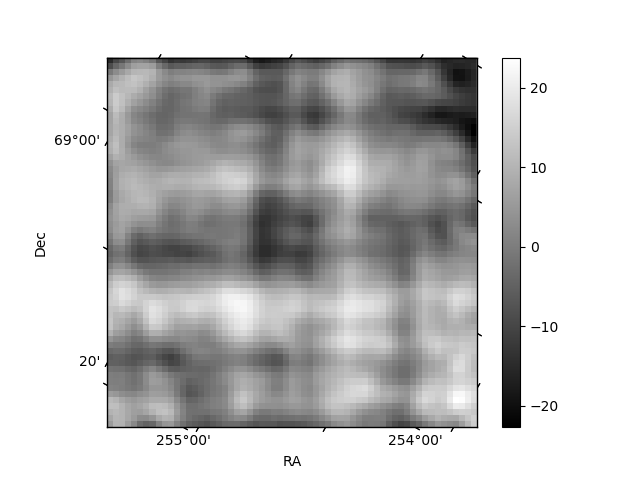
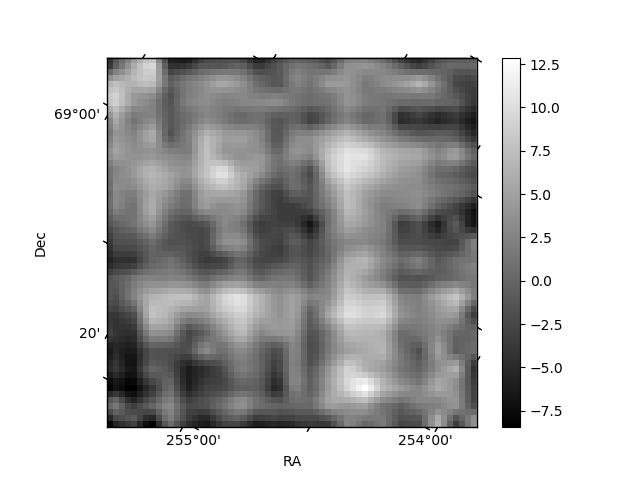
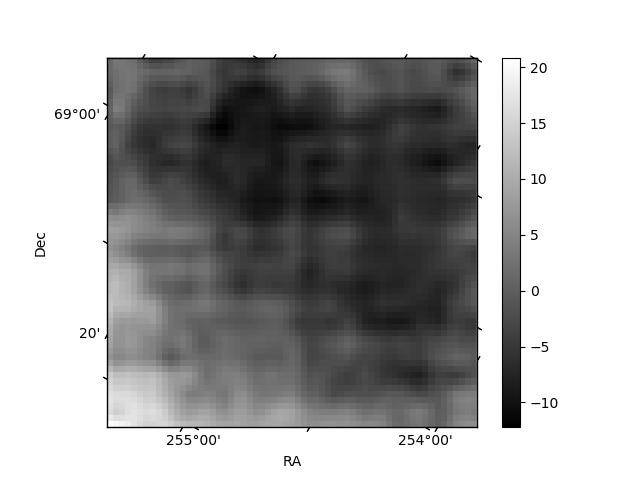
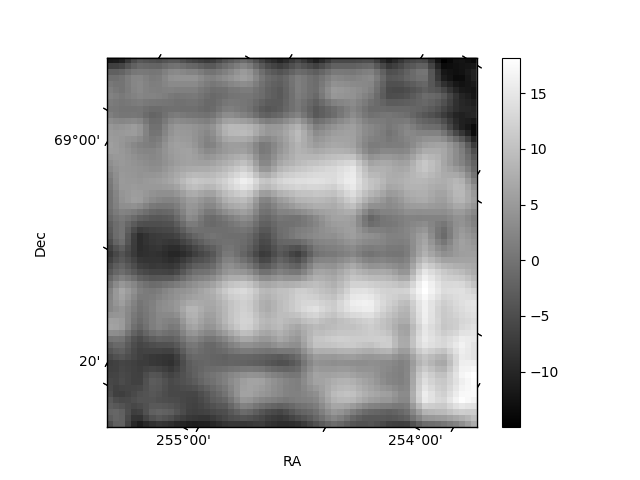
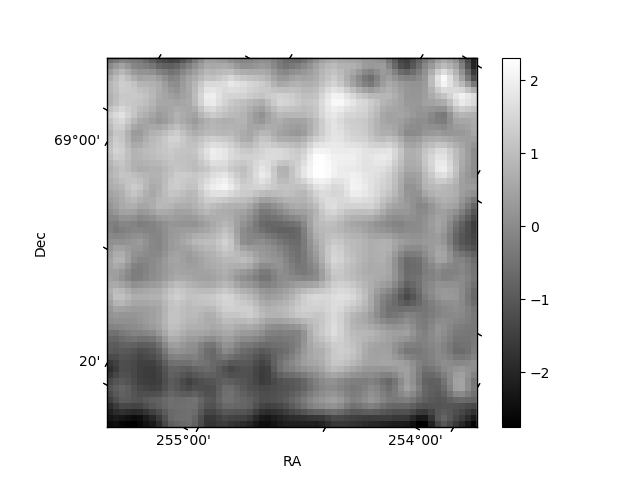
Histogram calculated using DETX and DETY for each event in the final _common_clean file
| Quadrant A | 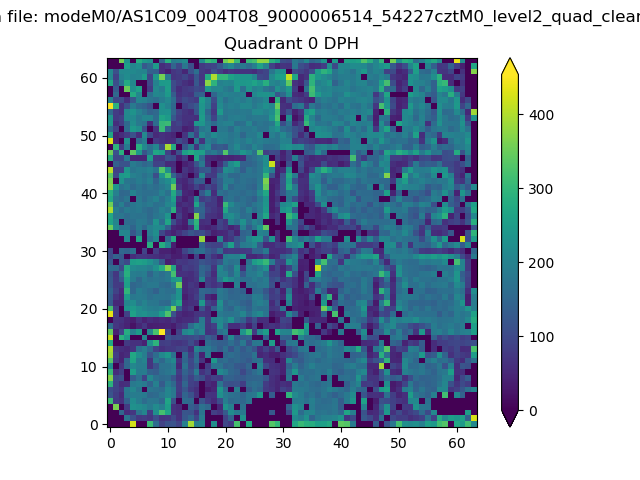 |
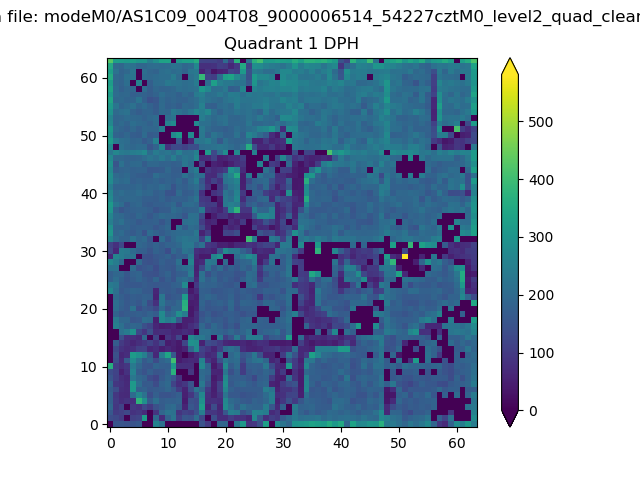 |
Quadrant B |
|---|---|---|---|
| Quadrant D | 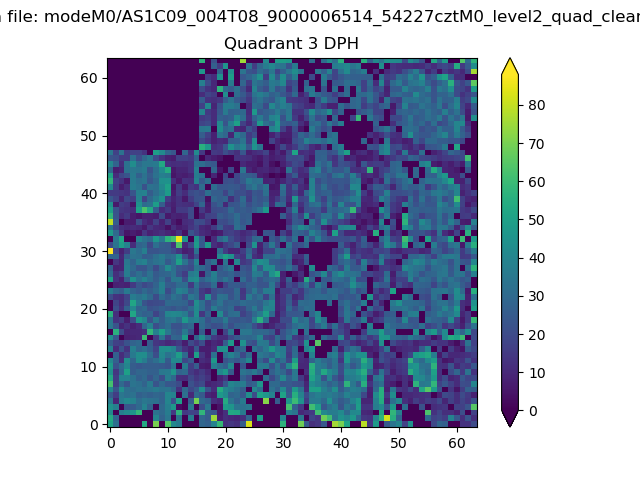 |
 |
Quadrant C |
| Plot type | Count rate plots | Images |
|---|---|---|
| Comparison with Poisson distribution Blue bars denote a histogram of data divided into 1 sec bins. Red curve is a Poisson curve with rate = median count rate of data. |
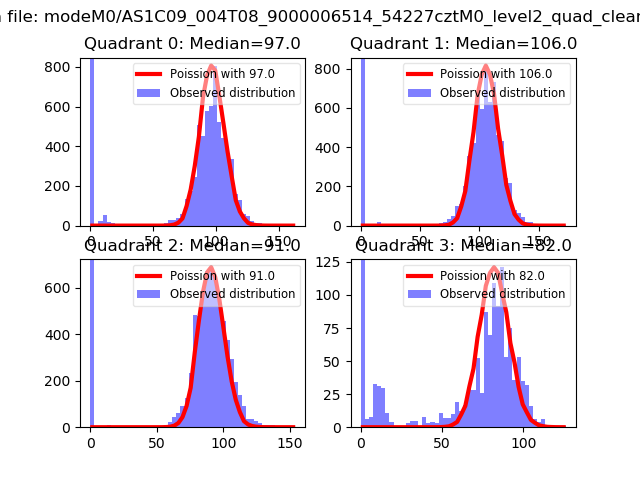 |
 |
| Quadrant-wise count rates Data is divided into 100 sec bins |
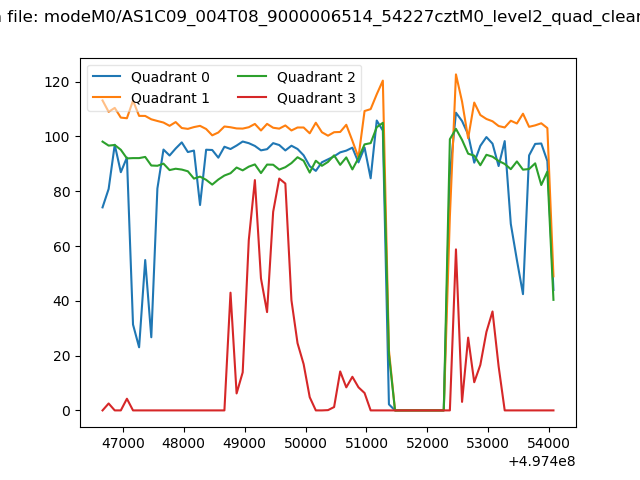 |
|
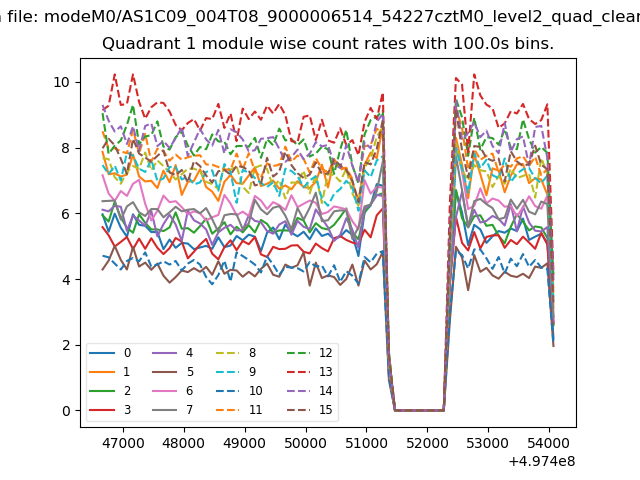
| Module-wise count rates for Quadrant A Data is divided into 100 sec bins |
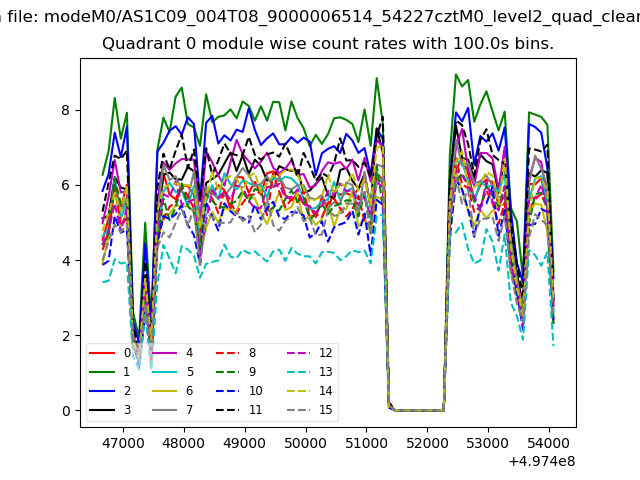 |
 |
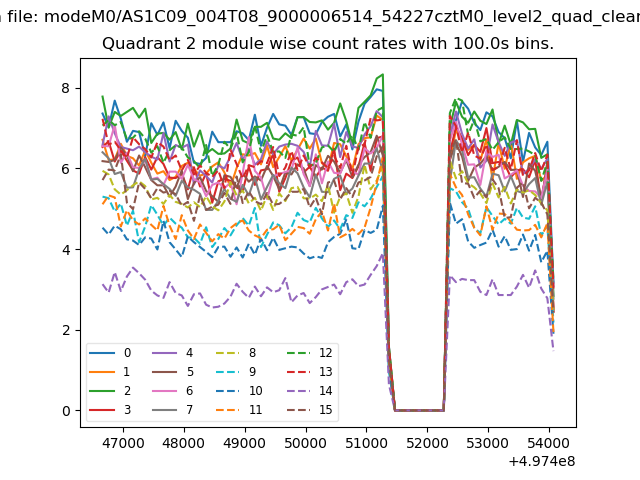
| Module-wise count rates for Quadrant B Data is divided into 100 sec bins |
 |
 |
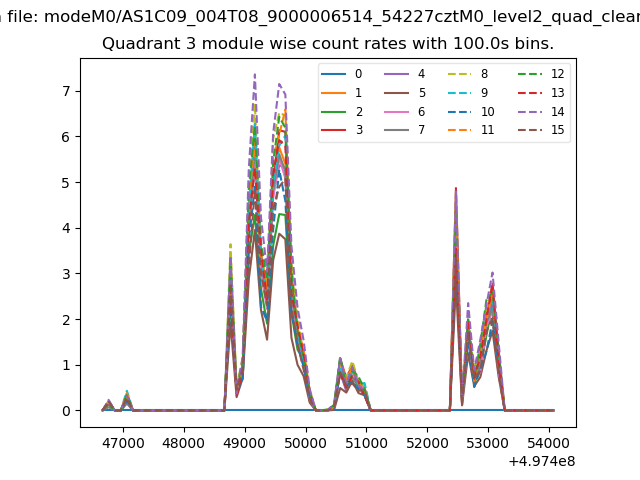
| Module-wise count rates for Quadrant C Data is divided into 100 sec bins |
 |
 |
| Module-wise count rates for Quadrant D Data is divided into 100 sec bins |
 |
 |
| Parameter | Plot |
|---|---|
| CZT HV Monitor | 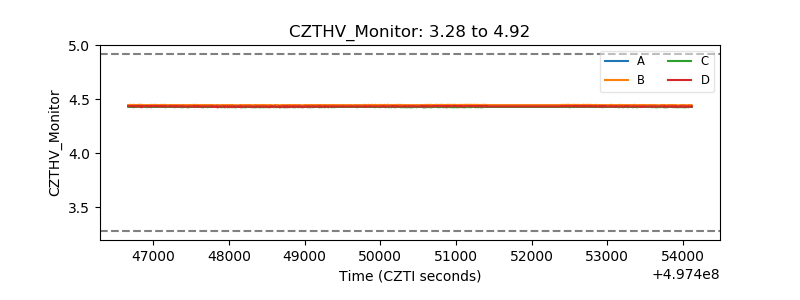 |
| D_VDD | 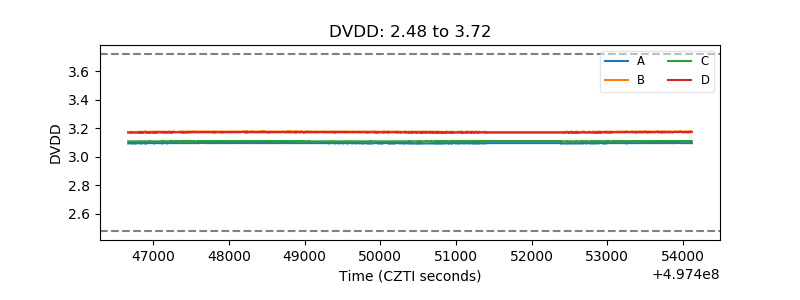 |
| Temperature 1 | 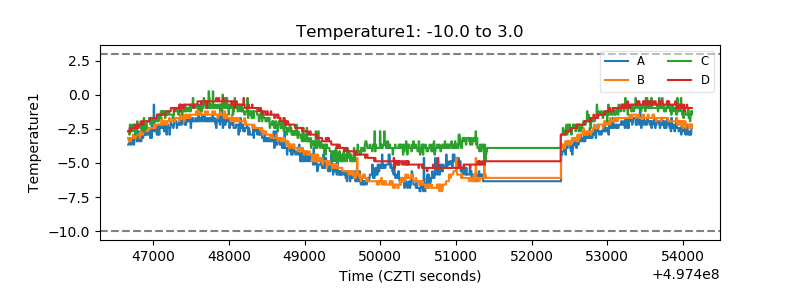 |
| Veto HV Monitor | 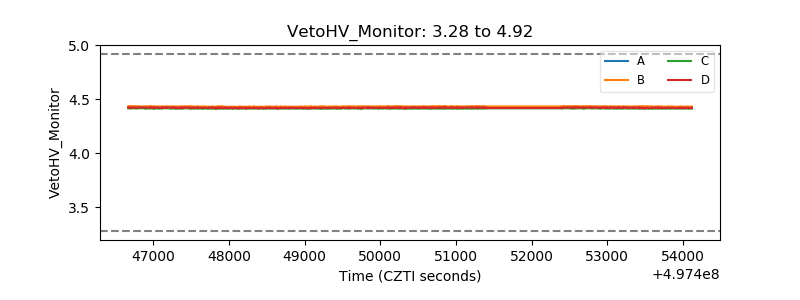 |
| Veto LLD | 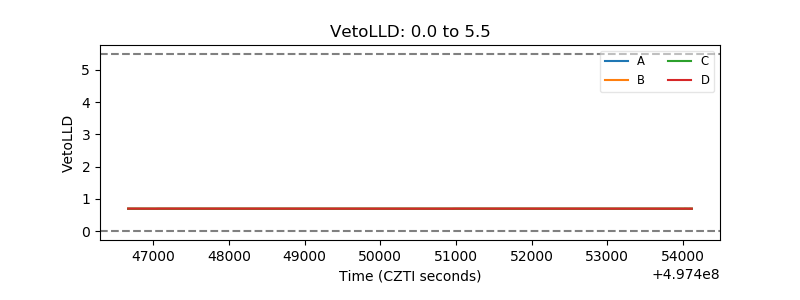 |
| Alpha Counter | 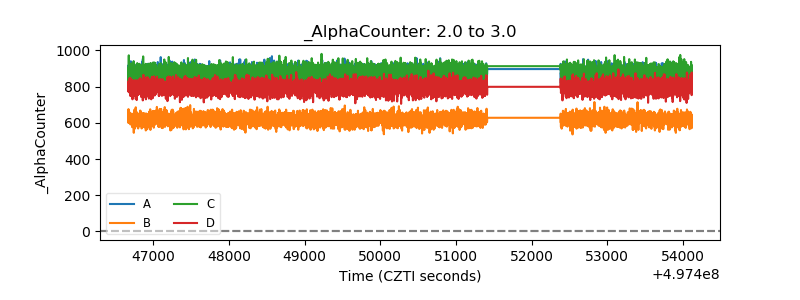 |
| _CPM_Rate | 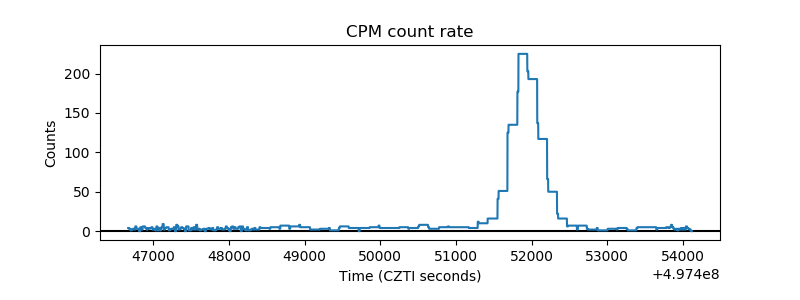 |
| CZT Counter | 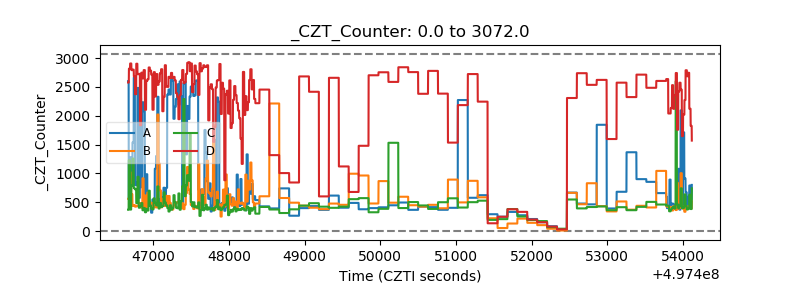 |
| +2.5 Volts monitor |  |
| +5 Volts monitor | 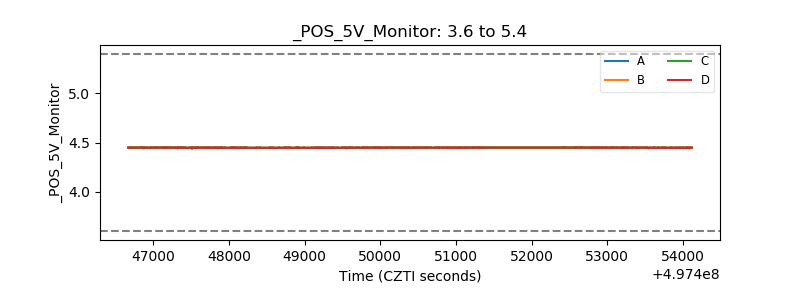 |
| _ROLL_ROT | 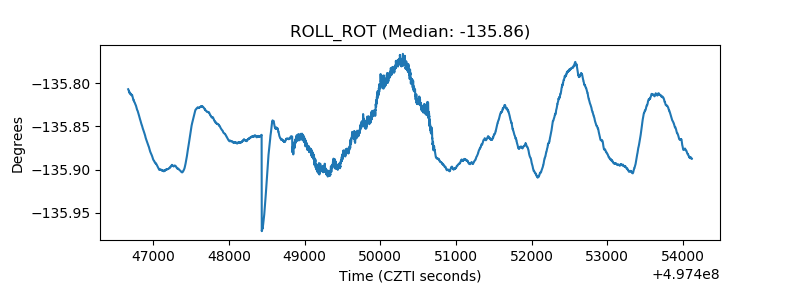 |
| _Roll_DEC | 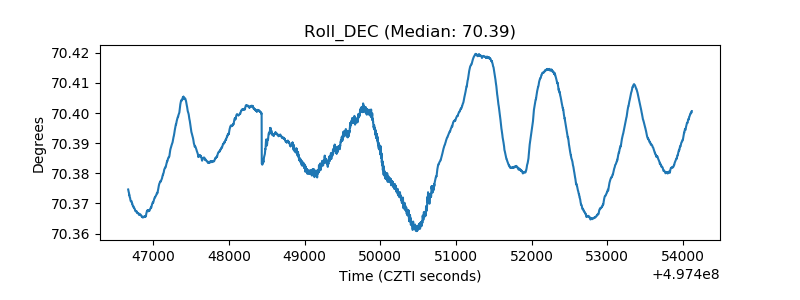 |
| _Roll_RA | 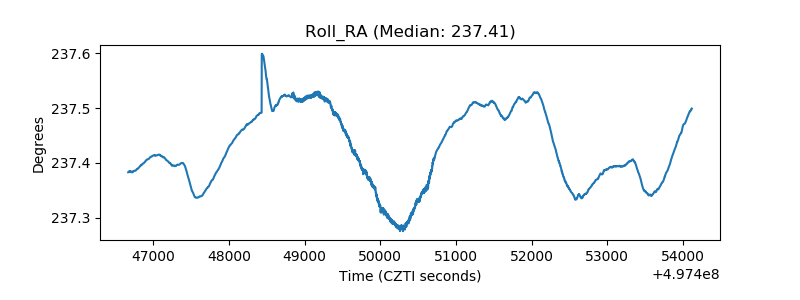 |
| Veto Counter | 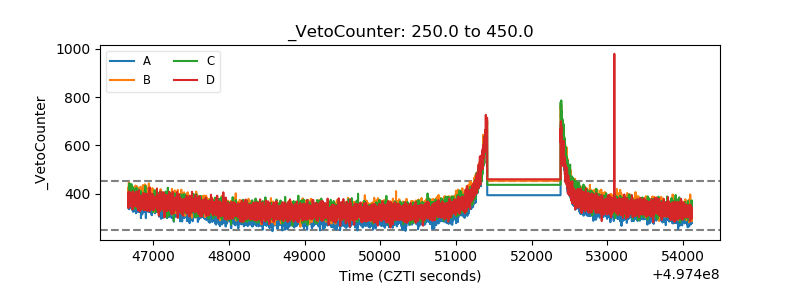 |