| Param | Original file | Final file |
|---|---|---|
| Filename | modeM0/AS1C09_004T08_9000006514_54229cztM0_level2.fits | modeM0/AS1C09_004T08_9000006514_54229cztM0_level2_quad_clean.evt |
| Size (bytes) | 925,735,680 | 72,590,400 |
| Size | 882.9 MB | 69.2 MB |
| Events in quadrant A | 6,788,094 | 512,109 |
| Events in quadrant B | 4,336,491 | 682,610 |
| Events in quadrant C | 5,791,082 | 511,776 |
| Events in quadrant D | 16,825,930 | 19,245 |
| Mode M0 | |||
|---|---|---|---|
| Quadrant | BADHDUFLAG | Total packets | Discarded packets |
| A | 0 | 24985 | 1 |
| B | 0 | 17650 | 1 |
| C | 0 | 22118 | 1 |
| D | 0 | 54577 | 2 |
| Mode M9 | |||
|---|---|---|---|
| Quadrant | BADHDUFLAG | Total packets | Discarded packets |
| A | 0 | 3 | 0 |
| B | 0 | 3 | 0 |
| C | 0 | 3 | 0 |
| D | 0 | 3 | 0 |
| Mode SS | |||
|---|---|---|---|
| Quadrant | BADHDUFLAG | Total packets | Discarded packets |
| A | 0 | 138 | 0 |
| B | 0 | 138 | 0 |
| C | 0 | 138 | 0 |
| D | 0 | 138 | 0 |
| Quadrant | Total seconds | Saturated seconds | Saturation percentage |
|---|---|---|---|
| A | 6783 | 1511 | 22.276279% |
| B | 6784 | 250 | 3.685142% |
| C | 6784 | 1085 | 15.993514% |
| D | 6783 | 6596 | 97.243108% |
Noise dominated data is calculated using 1-second bins in cleaned event files. If a bin has >2000 counts, and if more than 50% of those come from <1% of pixels, then it is considered to be noise-dominated and hence unusable.
| Quadrant | # 1 sec bins | Bins with >0 counts | Bins with >2000 counts | High rate bins dominated by noise | Noise dominated (total time) | Noise dominated (detector-on time) | Marked lightcurve |
|---|---|---|---|---|---|---|---|
| A | 6983 | 6787 | 1098 | 1098 | 15.72% | 16.18% | 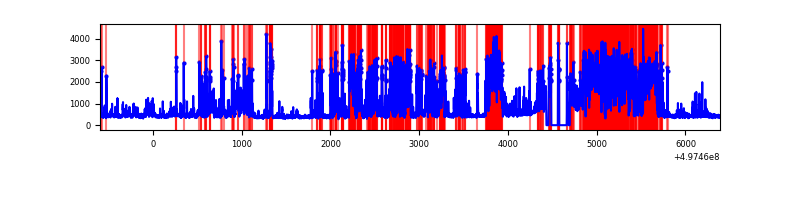 |
| B | 6984 | 6788 | 72 | 72 | 1.03% | 1.06% | 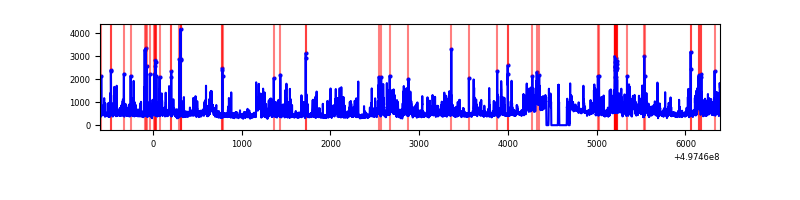 |
| C | 6984 | 6788 | 786 | 786 | 11.25% | 11.58% | 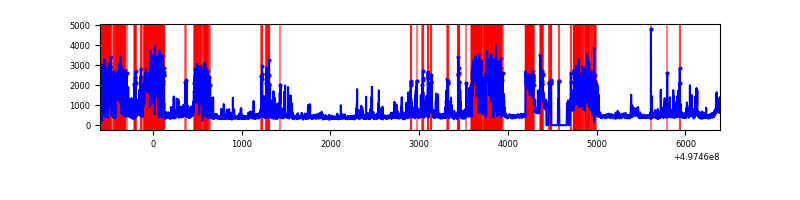 |
| D | 6982 | 6782 | 5751 | 5751 | 82.37% | 84.80% | 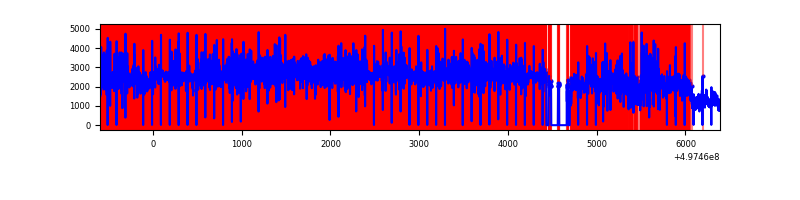 |
Top three noisy pixels from each quadrant. If the there are fewer than three noisy pixels in the level2.evt file, extra rows are filled as -1
| Pixel properties | Quadrant properties | ||||||
|---|---|---|---|---|---|---|---|
| Quadrant | DetID | PixID | Counts | Sigma | Mean | Median | Sigma |
| A | 12 | 17 | 2433445 | 15563.61 | 634 | 619 | 156.3 |
| A | 7 | 29 | 704258 | 4501.42 | 634 | 619 | 156.3 |
| A | 12 | 194 | 307929 | 1965.97 | 634 | 619 | 156.3 |
| B | 4 | 171 | 702237 | 4705.69 | 706 | 682 | 149.1 |
| B | 5 | 236 | 329087 | 2202.78 | 706 | 682 | 149.1 |
| B | 0 | 213 | 163692 | 1093.39 | 706 | 682 | 149.1 |
| C | 1 | 241 | 1439926 | 8129.72 | 642 | 636 | 177.0 |
| C | 15 | 215 | 722717 | 4078.62 | 642 | 636 | 177.0 |
| C | 15 | 189 | 338574 | 1908.82 | 642 | 636 | 177.0 |
| D | 8 | 176 | 16005804 | 436644.96 | 123 | 117 | 36.7 |
| D | 3 | 12 | 115273 | 3141.53 | 123 | 117 | 36.7 |
| D | 8 | 160 | 77545 | 2112.28 | 123 | 117 | 36.7 |
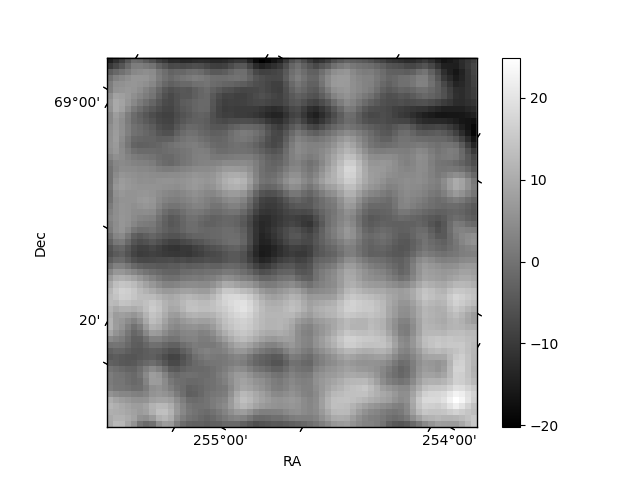
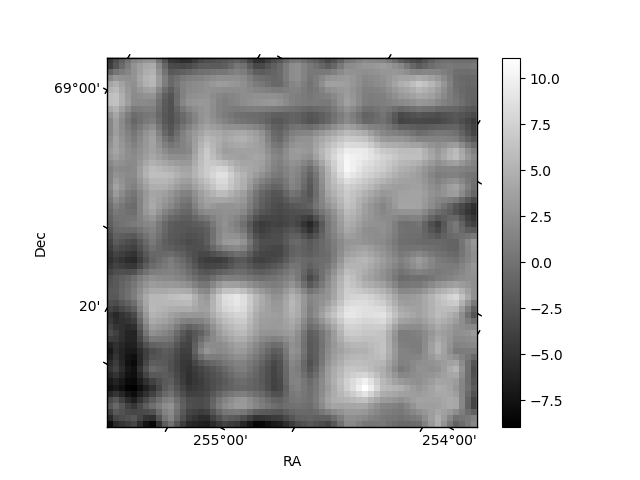
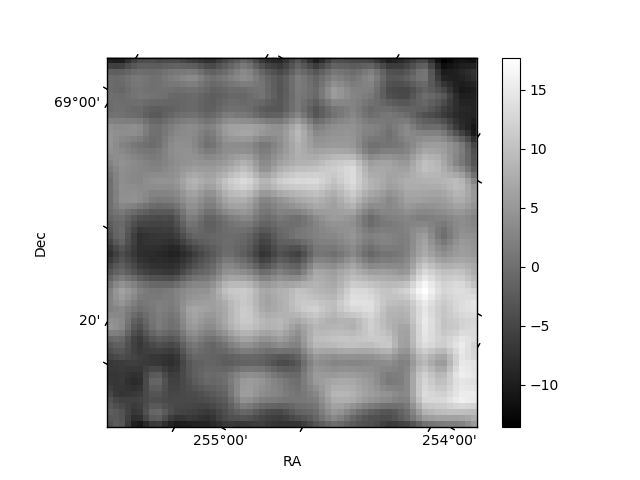
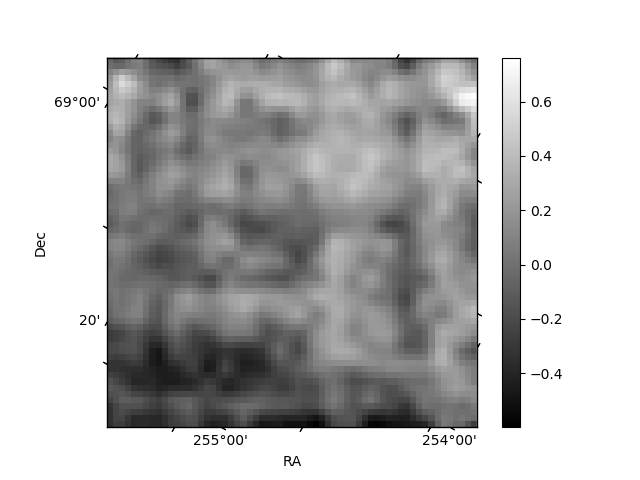
Histogram calculated using DETX and DETY for each event in the final _common_clean file
| Quadrant A | 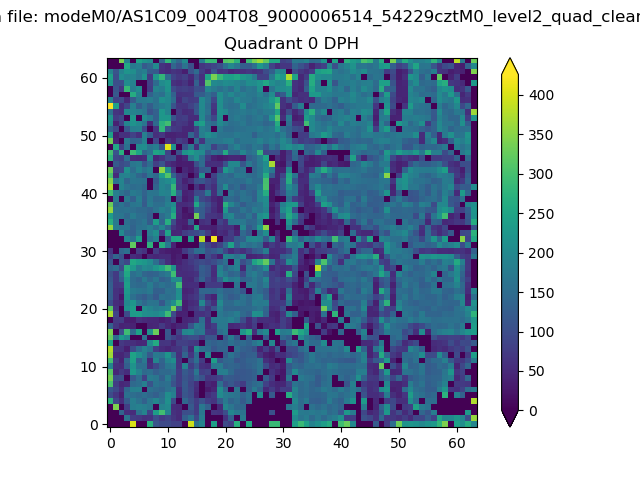 |
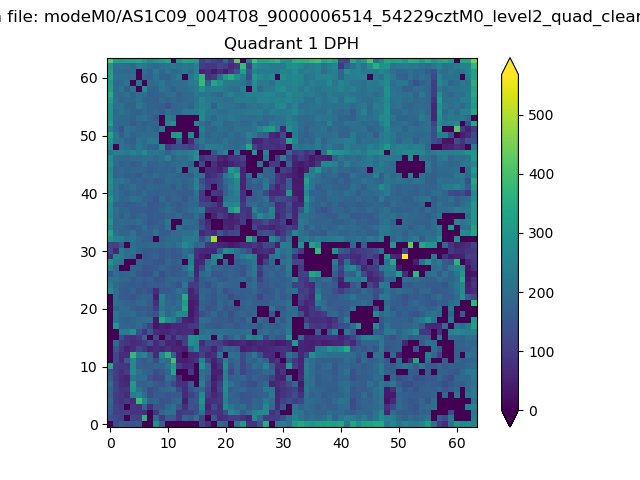 |
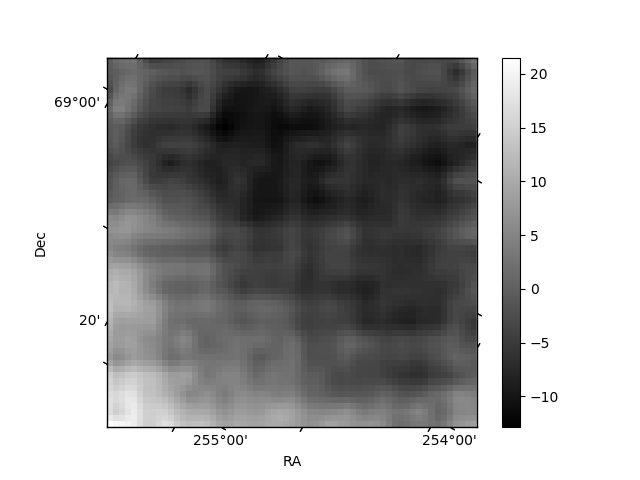
Quadrant B |
|---|---|---|---|
| Quadrant D | 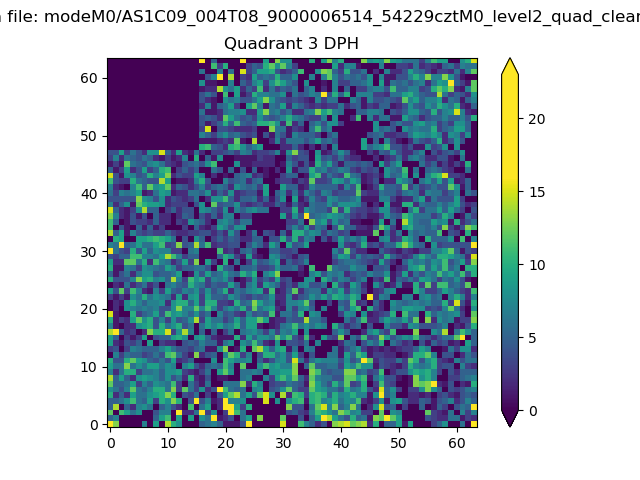 |
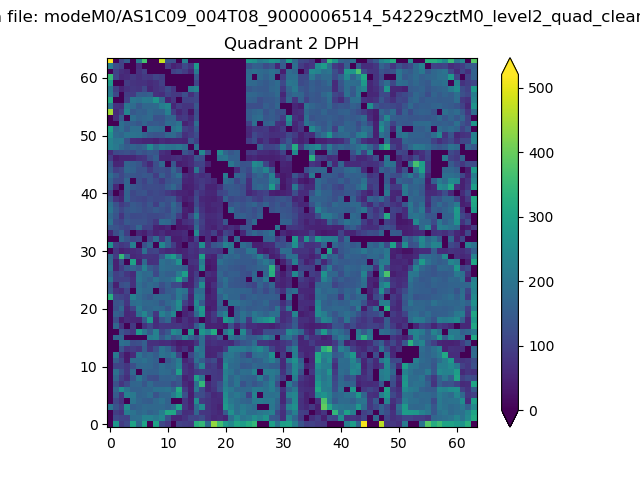 |
Quadrant C |
| Plot type | Count rate plots | Images |
|---|---|---|
| Comparison with Poisson distribution Blue bars denote a histogram of data divided into 1 sec bins. Red curve is a Poisson curve with rate = median count rate of data. |
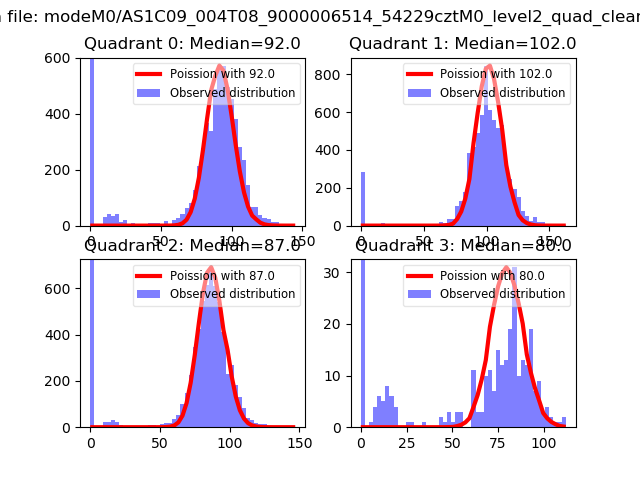 |
 |
| Quadrant-wise count rates Data is divided into 100 sec bins |
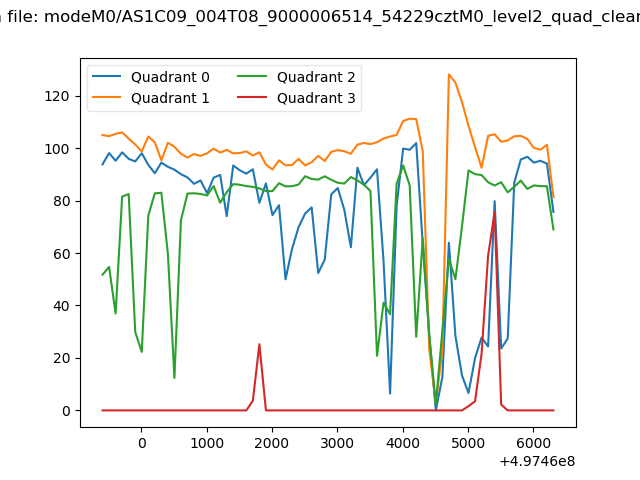 |
|
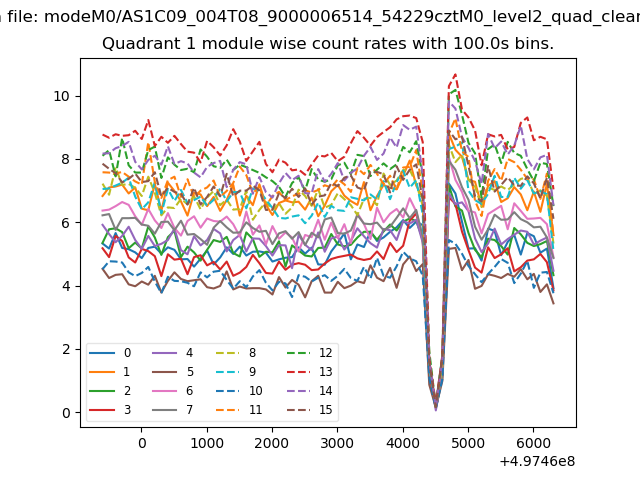
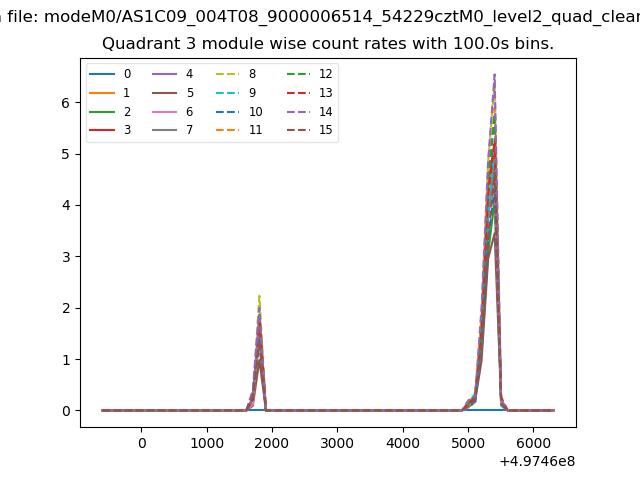
| Module-wise count rates for Quadrant A Data is divided into 100 sec bins |
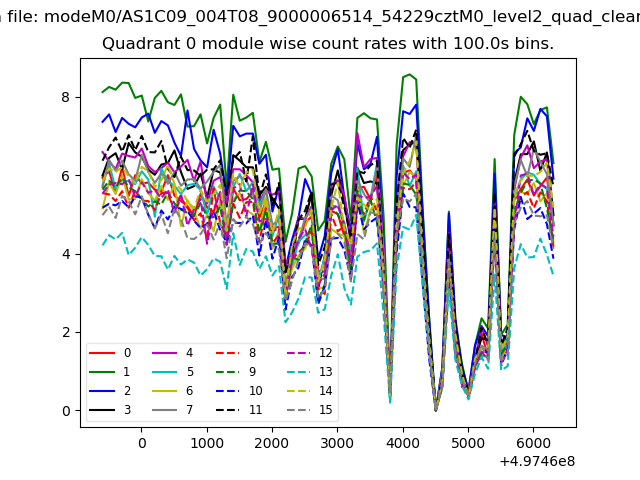 |
 |
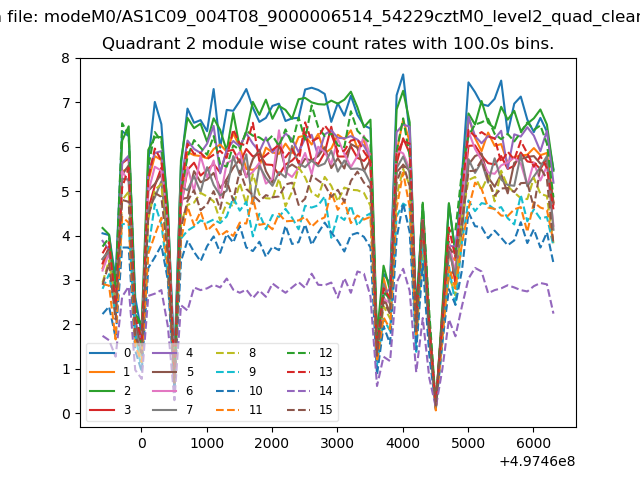
| Module-wise count rates for Quadrant B Data is divided into 100 sec bins |
 |
 |
| Module-wise count rates for Quadrant C Data is divided into 100 sec bins |
 |
 |
| Module-wise count rates for Quadrant D Data is divided into 100 sec bins |
 |
 |
| Parameter | Plot |
|---|---|
| CZT HV Monitor | 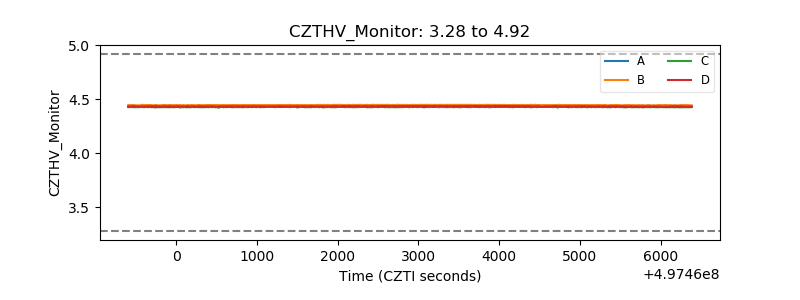 |
| D_VDD | 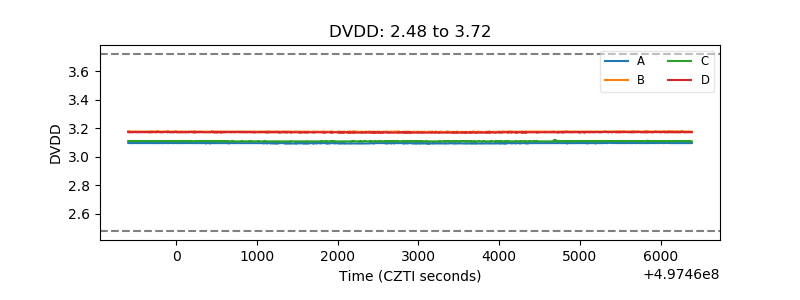 |
| Temperature 1 | 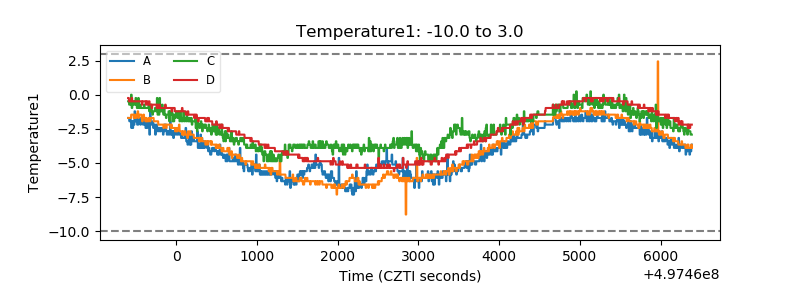 |
| Veto HV Monitor | 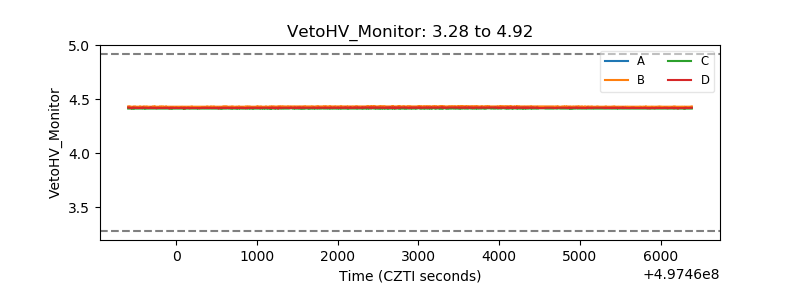 |
| Veto LLD | 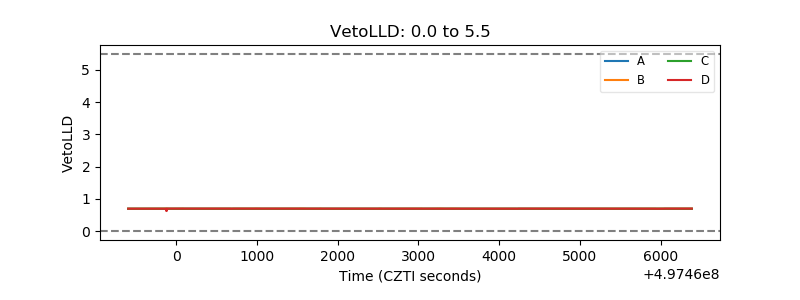 |
| Alpha Counter | 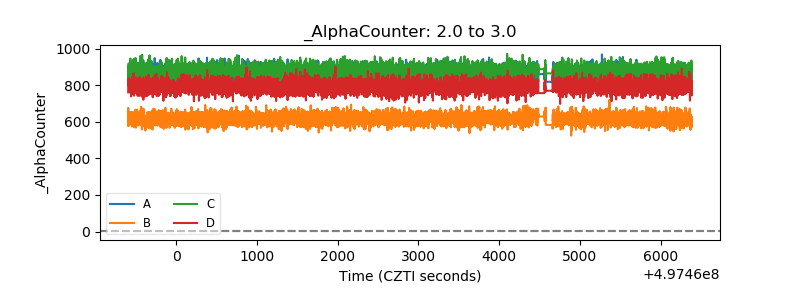 |
| _CPM_Rate | 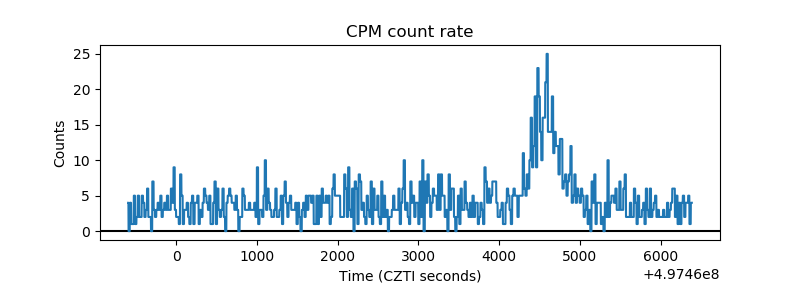 |
| CZT Counter | 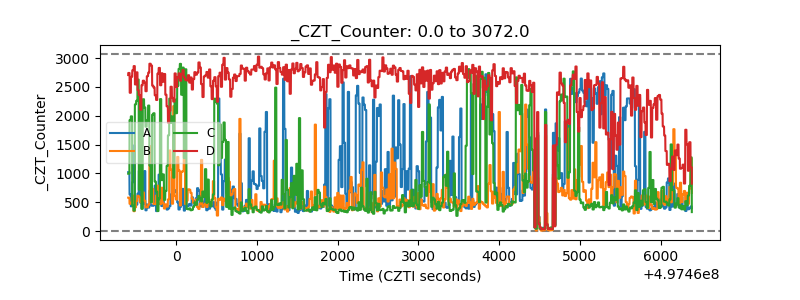 |
| +2.5 Volts monitor |  |
| +5 Volts monitor | 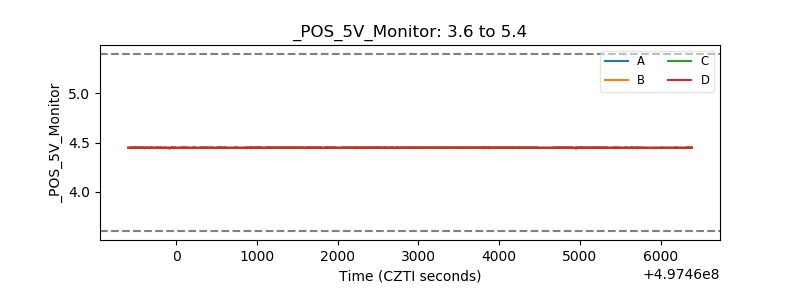 |
| _ROLL_ROT | 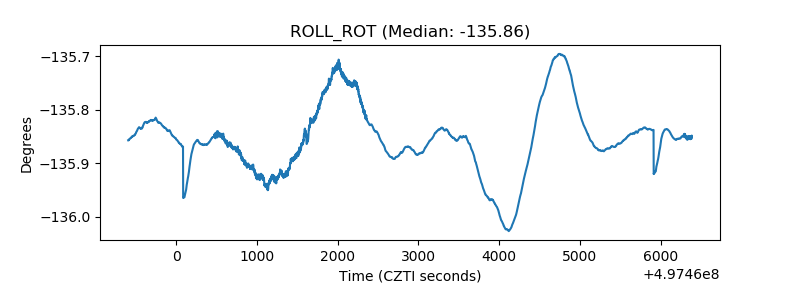 |
| _Roll_DEC | 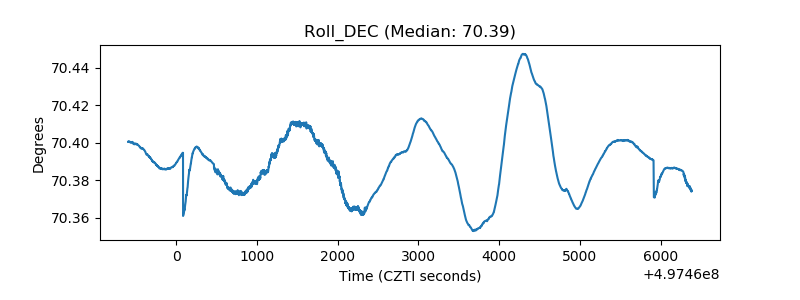 |
| _Roll_RA | 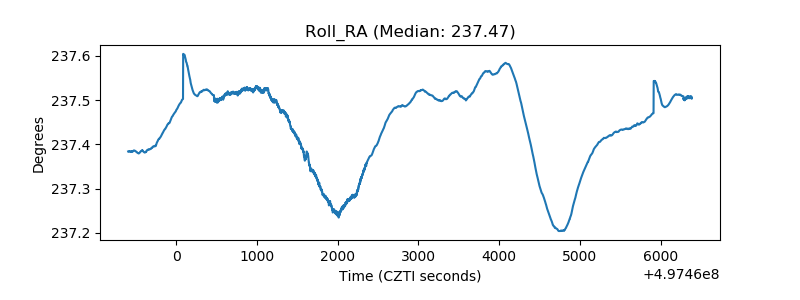 |
| Veto Counter | 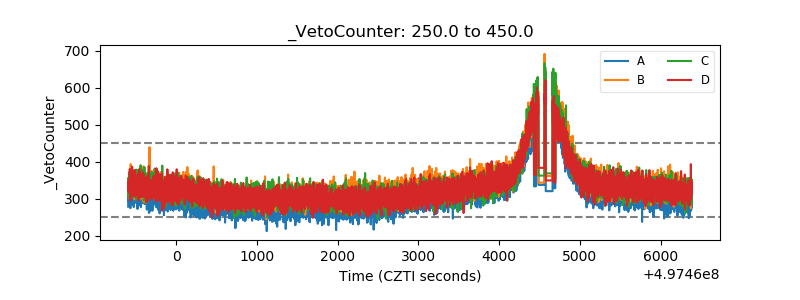 |