| Param | Original file | Final file |
|---|---|---|
| Filename | modeM0/AS1C09_004T08_9000006514_54230cztM0_level2.fits | modeM0/AS1C09_004T08_9000006514_54230cztM0_level2_quad_clean.evt |
| Size (bytes) | 963,495,360 | 89,274,240 |
| Size | 918.9 MB | 85.1 MB |
| Events in quadrant A | 8,222,384 | 582,490 |
| Events in quadrant B | 5,188,713 | 781,178 |
| Events in quadrant C | 5,297,052 | 658,830 |
| Events in quadrant D | 16,354,181 | 139,252 |
| Mode M0 | |||
|---|---|---|---|
| Quadrant | BADHDUFLAG | Total packets | Discarded packets |
| A | 0 | 30031 | 0 |
| B | 0 | 20892 | 0 |
| C | 0 | 21280 | 0 |
| D | 0 | 53958 | 4 |
| Mode SS | |||
|---|---|---|---|
| Quadrant | BADHDUFLAG | Total packets | Discarded packets |
| A | 0 | 156 | 0 |
| B | 0 | 156 | 0 |
| C | 0 | 156 | 0 |
| D | 0 | 156 | 0 |
| Quadrant | Total seconds | Saturated seconds | Saturation percentage |
|---|---|---|---|
| A | 7779 | 1772 | 22.779278% |
| B | 7779 | 317 | 4.075074% |
| C | 7780 | 476 | 6.118252% |
| D | 7779 | 6202 | 79.727471% |
Noise dominated data is calculated using 1-second bins in cleaned event files. If a bin has >2000 counts, and if more than 50% of those come from <1% of pixels, then it is considered to be noise-dominated and hence unusable.
| Quadrant | # 1 sec bins | Bins with >0 counts | Bins with >2000 counts | High rate bins dominated by noise | Noise dominated (total time) | Noise dominated (detector-on time) | Marked lightcurve |
|---|---|---|---|---|---|---|---|
| A | 7779 | 7779 | 1365 | 1365 | 17.55% | 17.55% | 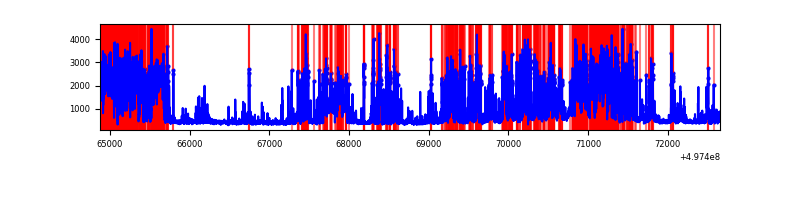 |
| B | 7779 | 7779 | 151 | 151 | 1.94% | 1.94% | 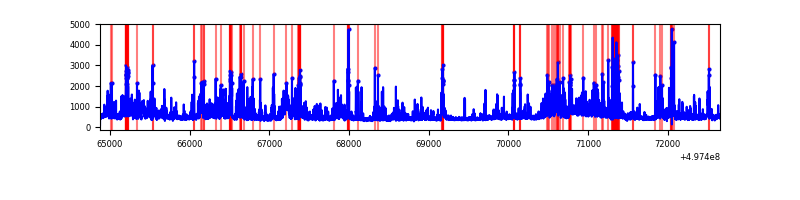 |
| C | 7780 | 7780 | 373 | 373 | 4.79% | 4.79% | 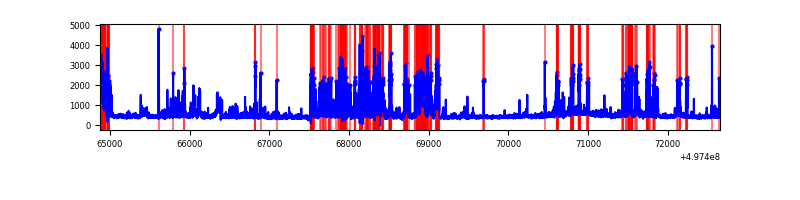 |
| D | 7779 | 7779 | 5002 | 5002 | 64.30% | 64.30% | 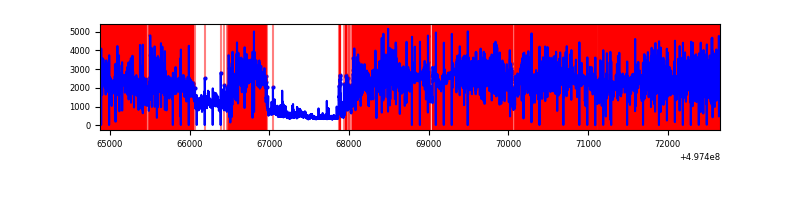 |
Top three noisy pixels from each quadrant. If the there are fewer than three noisy pixels in the level2.evt file, extra rows are filled as -1
| Pixel properties | Quadrant properties | ||||||
|---|---|---|---|---|---|---|---|
| Quadrant | DetID | PixID | Counts | Sigma | Mean | Median | Sigma |
| A | 12 | 17 | 3173155 | 17912.17 | 711 | 693 | 177.1 |
| A | 5 | 243 | 824557 | 4651.65 | 711 | 693 | 177.1 |
| A | 12 | 194 | 401695 | 2264.11 | 711 | 693 | 177.1 |
| B | 4 | 171 | 809747 | 4771.3 | 800 | 774 | 169.5 |
| B | 5 | 236 | 461610 | 2718.0 | 800 | 774 | 169.5 |
| B | 10 | 247 | 224285 | 1318.26 | 800 | 774 | 169.5 |
| C | 15 | 215 | 914528 | 4316.28 | 773 | 764 | 211.7 |
| C | 1 | 241 | 407639 | 1921.92 | 773 | 764 | 211.7 |
| C | 15 | 216 | 286795 | 1351.1 | 773 | 764 | 211.7 |
| D | 8 | 176 | 14652633 | 173761.16 | 290 | 276 | 84.3 |
| D | 2 | 172 | 123714 | 1463.84 | 290 | 276 | 84.3 |
| D | 3 | 12 | 88315 | 1044.05 | 290 | 276 | 84.3 |
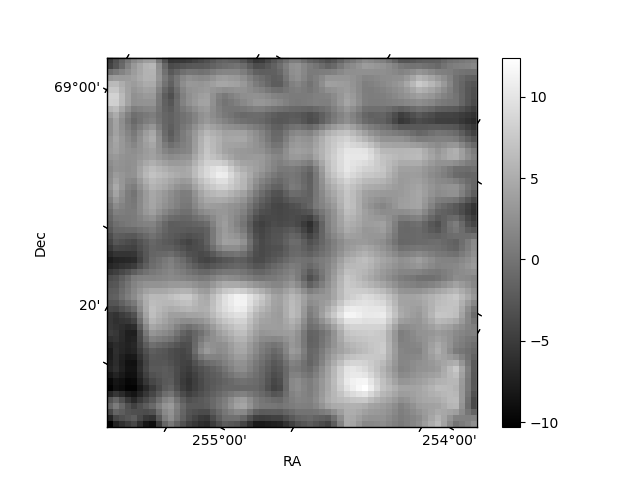
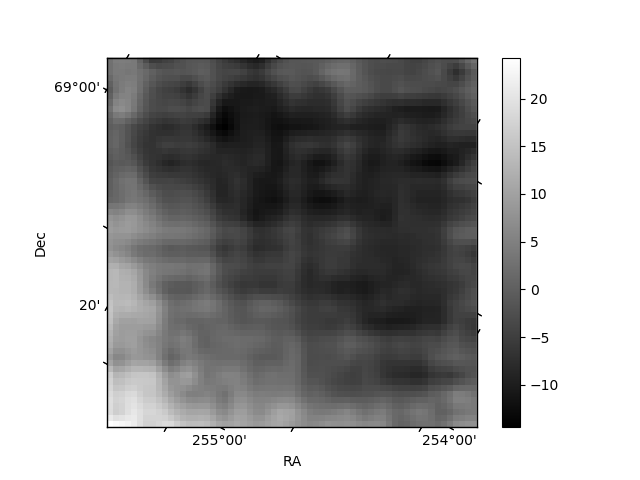
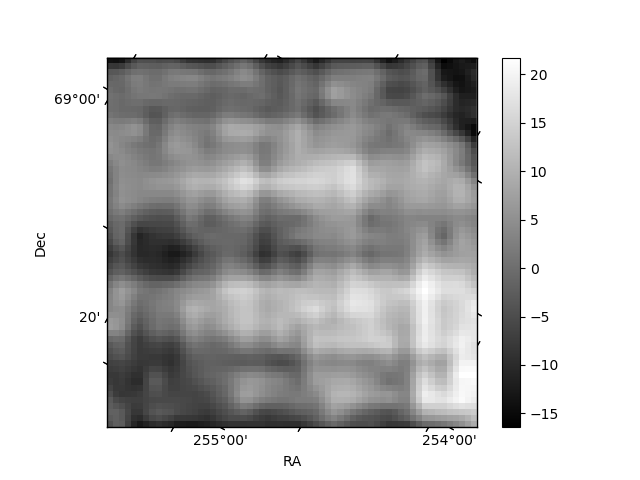
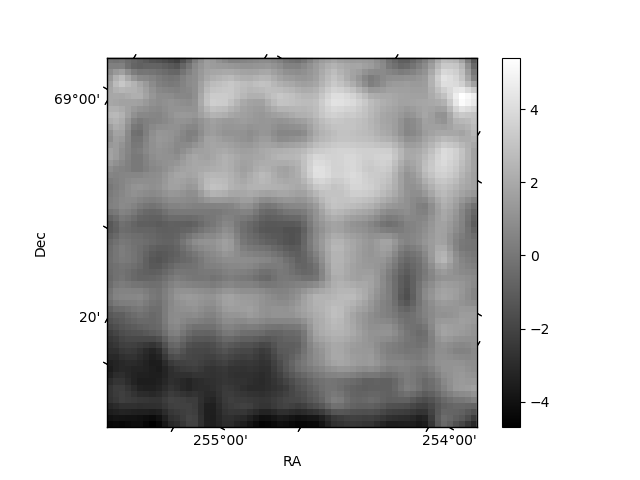
Histogram calculated using DETX and DETY for each event in the final _common_clean file
| Quadrant A | 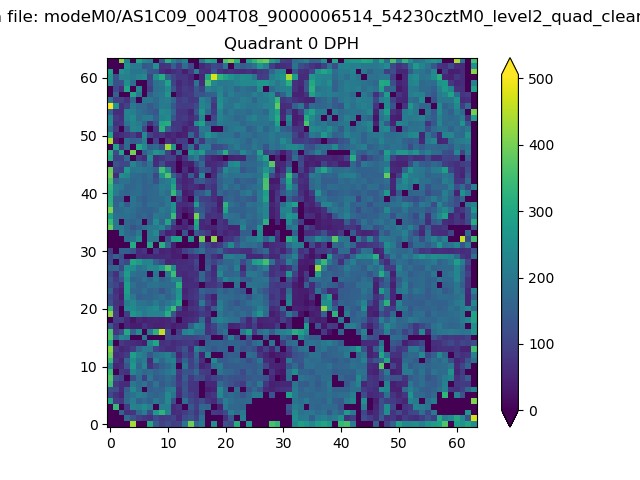 |
 |
Quadrant B |
|---|---|---|---|
| Quadrant D | 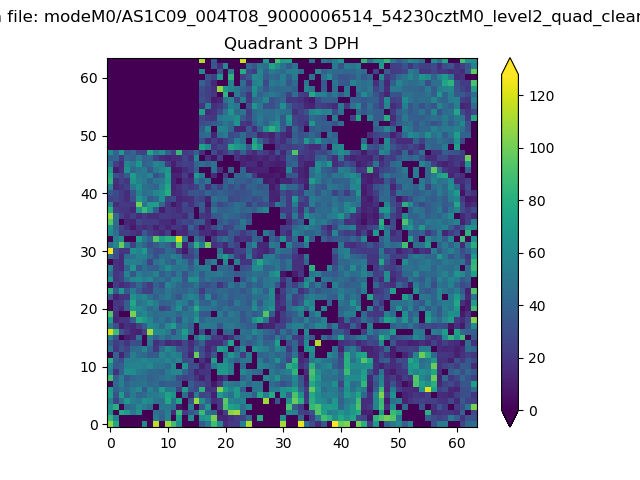 |
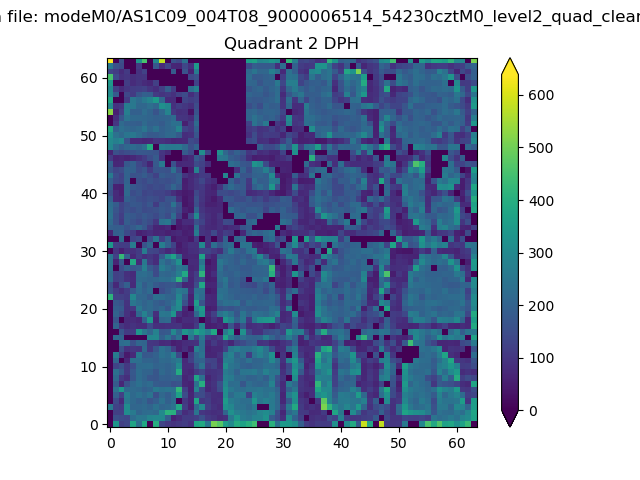 |
Quadrant C |
| Plot type | Count rate plots | Images |
|---|---|---|
| Comparison with Poisson distribution Blue bars denote a histogram of data divided into 1 sec bins. Red curve is a Poisson curve with rate = median count rate of data. |
 |
 |
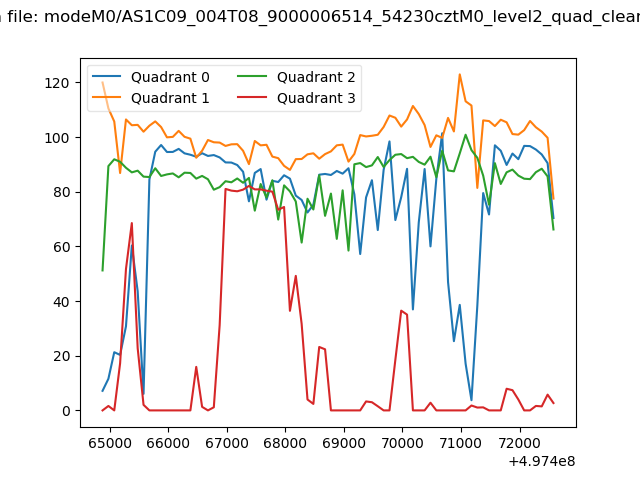
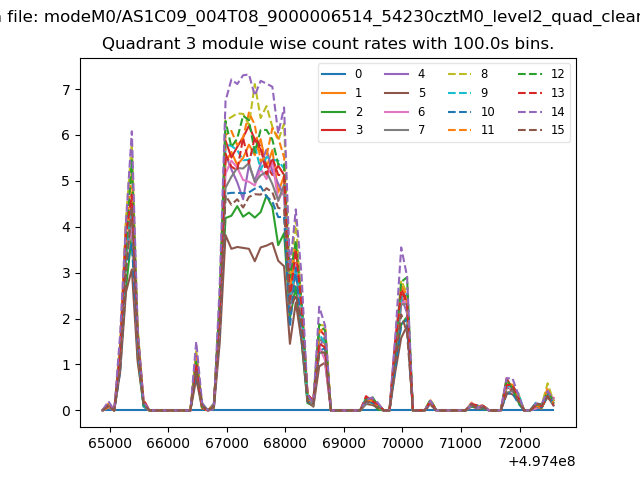
| Quadrant-wise count rates Data is divided into 100 sec bins |
 |
|
| Module-wise count rates for Quadrant A Data is divided into 100 sec bins |
 |
 |
| Module-wise count rates for Quadrant B Data is divided into 100 sec bins |
 |
 |
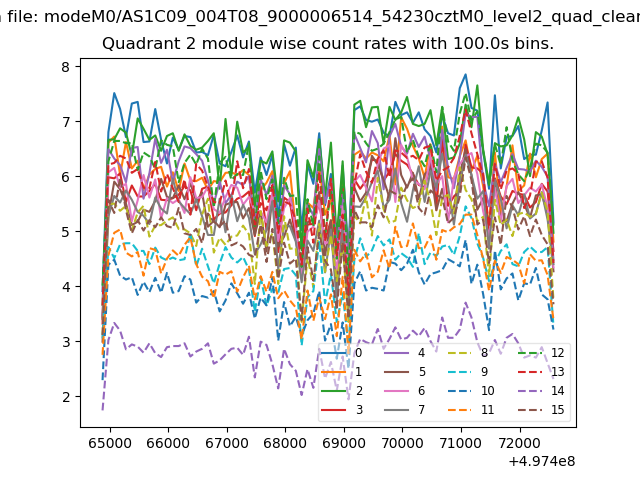
| Module-wise count rates for Quadrant C Data is divided into 100 sec bins |
 |
 |
| Module-wise count rates for Quadrant D Data is divided into 100 sec bins |
 |
 |
| Parameter | Plot |
|---|---|
| CZT HV Monitor | 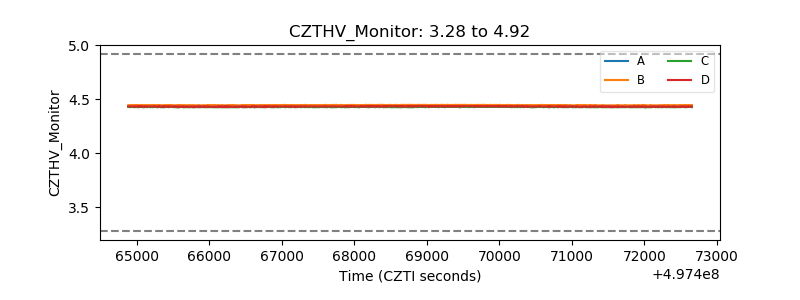 |
| D_VDD | 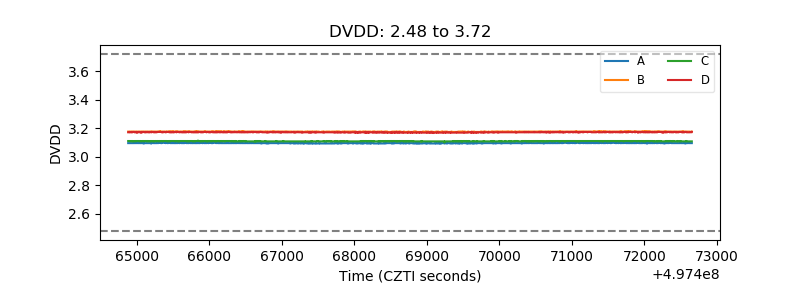 |
| Temperature 1 | 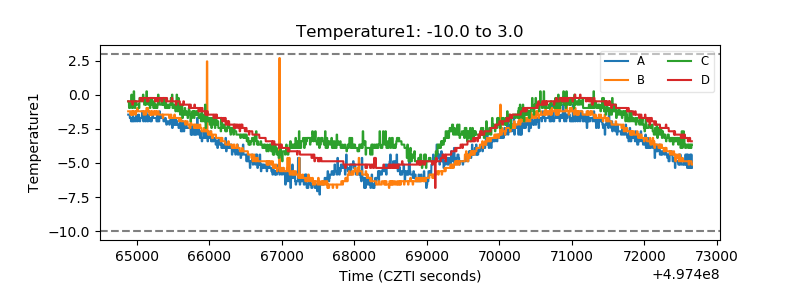 |
| Veto HV Monitor | 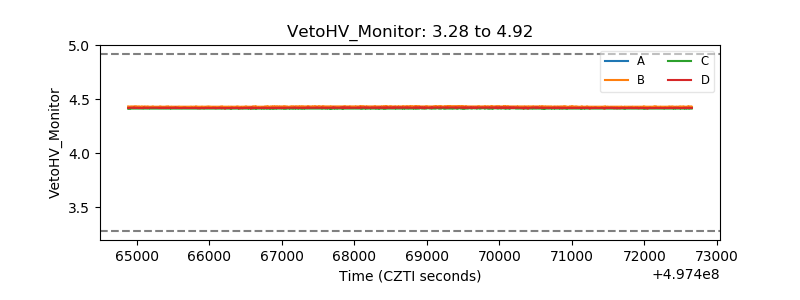 |
| Veto LLD | 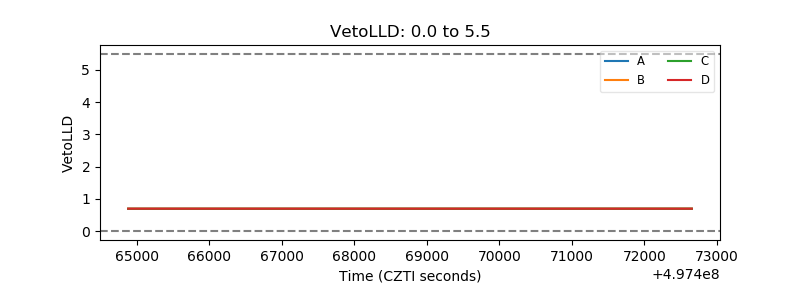 |
| Alpha Counter | 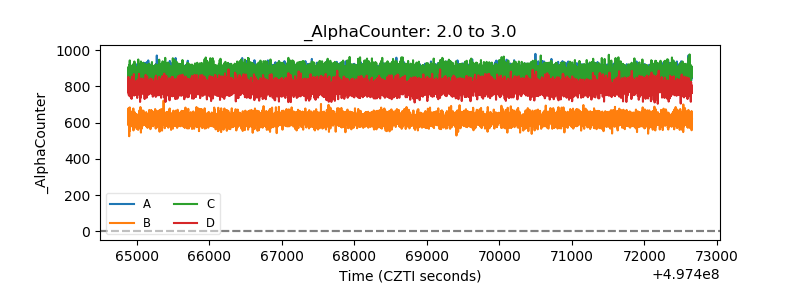 |
| _CPM_Rate |  |
| CZT Counter | 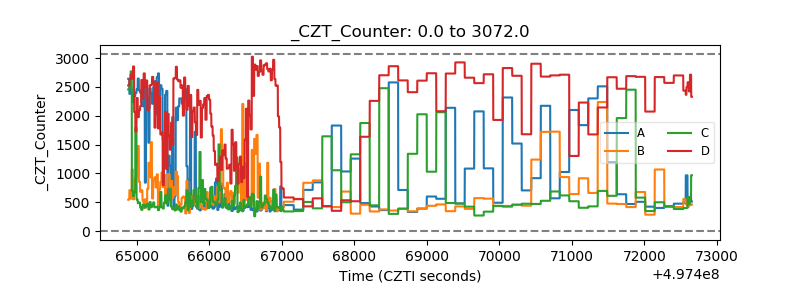 |
| +2.5 Volts monitor | 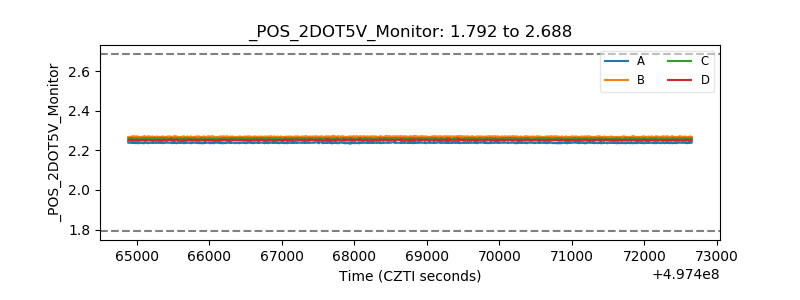 |
| +5 Volts monitor | 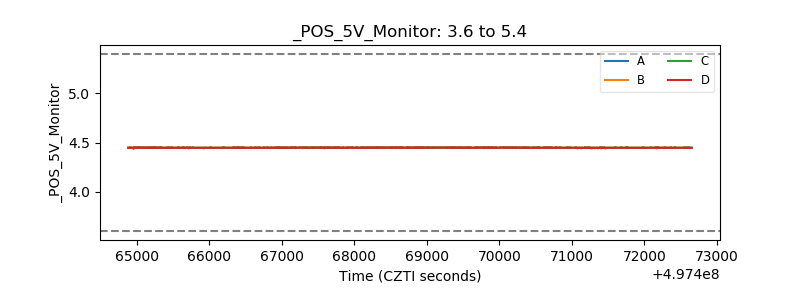 |
| _ROLL_ROT | 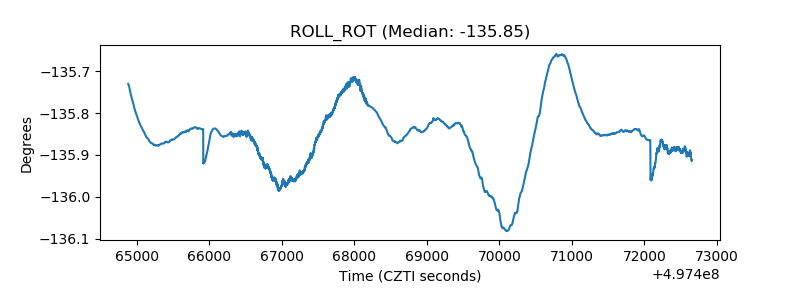 |
| _Roll_DEC | 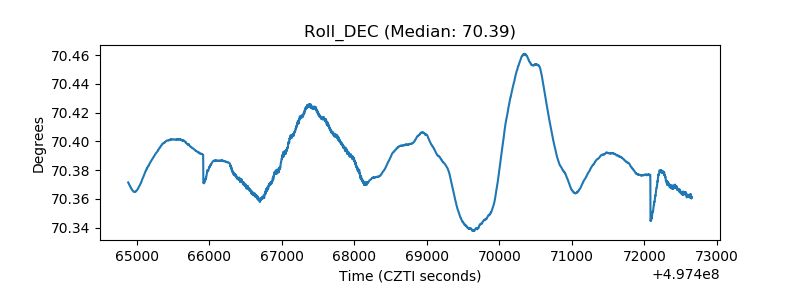 |
| _Roll_RA | 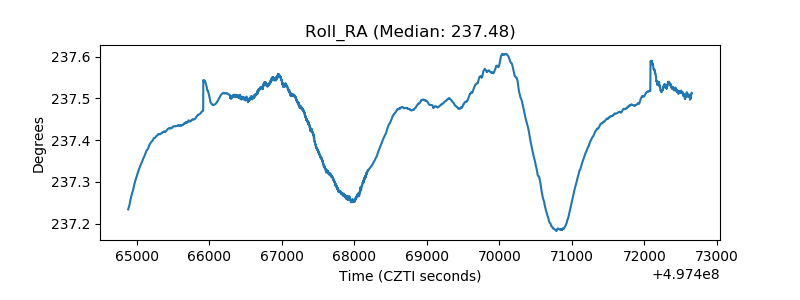 |
| Veto Counter | 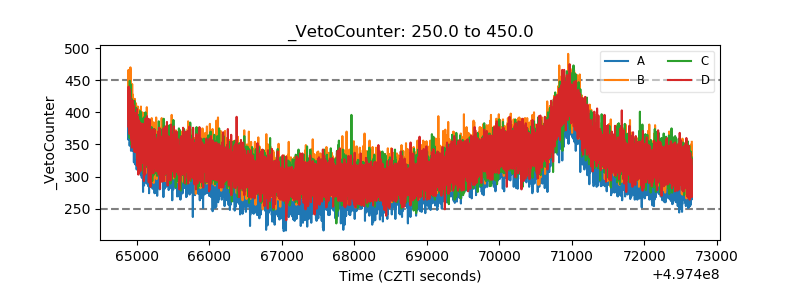 |