| Param | Original file | Final file |
|---|---|---|
| Filename | modeM0/AS1C09_004T08_9000006514_54231cztM0_level2.fits | modeM0/AS1C09_004T08_9000006514_54231cztM0_level2_quad_clean.evt |
| Size (bytes) | 1,213,067,520 | 79,104,960 |
| Size | 1.1 GB | 75.4 MB |
| Events in quadrant A | 7,239,267 | 648,482 |
| Events in quadrant B | 5,183,674 | 785,849 |
| Events in quadrant C | 11,879,517 | 390,231 |
| Events in quadrant D | 19,994,952 | 24,560 |
| Mode M0 | |||
|---|---|---|---|
| Quadrant | BADHDUFLAG | Total packets | Discarded packets |
| A | 0 | 26973 | 0 |
| B | 0 | 20753 | 0 |
| C | 0 | 40687 | 0 |
| D | 0 | 64758 | 5 |
| Mode SS | |||
|---|---|---|---|
| Quadrant | BADHDUFLAG | Total packets | Discarded packets |
| A | 0 | 156 | 0 |
| B | 0 | 156 | 0 |
| C | 0 | 156 | 0 |
| D | 0 | 156 | 0 |
| Quadrant | Total seconds | Saturated seconds | Saturation percentage |
|---|---|---|---|
| A | 7848 | 1135 | 14.462283% |
| B | 7848 | 278 | 3.542304% |
| C | 7849 | 3693 | 47.050580% |
| D | 7848 | 7610 | 96.967380% |
Noise dominated data is calculated using 1-second bins in cleaned event files. If a bin has >2000 counts, and if more than 50% of those come from <1% of pixels, then it is considered to be noise-dominated and hence unusable.
| Quadrant | # 1 sec bins | Bins with >0 counts | Bins with >2000 counts | High rate bins dominated by noise | Noise dominated (total time) | Noise dominated (detector-on time) | Marked lightcurve |
|---|---|---|---|---|---|---|---|
| A | 7848 | 7848 | 871 | 871 | 11.10% | 11.10% | 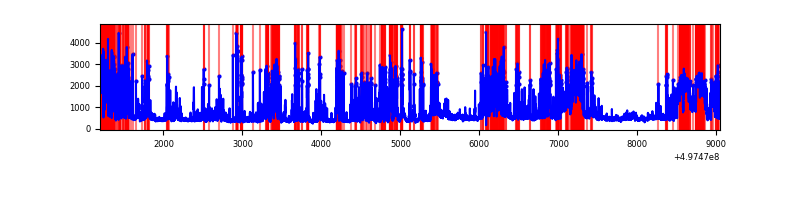 |
| B | 7848 | 7848 | 149 | 149 | 1.90% | 1.90% | 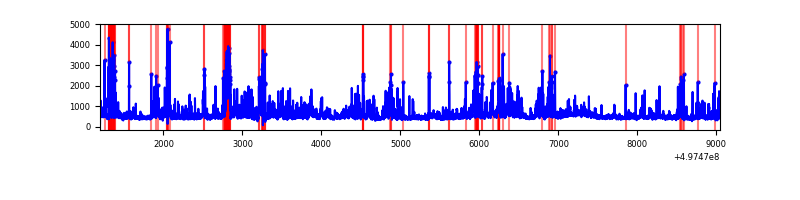 |
| C | 7849 | 7846 | 2698 | 2698 | 34.37% | 34.39% | 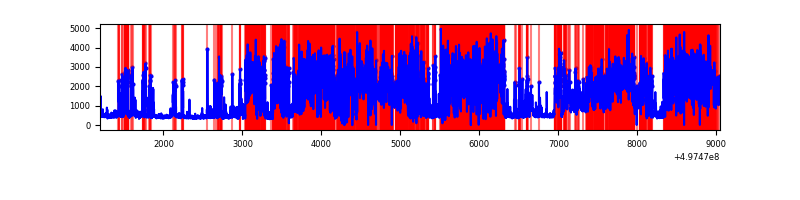 |
| D | 7848 | 7848 | 6946 | 6946 | 88.51% | 88.51% | 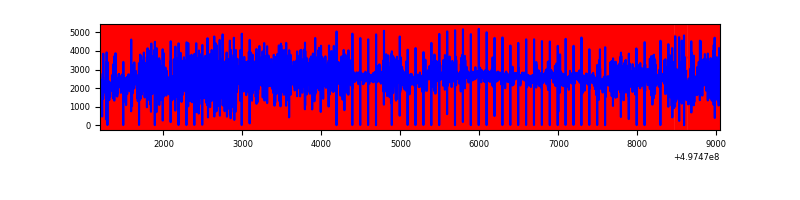 |
Top three noisy pixels from each quadrant. If the there are fewer than three noisy pixels in the level2.evt file, extra rows are filled as -1
| Pixel properties | Quadrant properties | ||||||
|---|---|---|---|---|---|---|---|
| Quadrant | DetID | PixID | Counts | Sigma | Mean | Median | Sigma |
| A | 12 | 17 | 1893476 | 9993.32 | 766 | 747 | 189.4 |
| A | 7 | 14 | 644210 | 3397.39 | 766 | 747 | 189.4 |
| A | 7 | 29 | 441212 | 2325.59 | 766 | 747 | 189.4 |
| B | 5 | 236 | 527328 | 3068.67 | 806 | 779 | 171.6 |
| B | 4 | 171 | 465623 | 2709.06 | 806 | 779 | 171.6 |
| B | 5 | 185 | 307753 | 1789.01 | 806 | 779 | 171.6 |
| C | 15 | 215 | 7236065 | 45450.6 | 581 | 576 | 159.2 |
| C | 15 | 216 | 1408603 | 8844.69 | 581 | 576 | 159.2 |
| C | 1 | 241 | 373996 | 2345.68 | 581 | 576 | 159.2 |
| D | 8 | 176 | 18895242 | 384540.64 | 166 | 158 | 49.1 |
| D | 3 | 12 | 240865 | 4898.71 | 166 | 158 | 49.1 |
| D | 6 | 239 | 44220 | 896.72 | 166 | 158 | 49.1 |
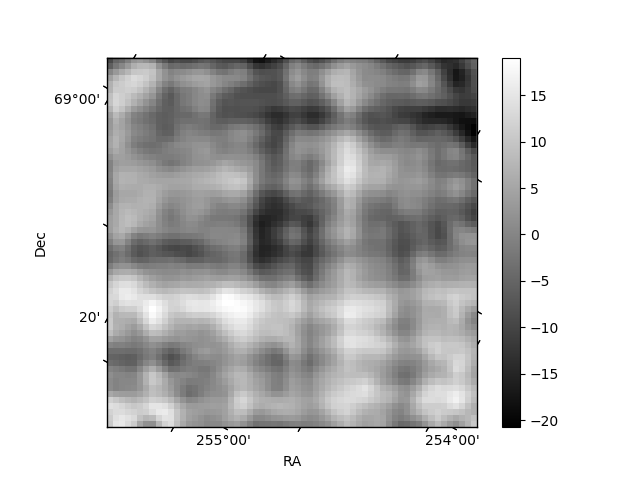
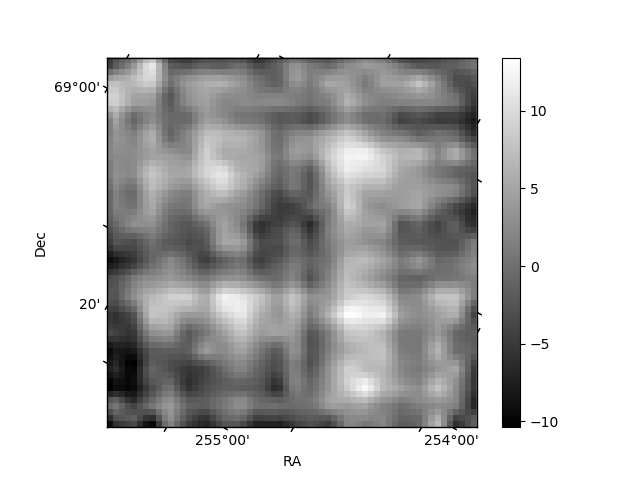
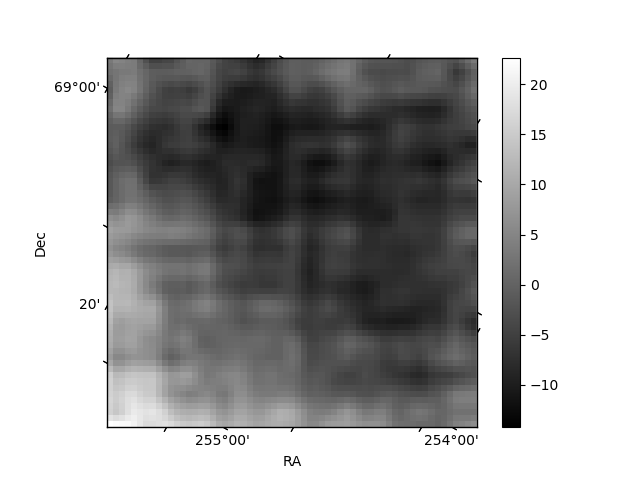
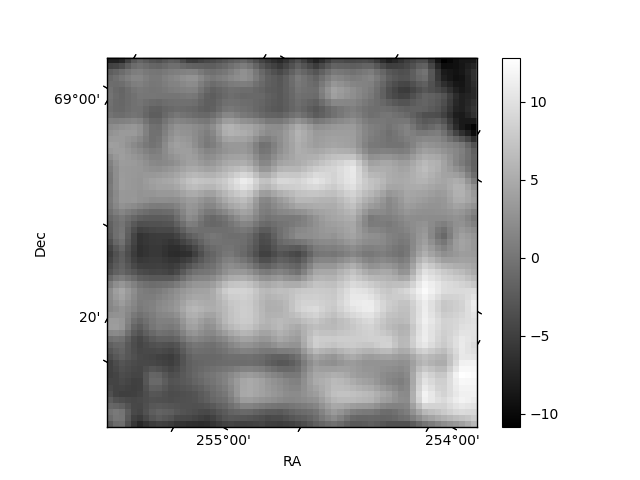
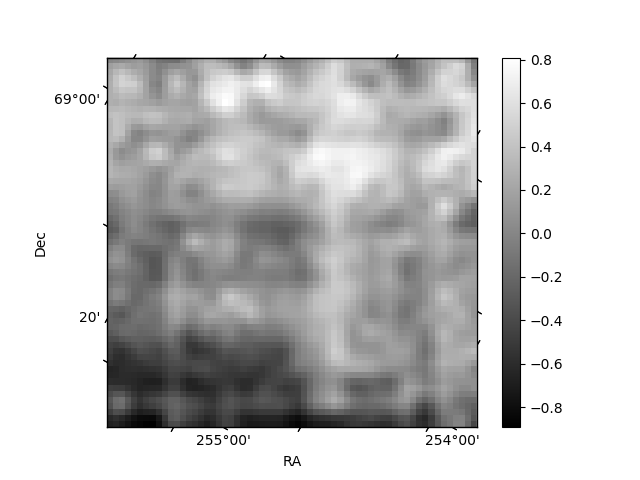
Histogram calculated using DETX and DETY for each event in the final _common_clean file
| Quadrant A | 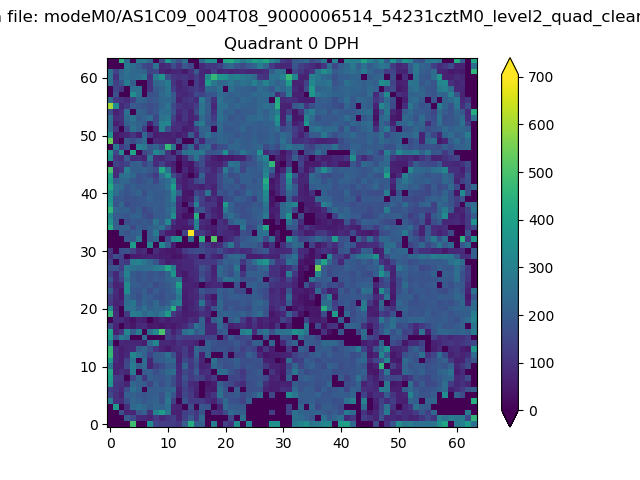 |
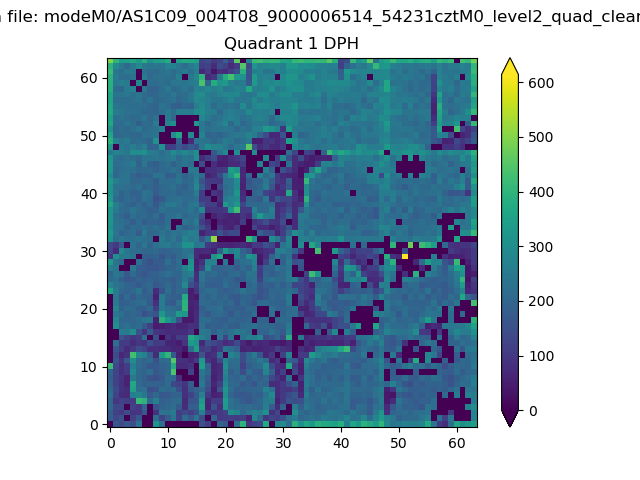 |
Quadrant B |
|---|---|---|---|
| Quadrant D | 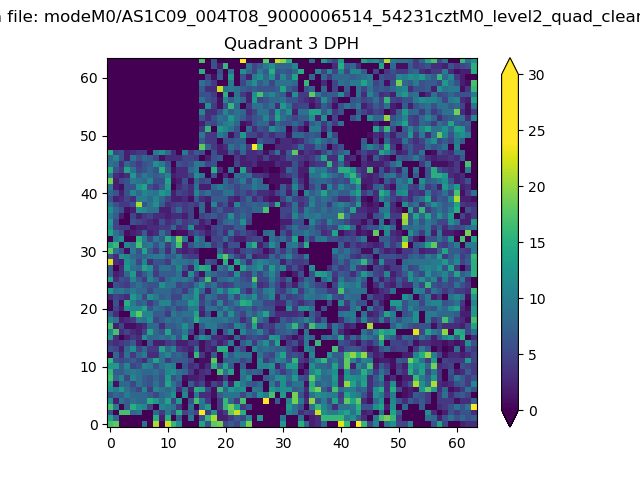 |
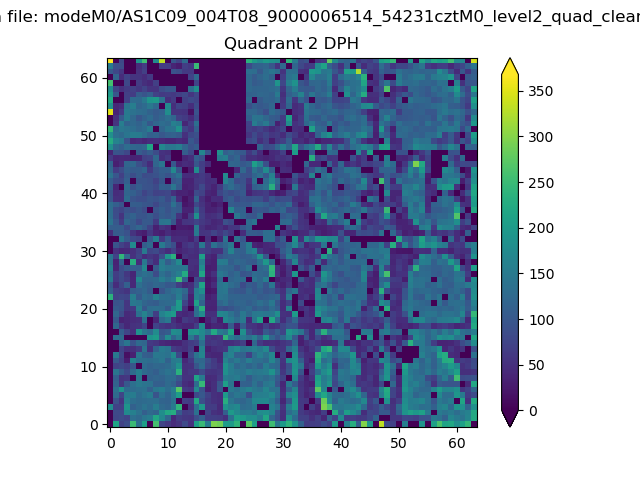 |
Quadrant C |
| Plot type | Count rate plots | Images |
|---|---|---|
| Comparison with Poisson distribution Blue bars denote a histogram of data divided into 1 sec bins. Red curve is a Poisson curve with rate = median count rate of data. |
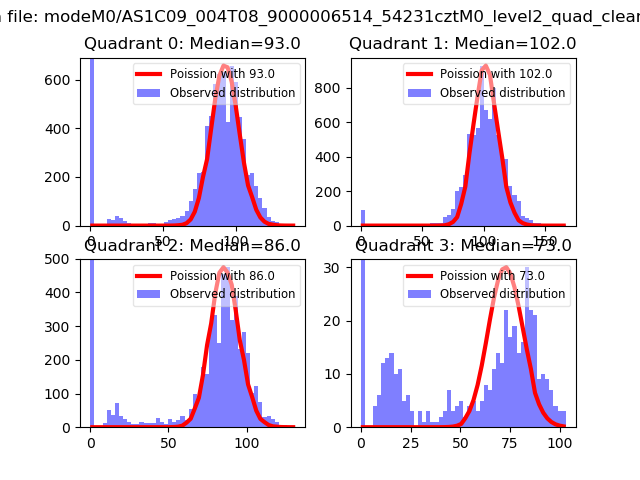 |
 |
| Quadrant-wise count rates Data is divided into 100 sec bins |
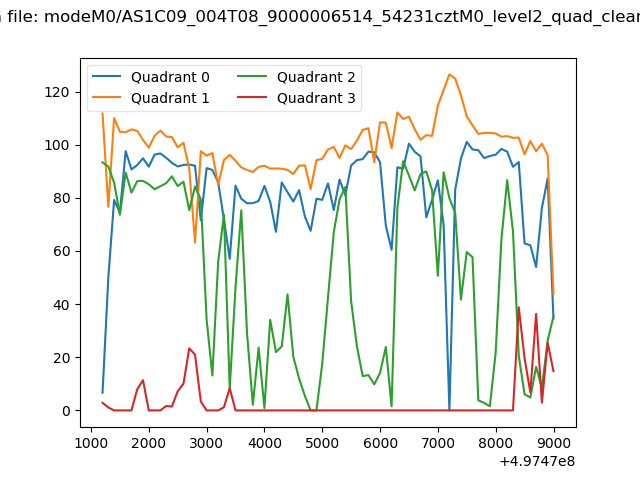 |
|
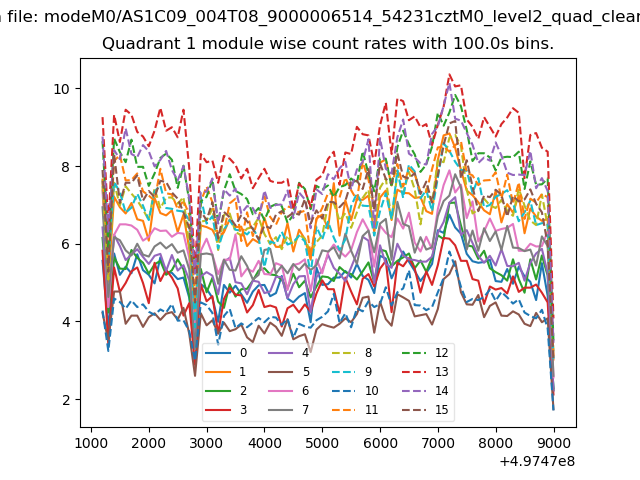
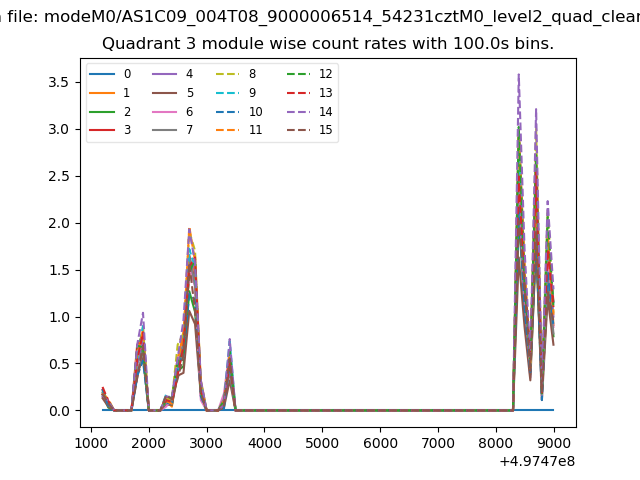
| Module-wise count rates for Quadrant A Data is divided into 100 sec bins |
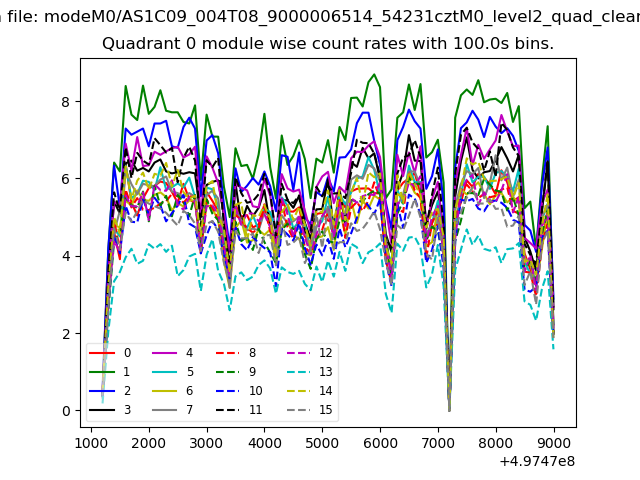 |
 |
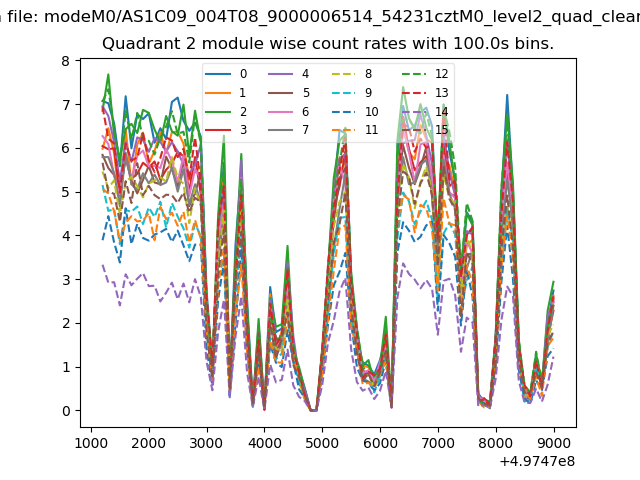
| Module-wise count rates for Quadrant B Data is divided into 100 sec bins |
 |
 |
| Module-wise count rates for Quadrant C Data is divided into 100 sec bins |
 |
 |
| Module-wise count rates for Quadrant D Data is divided into 100 sec bins |
 |
 |
| Parameter | Plot |
|---|---|
| CZT HV Monitor |  |
| D_VDD | 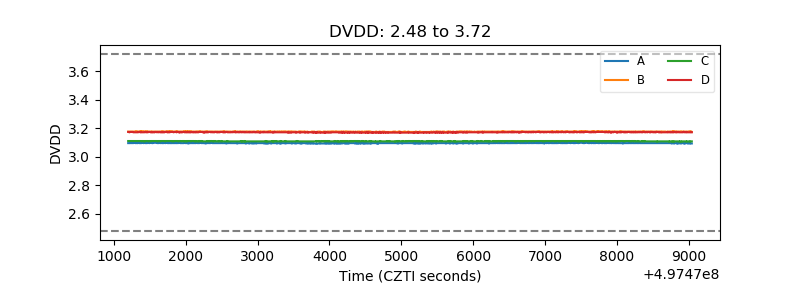 |
| Temperature 1 | 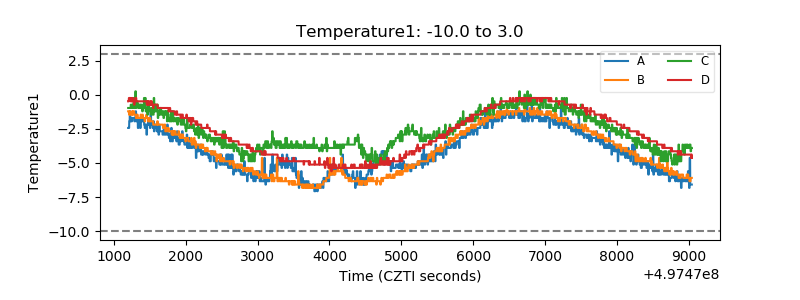 |
| Veto HV Monitor | 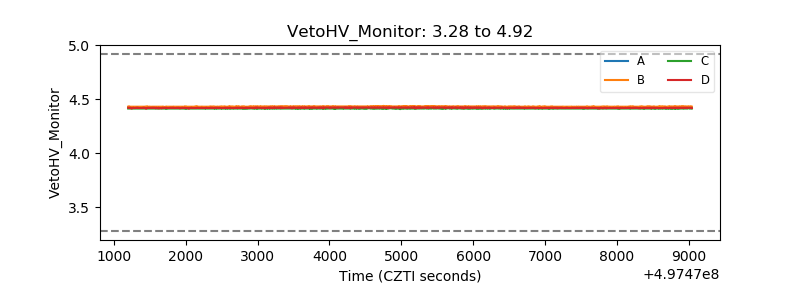 |
| Veto LLD | 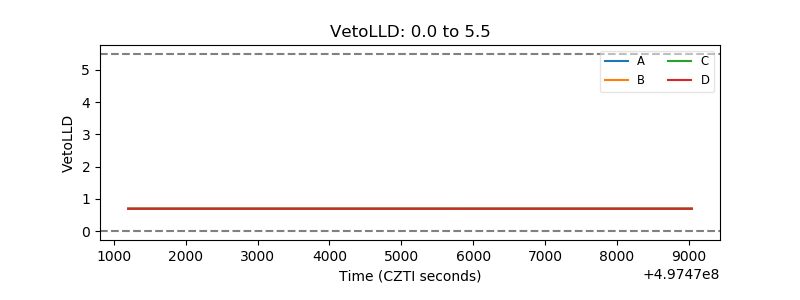 |
| Alpha Counter | 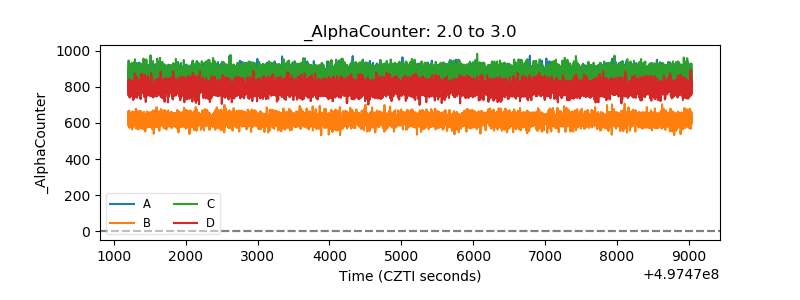 |
| _CPM_Rate | 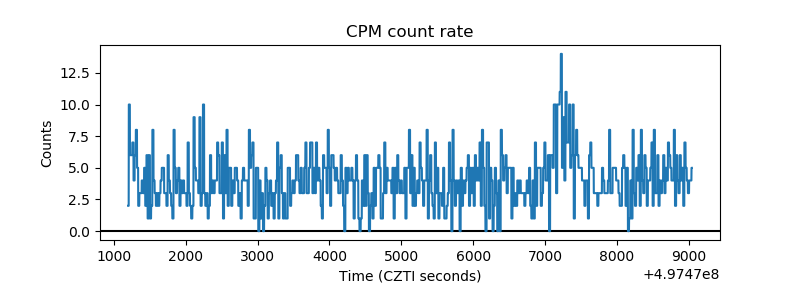 |
| CZT Counter | 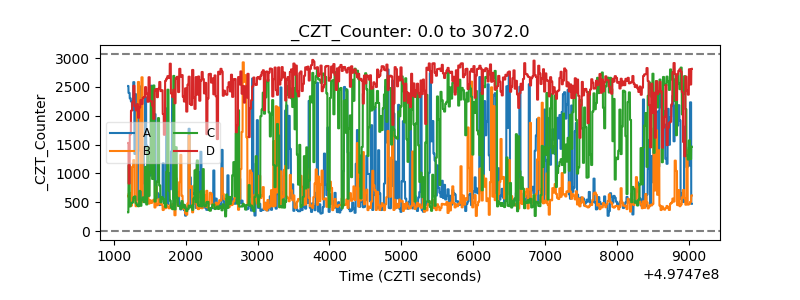 |
| +2.5 Volts monitor |  |
| +5 Volts monitor |  |
| _ROLL_ROT | 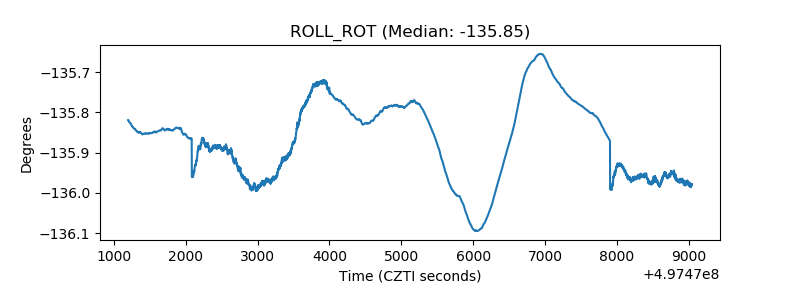 |
| _Roll_DEC | 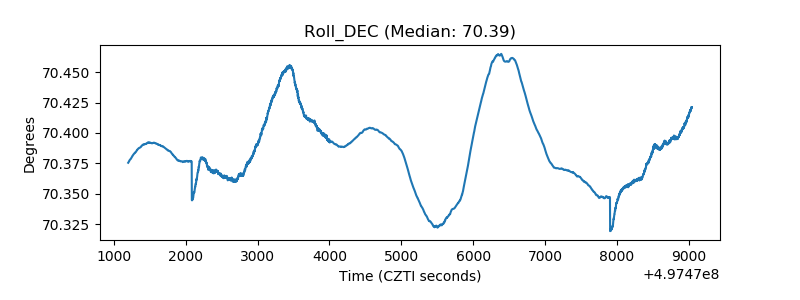 |
| _Roll_RA | 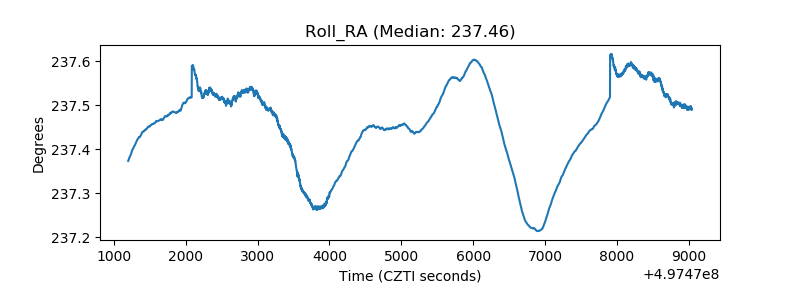 |
| Veto Counter | 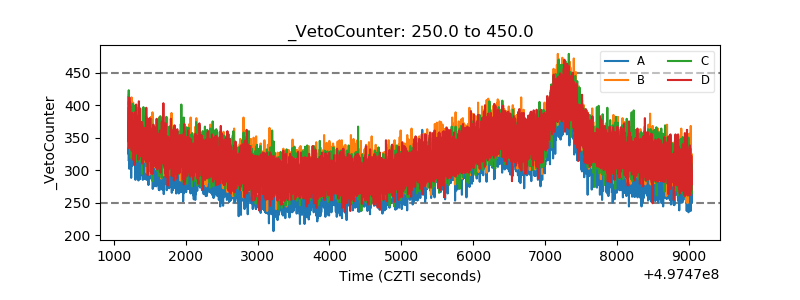 |