| Param | Original file | Final file |
|---|---|---|
| Filename | modeM0/AS1C09_004T08_9000006514_54234cztM0_level2.fits | modeM0/AS1C09_004T08_9000006514_54234cztM0_level2_quad_clean.evt |
| Size (bytes) | 2,674,480,320 | 195,981,120 |
| Size | 2.5 GB | 186.9 MB |
| Events in quadrant A | 20,073,484 | 1,326,543 |
| Events in quadrant B | 11,813,000 | 1,831,627 |
| Events in quadrant C | 18,679,410 | 1,313,629 |
| Events in quadrant D | 46,981,370 | 161,193 |
| Mode M0 | |||
|---|---|---|---|
| Quadrant | BADHDUFLAG | Total packets | Discarded packets |
| A | 0 | 72786 | 3 |
| B | 0 | 48589 | 3 |
| C | 0 | 69072 | 3 |
| D | 0 | 152185 | 3 |
| Mode M9 | |||
|---|---|---|---|
| Quadrant | BADHDUFLAG | Total packets | Discarded packets |
| A | 0 | 11 | 0 |
| B | 0 | 11 | 0 |
| C | 0 | 11 | 0 |
| D | 0 | 11 | 0 |
| Mode SS | |||
|---|---|---|---|
| Quadrant | BADHDUFLAG | Total packets | Discarded packets |
| A | 0 | 382 | 0 |
| B | 0 | 382 | 0 |
| C | 0 | 382 | 0 |
| D | 0 | 382 | 0 |
| Quadrant | Total seconds | Saturated seconds | Saturation percentage |
|---|---|---|---|
| A | 18853 | 4122 | 21.863894% |
| B | 18854 | 721 | 3.824122% |
| C | 18854 | 3873 | 20.542060% |
| D | 18854 | 17147 | 90.946218% |
Noise dominated data is calculated using 1-second bins in cleaned event files. If a bin has >2000 counts, and if more than 50% of those come from <1% of pixels, then it is considered to be noise-dominated and hence unusable.
| Quadrant | # 1 sec bins | Bins with >0 counts | Bins with >2000 counts | High rate bins dominated by noise | Noise dominated (total time) | Noise dominated (detector-on time) | Marked lightcurve |
|---|---|---|---|---|---|---|---|
| A | 20003 | 18856 | 3106 | 3106 | 15.53% | 16.47% | 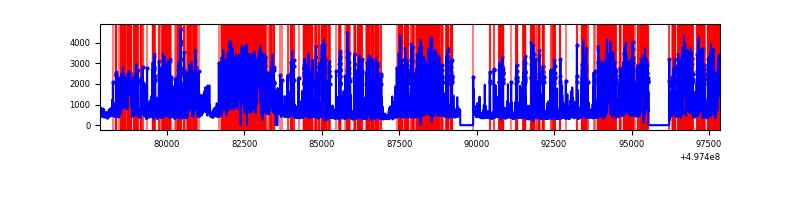 |
| B | 20004 | 18857 | 363 | 363 | 1.81% | 1.93% | 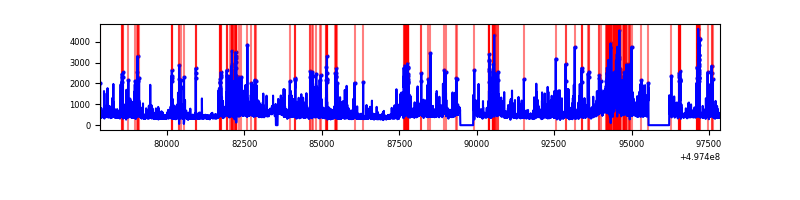 |
| C | 20004 | 18856 | 2995 | 2995 | 14.97% | 15.88% | 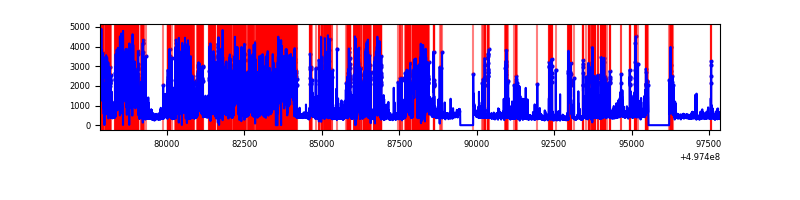 |
| D | 20003 | 18854 | 15970 | 15970 | 79.84% | 84.70% | 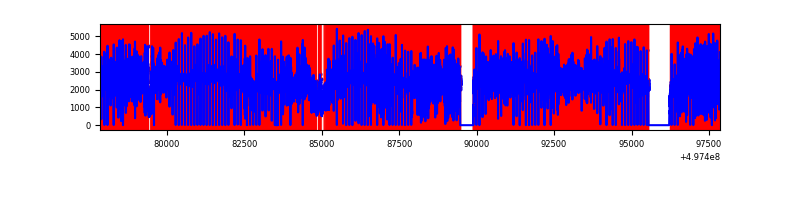 |
Top three noisy pixels from each quadrant. If the there are fewer than three noisy pixels in the level2.evt file, extra rows are filled as -1
| Pixel properties | Quadrant properties | ||||||
|---|---|---|---|---|---|---|---|
| Quadrant | DetID | PixID | Counts | Sigma | Mean | Median | Sigma |
| A | 12 | 17 | 4994333 | 11583.94 | 1754 | 1715 | 431.0 |
| A | 7 | 29 | 3143917 | 7290.58 | 1754 | 1715 | 431.0 |
| A | 8 | 249 | 1012944 | 2346.27 | 1754 | 1715 | 431.0 |
| B | 4 | 171 | 769205 | 1878.42 | 1938 | 1870 | 408.5 |
| B | 5 | 236 | 704362 | 1719.69 | 1938 | 1870 | 408.5 |
| B | 8 | 234 | 694946 | 1696.64 | 1938 | 1870 | 408.5 |
| C | 15 | 215 | 7381915 | 15738.94 | 1703 | 1687 | 468.9 |
| C | 1 | 241 | 1924592 | 4100.75 | 1703 | 1687 | 468.9 |
| C | 15 | 216 | 1558426 | 3319.87 | 1703 | 1687 | 468.9 |
| D | 8 | 176 | 43040927 | 236329.82 | 635 | 606 | 182.1 |
| D | 3 | 12 | 449334 | 2463.92 | 635 | 606 | 182.1 |
| D | 12 | 2 | 230529 | 1262.48 | 635 | 606 | 182.1 |
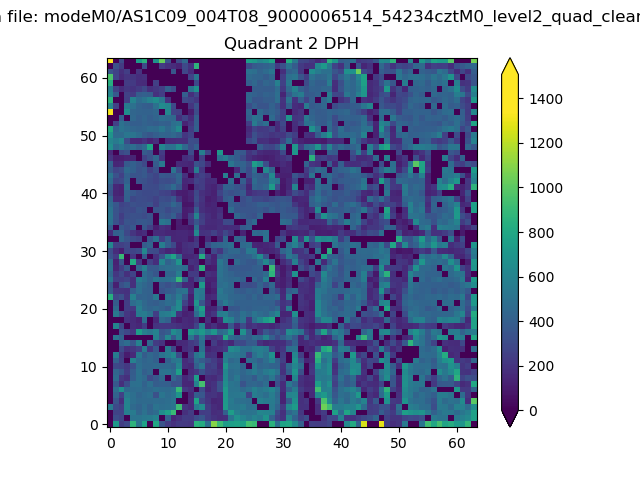
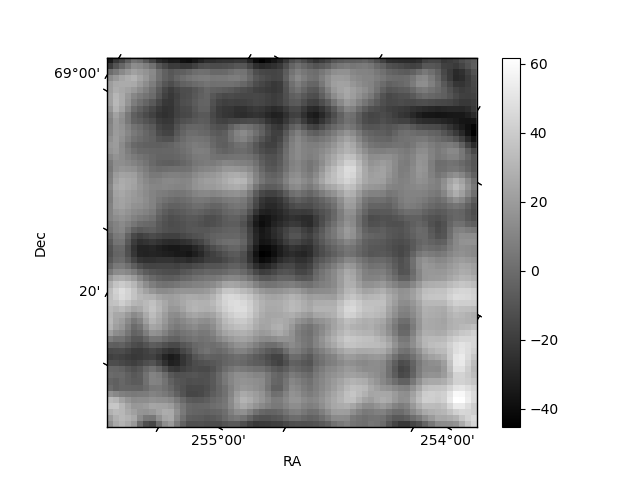
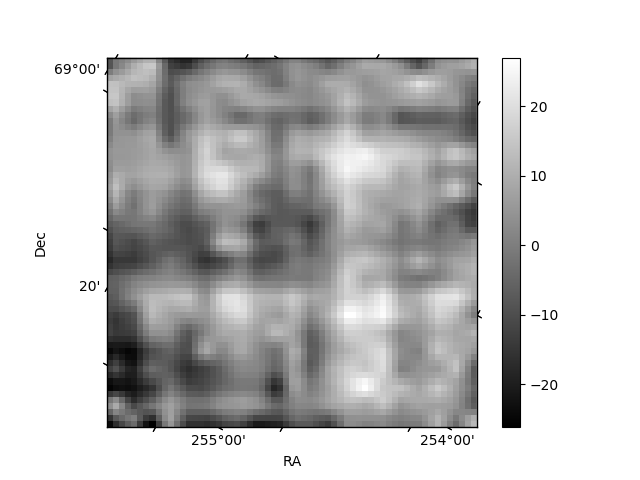
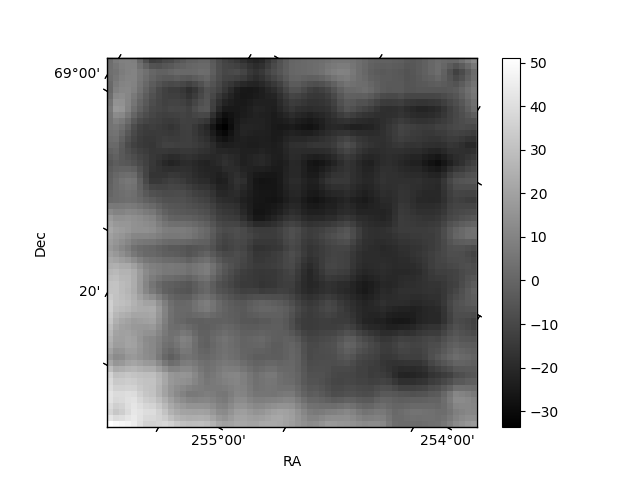
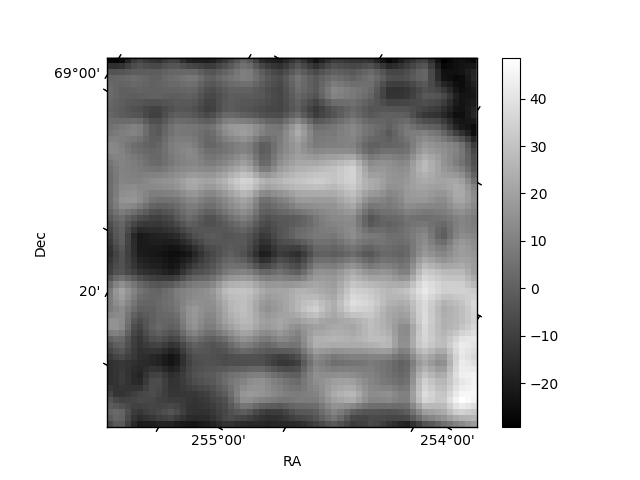
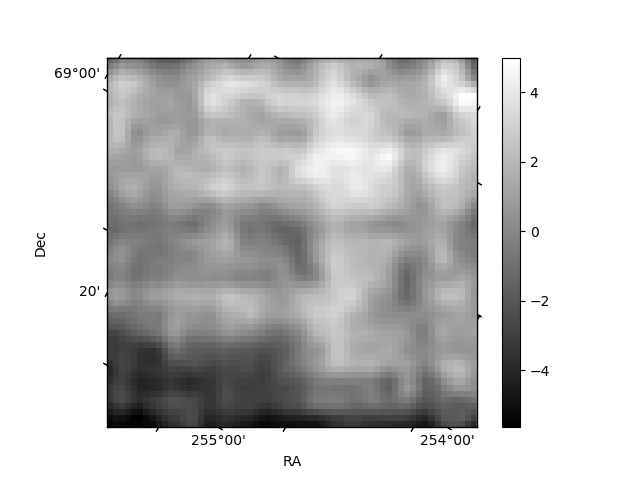
Histogram calculated using DETX and DETY for each event in the final _common_clean file
| Quadrant A | 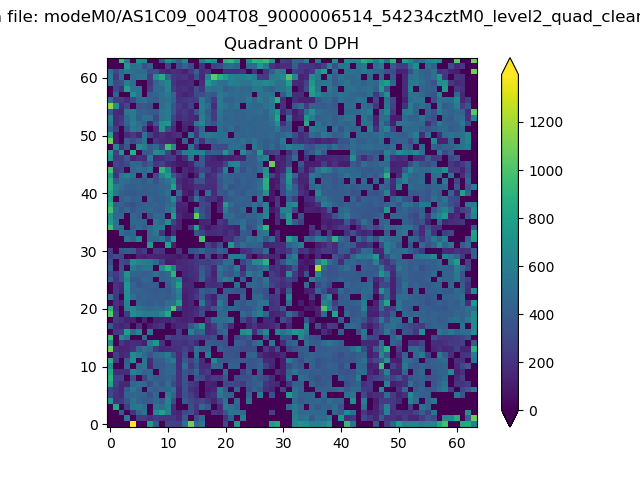 |
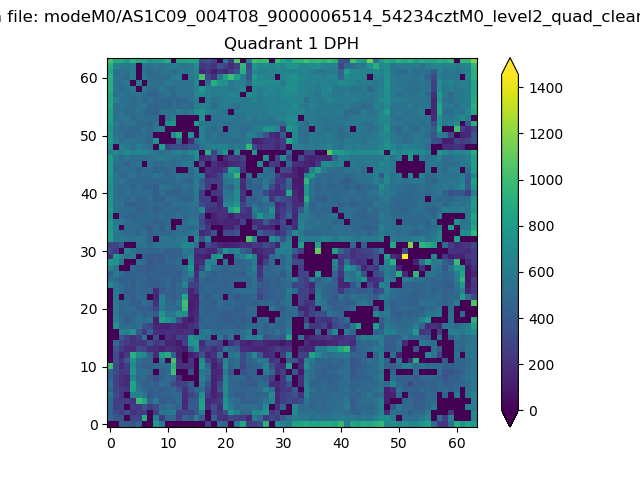 |
Quadrant B |
|---|---|---|---|
| Quadrant D | 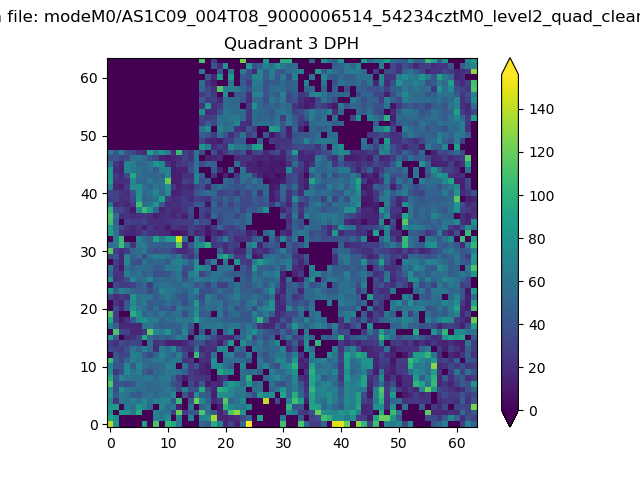 |
 |
Quadrant C |
| Plot type | Count rate plots | Images |
|---|---|---|
| Comparison with Poisson distribution Blue bars denote a histogram of data divided into 1 sec bins. Red curve is a Poisson curve with rate = median count rate of data. |
 |
 |
| Quadrant-wise count rates Data is divided into 100 sec bins |
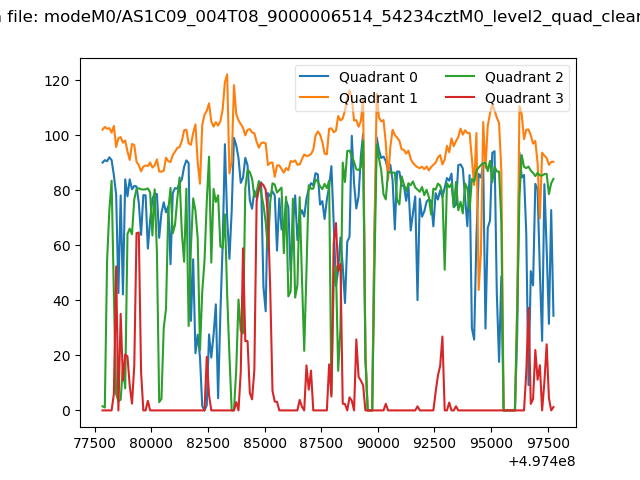 |
|
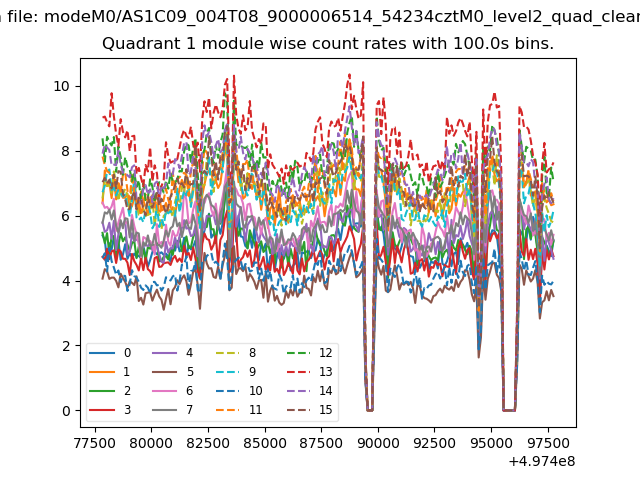
| Module-wise count rates for Quadrant A Data is divided into 100 sec bins |
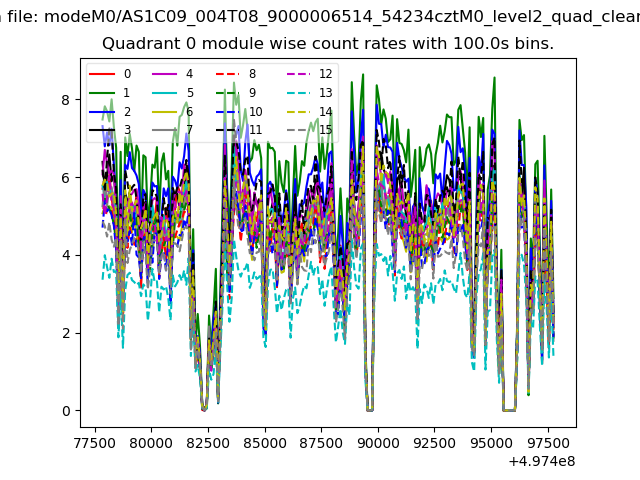 |
 |
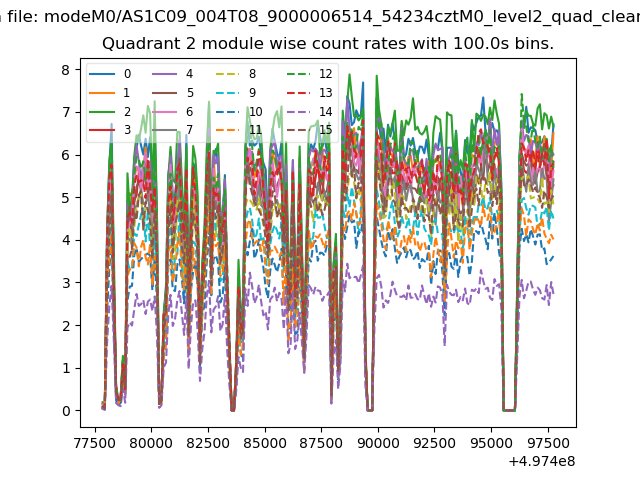
| Module-wise count rates for Quadrant B Data is divided into 100 sec bins |
 |
 |
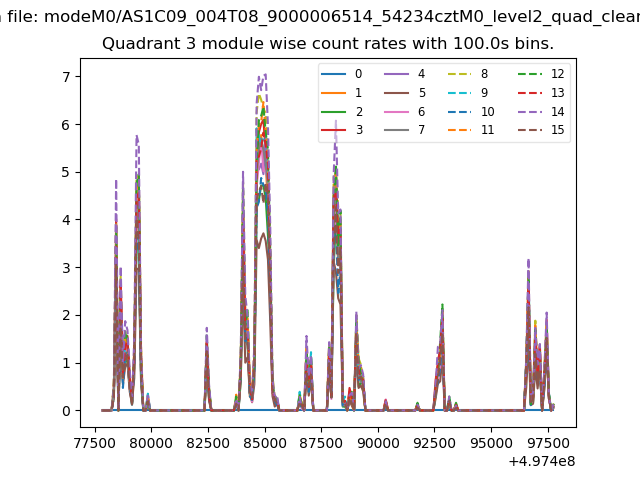
| Module-wise count rates for Quadrant C Data is divided into 100 sec bins |
 |
 |
| Module-wise count rates for Quadrant D Data is divided into 100 sec bins |
 |
 |
| Parameter | Plot |
|---|---|
| CZT HV Monitor | 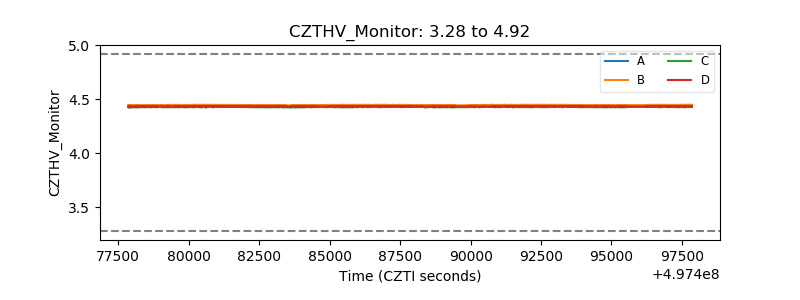 |
| D_VDD | 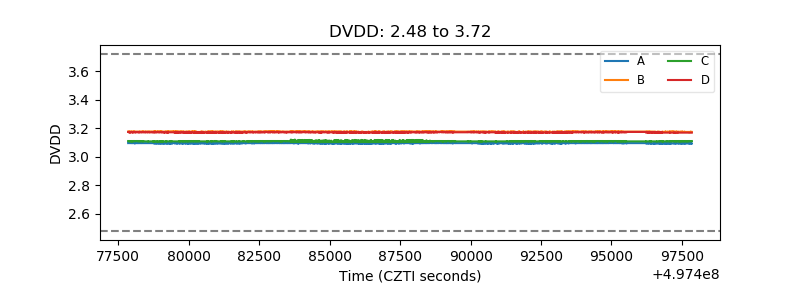 |
| Temperature 1 | 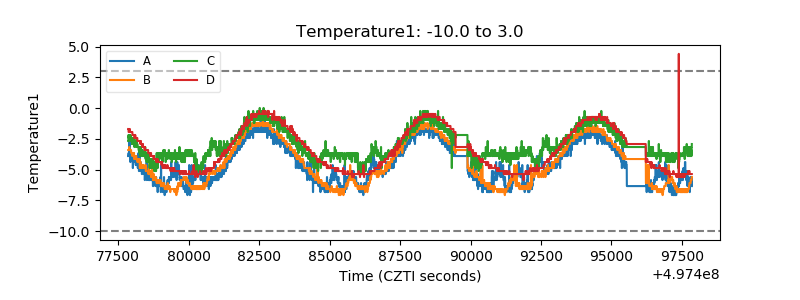 |
| Veto HV Monitor | 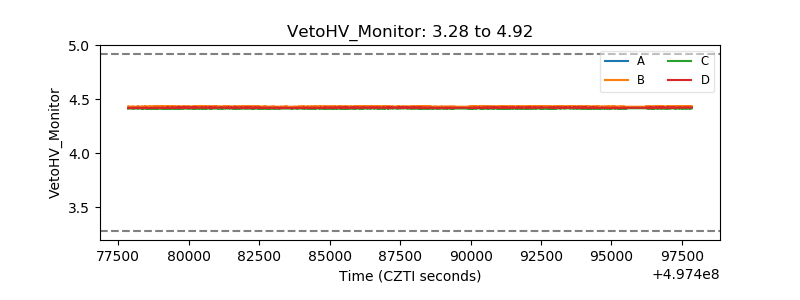 |
| Veto LLD | 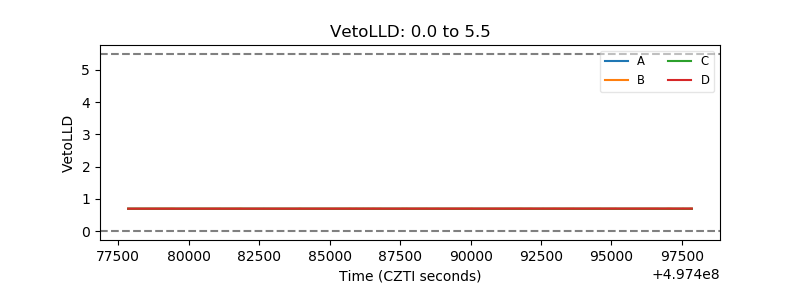 |
| Alpha Counter | 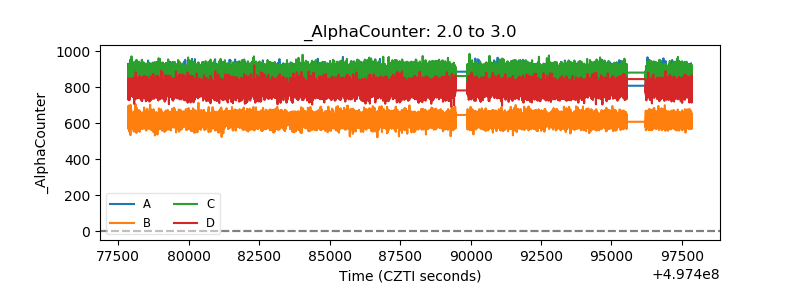 |
| _CPM_Rate | 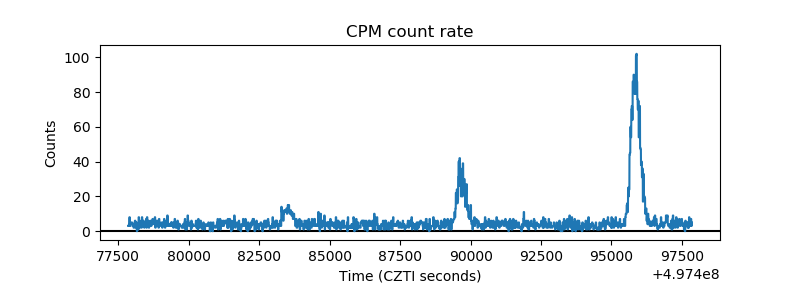 |
| CZT Counter | 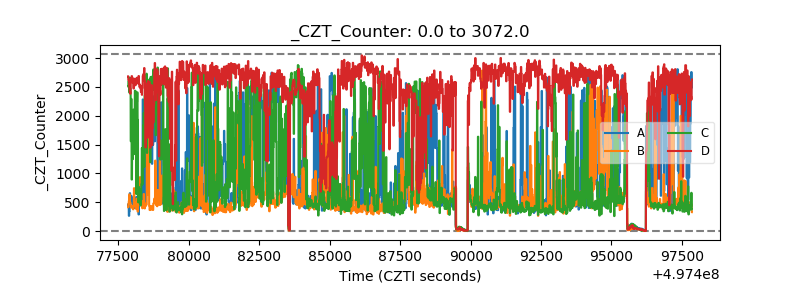 |
| +2.5 Volts monitor |  |
| +5 Volts monitor |  |
| _ROLL_ROT | 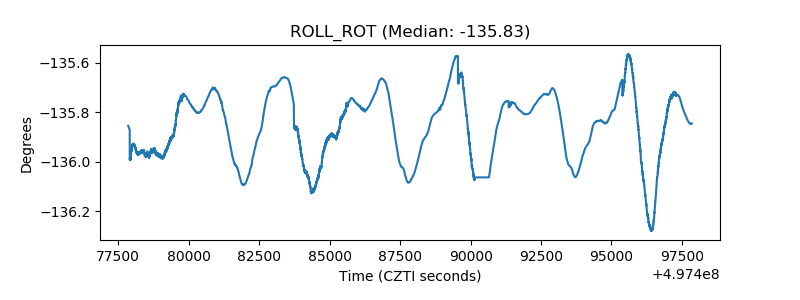 |
| _Roll_DEC | 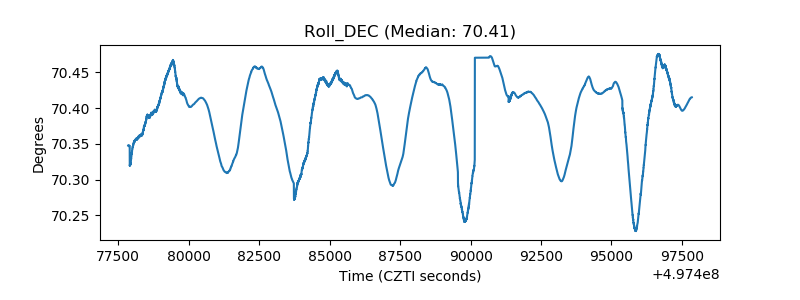 |
| _Roll_RA |  |
| Veto Counter | 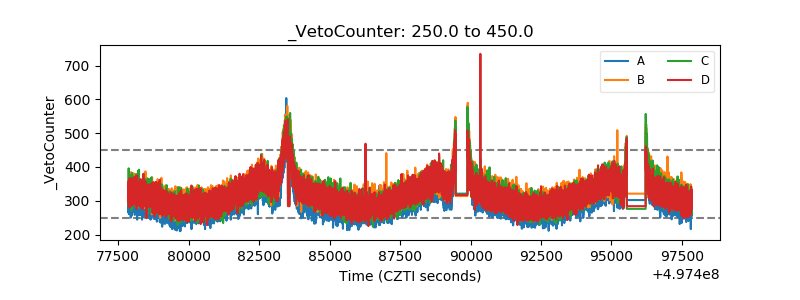 |