| Param | Original file | Final file |
|---|---|---|
| Filename | modeM0/AS1C09_004T08_9000006514_54235cztM0_level2.fits | modeM0/AS1C09_004T08_9000006514_54235cztM0_level2_quad_clean.evt |
| Size (bytes) | 878,981,760 | 66,441,600 |
| Size | 838.3 MB | 63.4 MB |
| Events in quadrant A | 8,727,443 | 392,857 |
| Events in quadrant B | 3,593,425 | 623,416 |
| Events in quadrant C | 4,537,419 | 512,060 |
| Events in quadrant D | 15,188,847 | 42,194 |
| Mode M0 | |||
|---|---|---|---|
| Quadrant | BADHDUFLAG | Total packets | Discarded packets |
| A | 0 | 30249 | 1 |
| B | 0 | 15040 | 1 |
| C | 0 | 18196 | 1 |
| D | 0 | 49447 | 2 |
| Mode M9 | |||
|---|---|---|---|
| Quadrant | BADHDUFLAG | Total packets | Discarded packets |
| A | 0 | 8 | 0 |
| B | 0 | 8 | 0 |
| C | 0 | 8 | 0 |
| D | 0 | 8 | 0 |
| Mode SS | |||
|---|---|---|---|
| Quadrant | BADHDUFLAG | Total packets | Discarded packets |
| A | 0 | 128 | 0 |
| B | 0 | 128 | 0 |
| C | 0 | 128 | 0 |
| D | 0 | 128 | 0 |
| Quadrant | Total seconds | Saturated seconds | Saturation percentage |
|---|---|---|---|
| A | 6318 | 2275 | 36.008230% |
| B | 6318 | 143 | 2.263374% |
| C | 6318 | 599 | 9.480848% |
| D | 6317 | 5918 | 93.683711% |
Noise dominated data is calculated using 1-second bins in cleaned event files. If a bin has >2000 counts, and if more than 50% of those come from <1% of pixels, then it is considered to be noise-dominated and hence unusable.
| Quadrant | # 1 sec bins | Bins with >0 counts | Bins with >2000 counts | High rate bins dominated by noise | Noise dominated (total time) | Noise dominated (detector-on time) | Marked lightcurve |
|---|---|---|---|---|---|---|---|
| A | 7118 | 6319 | 1876 | 1876 | 26.36% | 29.69% | 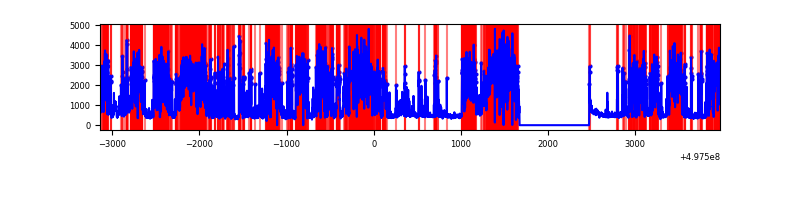 |
| B | 7118 | 6319 | 56 | 56 | 0.79% | 0.89% | 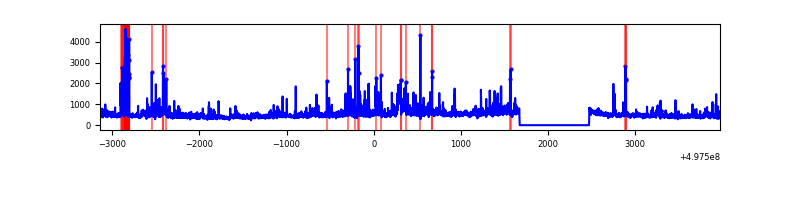 |
| C | 7118 | 6319 | 514 | 514 | 7.22% | 8.13% | 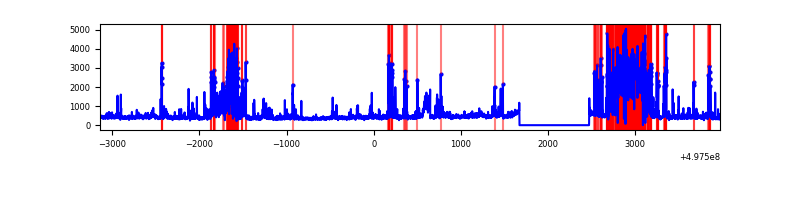 |
| D | 7117 | 6315 | 4763 | 4763 | 66.92% | 75.42% | 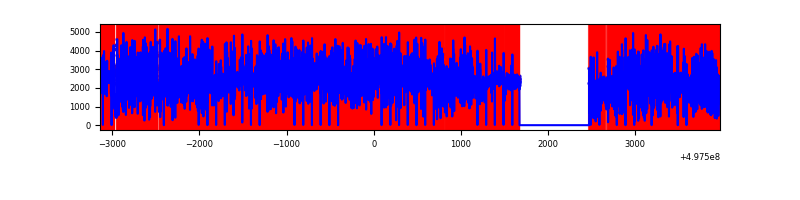 |
Top three noisy pixels from each quadrant. If the there are fewer than three noisy pixels in the level2.evt file, extra rows are filled as -1
| Pixel properties | Quadrant properties | ||||||
|---|---|---|---|---|---|---|---|
| Quadrant | DetID | PixID | Counts | Sigma | Mean | Median | Sigma |
| A | 7 | 29 | 3550217 | 26821.32 | 530 | 517 | 132.3 |
| A | 12 | 17 | 2128188 | 16076.55 | 530 | 517 | 132.3 |
| A | 12 | 194 | 265891 | 2005.15 | 530 | 517 | 132.3 |
| B | 7 | 0 | 261469 | 1876.29 | 648 | 626 | 139.0 |
| B | 5 | 172 | 146306 | 1047.9 | 648 | 626 | 139.0 |
| B | 4 | 171 | 135617 | 971.01 | 648 | 626 | 139.0 |
| C | 1 | 241 | 1305303 | 7867.83 | 602 | 598 | 165.8 |
| C | 15 | 215 | 455090 | 2740.74 | 602 | 598 | 165.8 |
| C | 12 | 252 | 158864 | 954.4 | 602 | 598 | 165.8 |
| D | 8 | 176 | 14152260 | 248335.09 | 196 | 187 | 57.0 |
| D | 3 | 12 | 140714 | 2465.91 | 196 | 187 | 57.0 |
| D | 8 | 160 | 43758 | 764.57 | 196 | 187 | 57.0 |
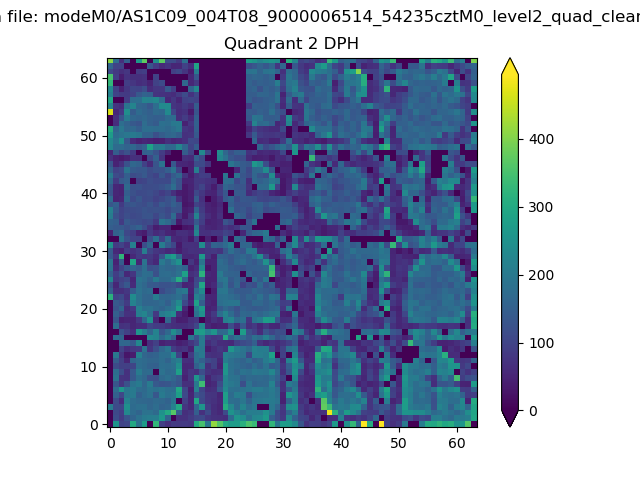
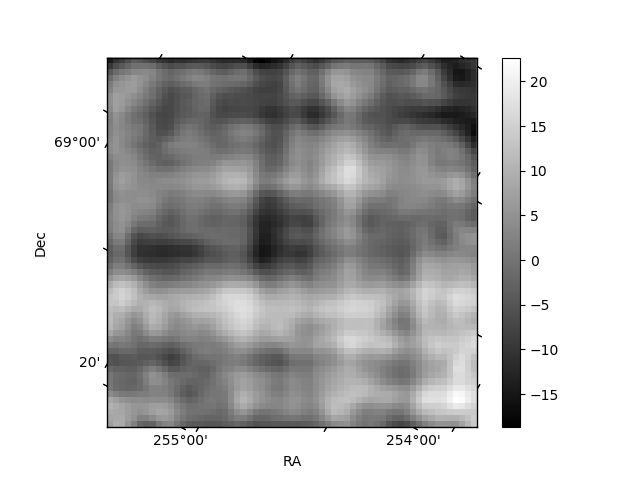
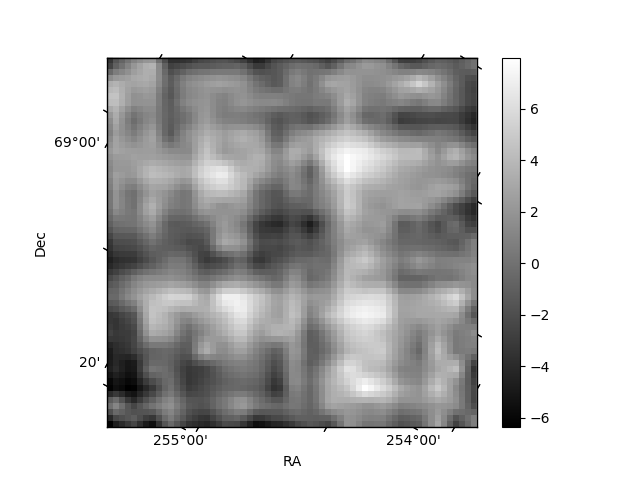
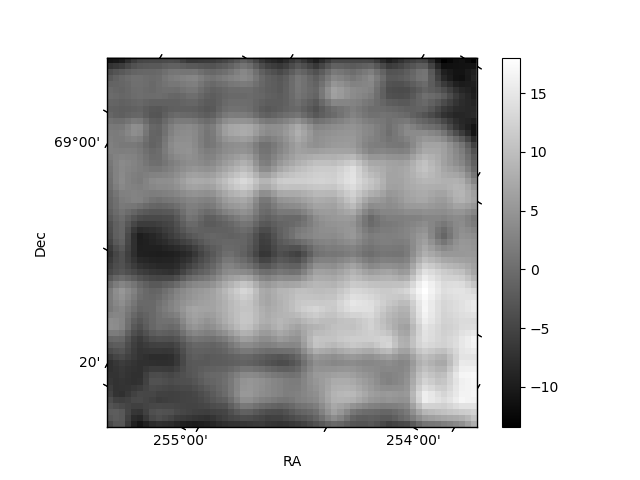
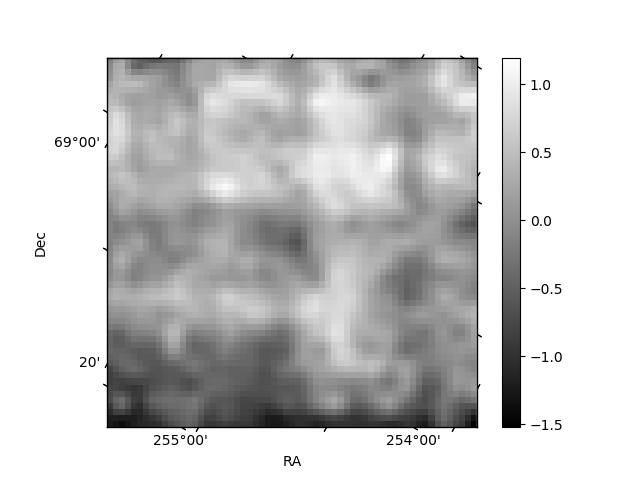
Histogram calculated using DETX and DETY for each event in the final _common_clean file
| Quadrant A | 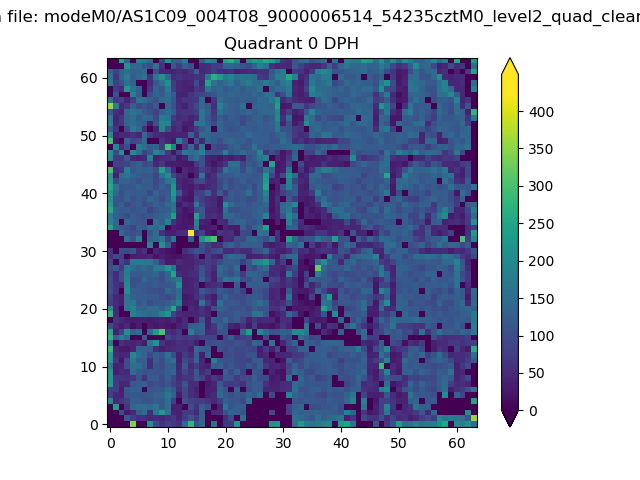 |
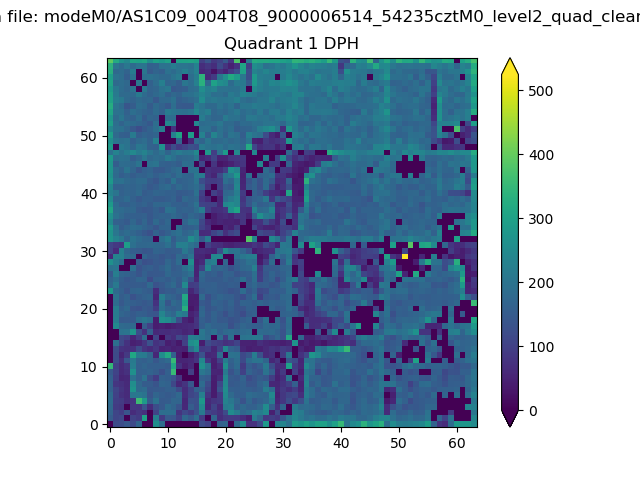 |
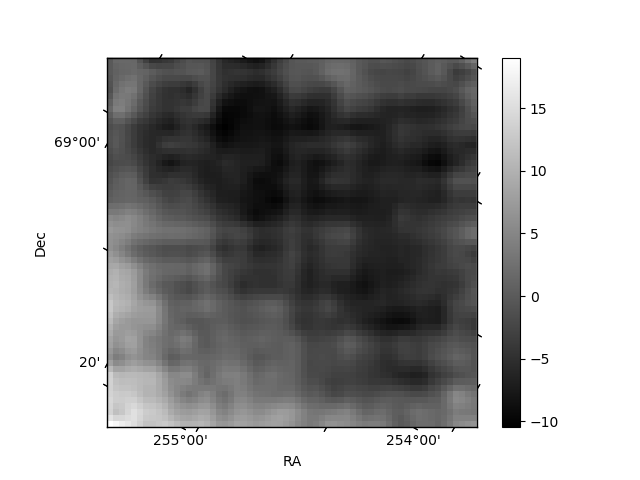
Quadrant B |
|---|---|---|---|
| Quadrant D | 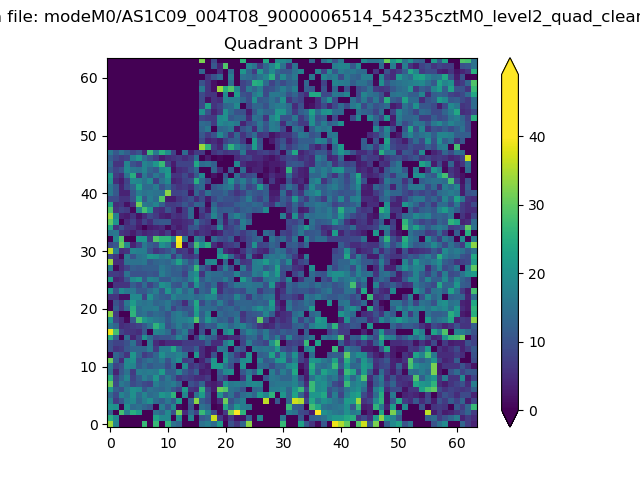 |
 |
Quadrant C |
| Plot type | Count rate plots | Images |
|---|---|---|
| Comparison with Poisson distribution Blue bars denote a histogram of data divided into 1 sec bins. Red curve is a Poisson curve with rate = median count rate of data. |
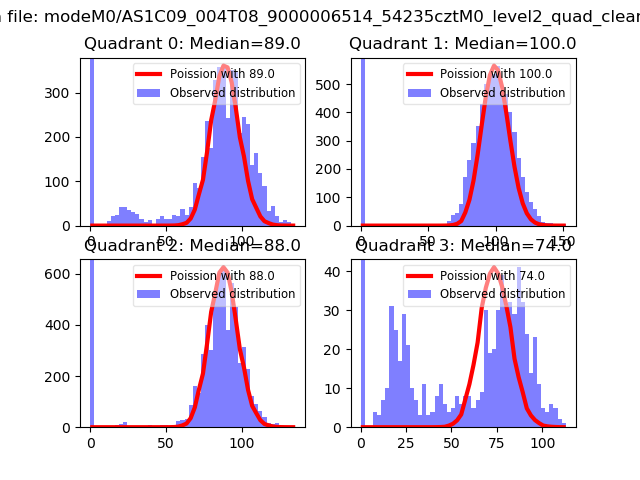 |
 |
| Quadrant-wise count rates Data is divided into 100 sec bins |
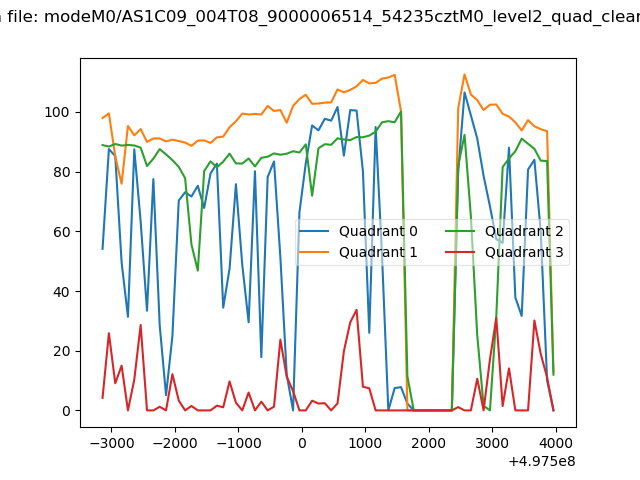 |
|
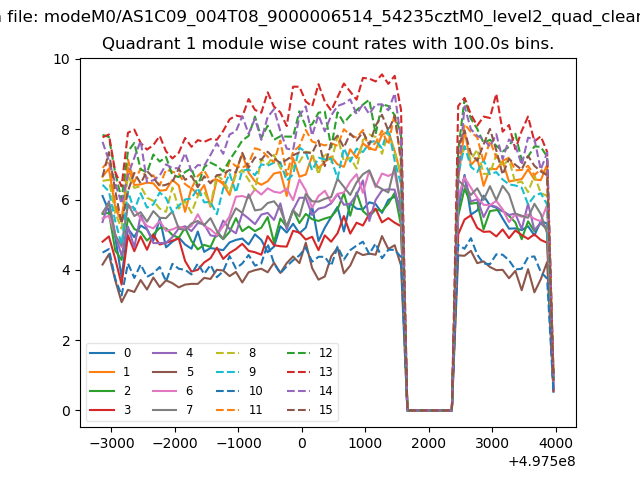
| Module-wise count rates for Quadrant A Data is divided into 100 sec bins |
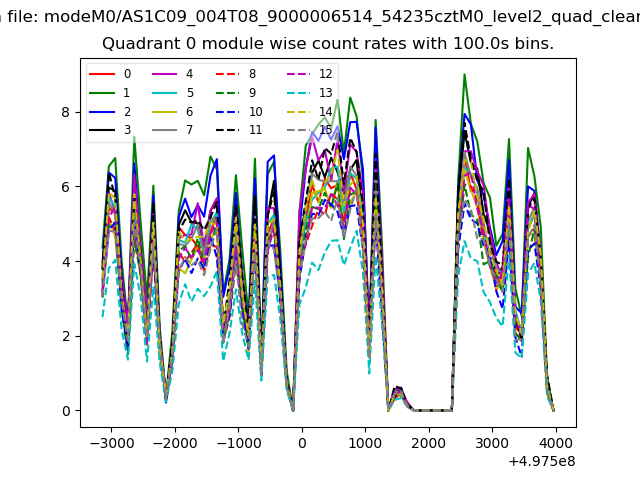 |
 |
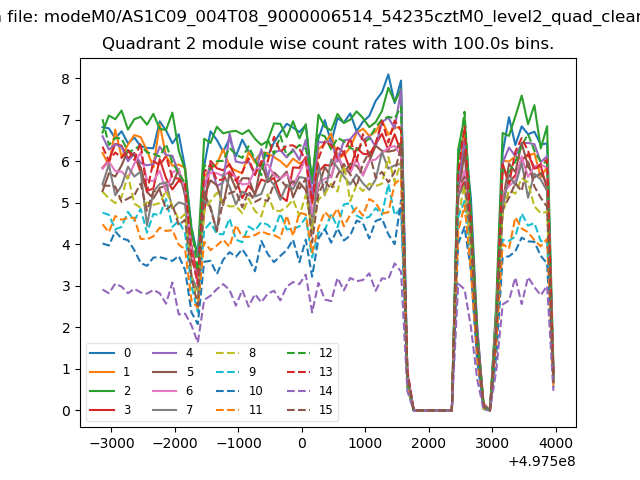
| Module-wise count rates for Quadrant B Data is divided into 100 sec bins |
 |
 |
| Module-wise count rates for Quadrant C Data is divided into 100 sec bins |
 |
 |
| Module-wise count rates for Quadrant D Data is divided into 100 sec bins |
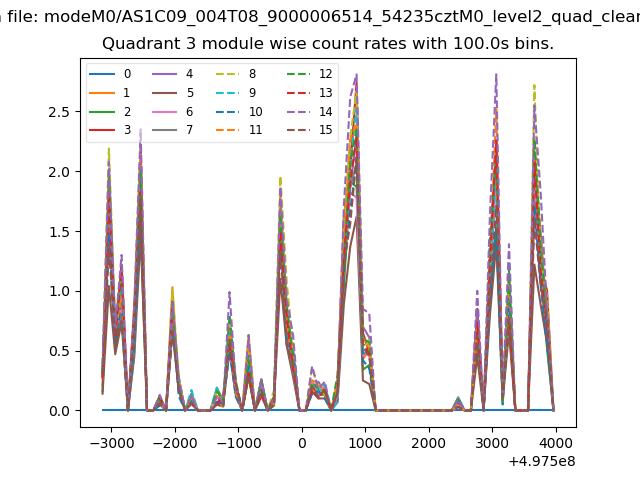 |
 |
| Parameter | Plot |
|---|---|
| CZT HV Monitor | 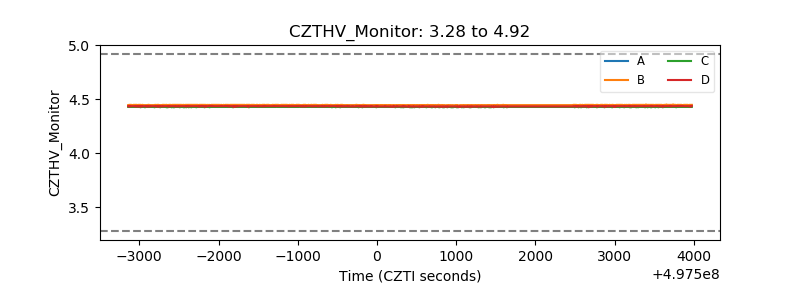 |
| D_VDD | 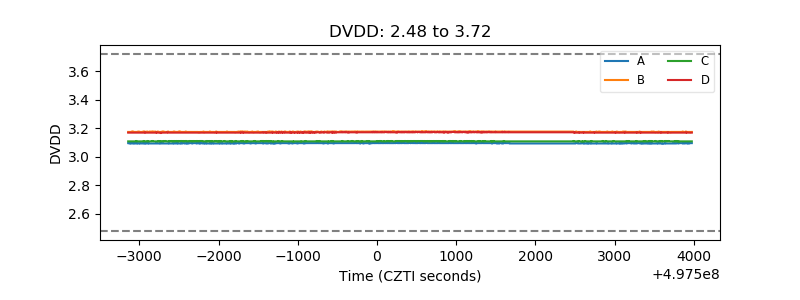 |
| Temperature 1 | 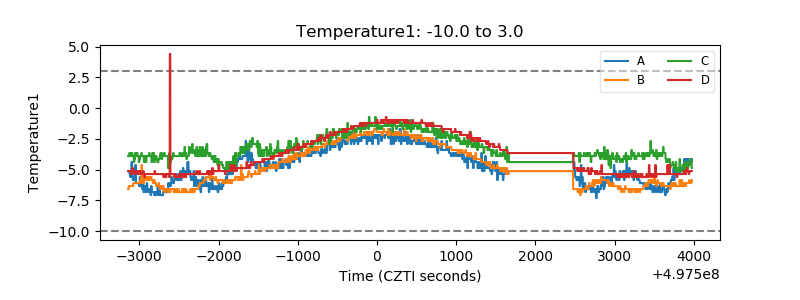 |
| Veto HV Monitor | 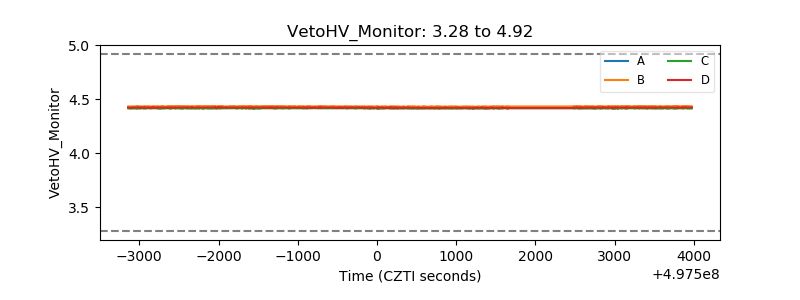 |
| Veto LLD | 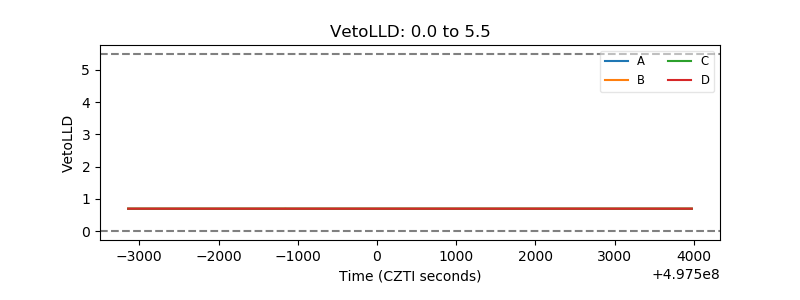 |
| Alpha Counter | 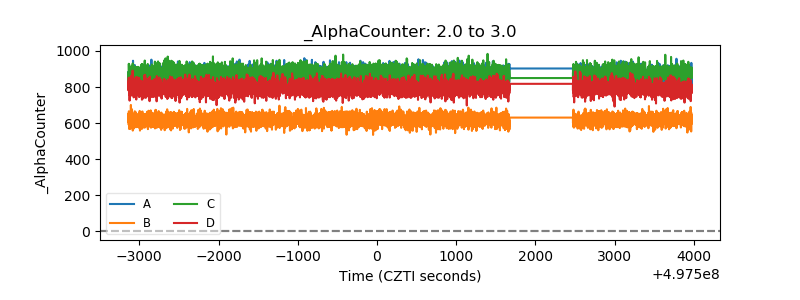 |
| _CPM_Rate | 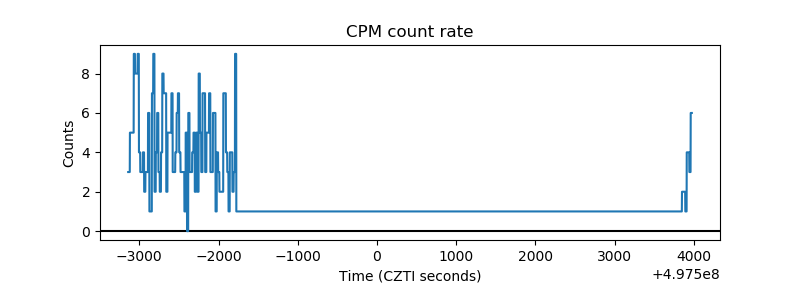 |
| CZT Counter | 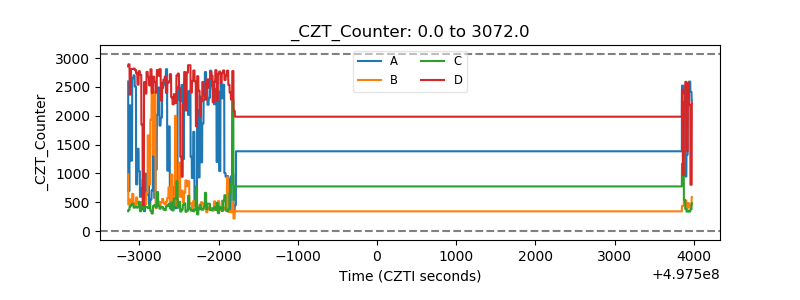 |
| +2.5 Volts monitor |  |
| +5 Volts monitor |  |
| _ROLL_ROT | 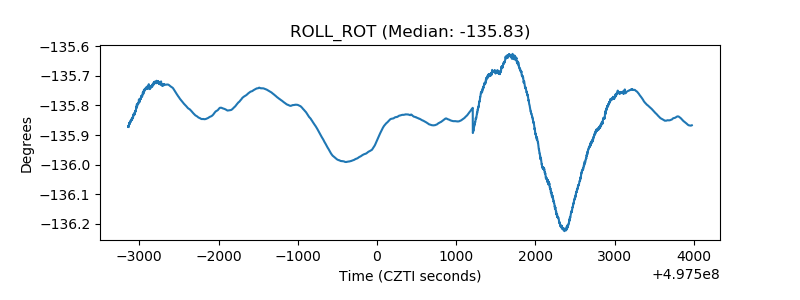 |
| _Roll_DEC | 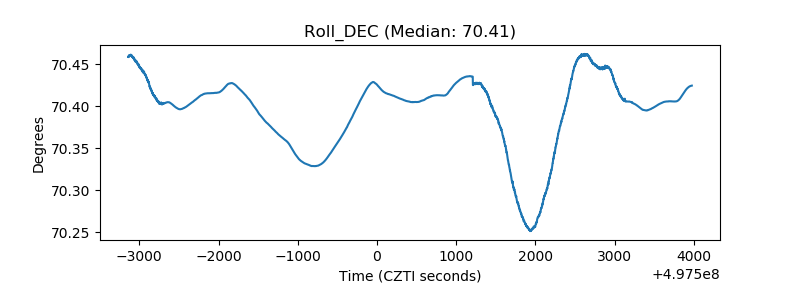 |
| _Roll_RA | 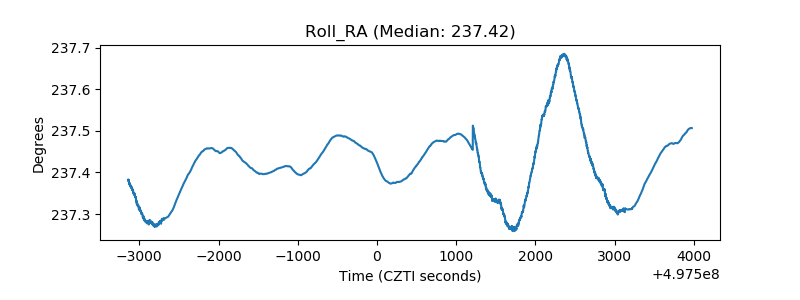 |
| Veto Counter | 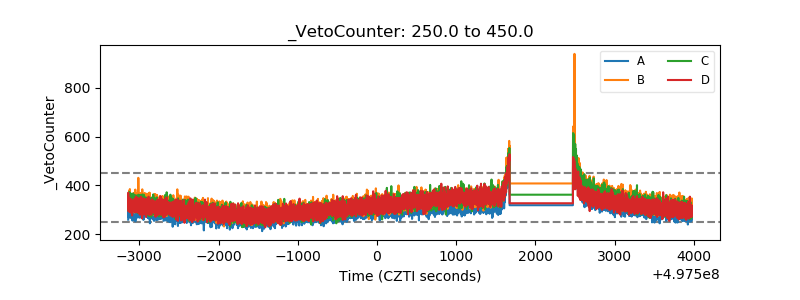 |