| Param | Original file | Final file |
|---|---|---|
| Filename | modeM0/AS1C09_004T08_9000006514_54236cztM0_level2.fits | modeM0/AS1C09_004T08_9000006514_54236cztM0_level2_quad_clean.evt |
| Size (bytes) | 898,856,640 | 62,628,480 |
| Size | 857.2 MB | 59.7 MB |
| Events in quadrant A | 7,739,963 | 409,608 |
| Events in quadrant B | 3,231,129 | 606,746 |
| Events in quadrant C | 7,673,696 | 389,911 |
| Events in quadrant D | 14,156,691 | 65,186 |
| Mode M0 | |||
|---|---|---|---|
| Quadrant | BADHDUFLAG | Total packets | Discarded packets |
| A | 0 | 27153 | 1 |
| B | 0 | 14043 | 1 |
| C | 0 | 27062 | 1 |
| D | 0 | 46273 | 1 |
| Mode M9 | |||
|---|---|---|---|
| Quadrant | BADHDUFLAG | Total packets | Discarded packets |
| A | 0 | 10 | 0 |
| B | 0 | 10 | 0 |
| C | 0 | 10 | 0 |
| D | 0 | 10 | 0 |
| Mode SS | |||
|---|---|---|---|
| Quadrant | BADHDUFLAG | Total packets | Discarded packets |
| A | 0 | 122 | 0 |
| B | 0 | 122 | 0 |
| C | 0 | 122 | 0 |
| D | 0 | 122 | 0 |
| Quadrant | Total seconds | Saturated seconds | Saturation percentage |
|---|---|---|---|
| A | 6086 | 1864 | 30.627670% |
| B | 6085 | 141 | 2.317173% |
| C | 6085 | 1904 | 31.290058% |
| D | 6085 | 5390 | 88.578472% |
Noise dominated data is calculated using 1-second bins in cleaned event files. If a bin has >2000 counts, and if more than 50% of those come from <1% of pixels, then it is considered to be noise-dominated and hence unusable.
| Quadrant | # 1 sec bins | Bins with >0 counts | Bins with >2000 counts | High rate bins dominated by noise | Noise dominated (total time) | Noise dominated (detector-on time) | Marked lightcurve |
|---|---|---|---|---|---|---|---|
| A | 7056 | 6086 | 1515 | 1515 | 21.47% | 24.89% | 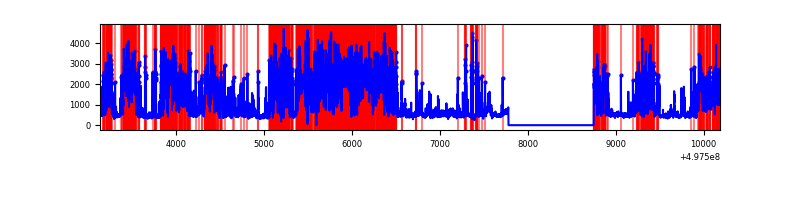 |
| B | 7055 | 6086 | 61 | 61 | 0.86% | 1.00% | 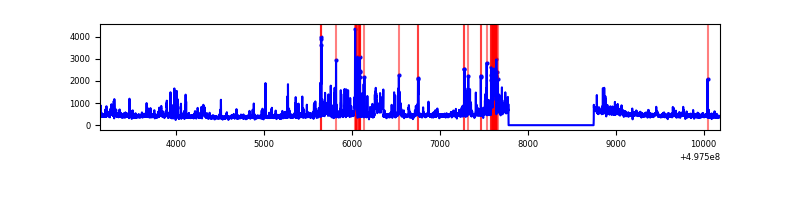 |
| C | 7055 | 6086 | 1733 | 1733 | 24.56% | 28.48% | 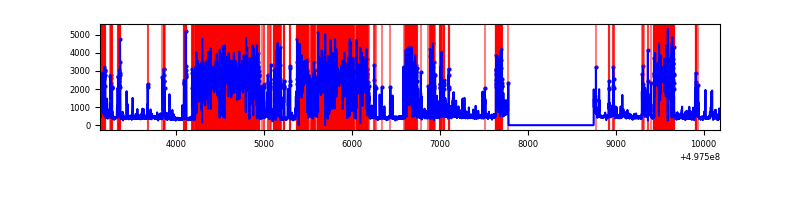 |
| D | 7055 | 6083 | 4376 | 4376 | 62.03% | 71.94% | 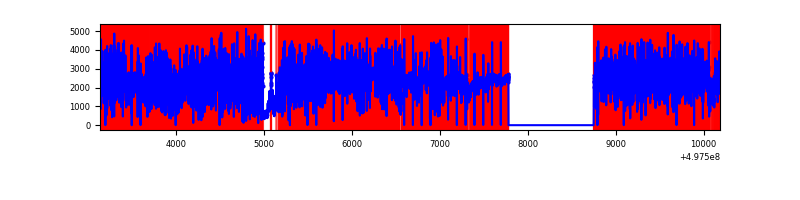 |
Top three noisy pixels from each quadrant. If the there are fewer than three noisy pixels in the level2.evt file, extra rows are filled as -1
| Pixel properties | Quadrant properties | ||||||
|---|---|---|---|---|---|---|---|
| Quadrant | DetID | PixID | Counts | Sigma | Mean | Median | Sigma |
| A | 7 | 29 | 2823094 | 21219.06 | 537 | 525 | 133.0 |
| A | 12 | 17 | 2302899 | 17308.42 | 537 | 525 | 133.0 |
| A | 12 | 194 | 285463 | 2142.06 | 537 | 525 | 133.0 |
| B | 4 | 171 | 240652 | 1791.08 | 624 | 601 | 134.0 |
| B | 5 | 185 | 117730 | 873.93 | 624 | 601 | 134.0 |
| B | 8 | 234 | 116048 | 861.38 | 624 | 601 | 134.0 |
| C | 1 | 241 | 3945493 | 28342.82 | 506 | 501 | 139.2 |
| C | 12 | 2 | 641627 | 4606.17 | 506 | 501 | 139.2 |
| C | 15 | 198 | 516709 | 3708.7 | 506 | 501 | 139.2 |
| D | 8 | 176 | 12742839 | 195423.58 | 225 | 214 | 65.2 |
| D | 3 | 12 | 234864 | 3598.64 | 225 | 214 | 65.2 |
| D | 8 | 160 | 108828 | 1665.73 | 225 | 214 | 65.2 |
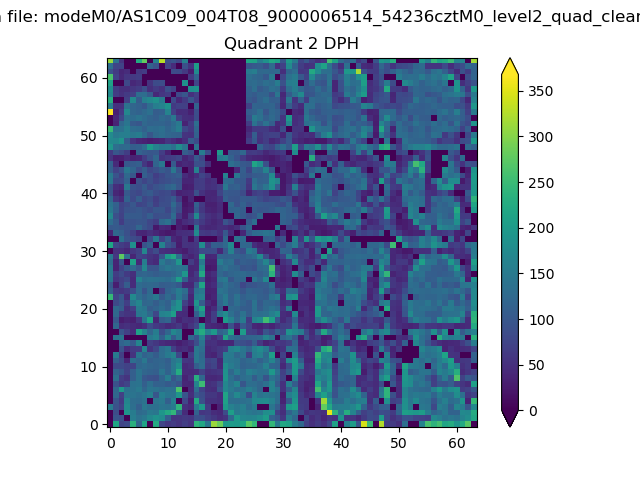
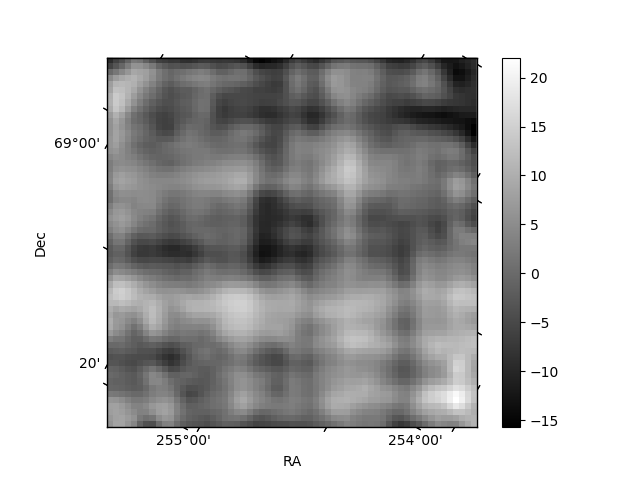
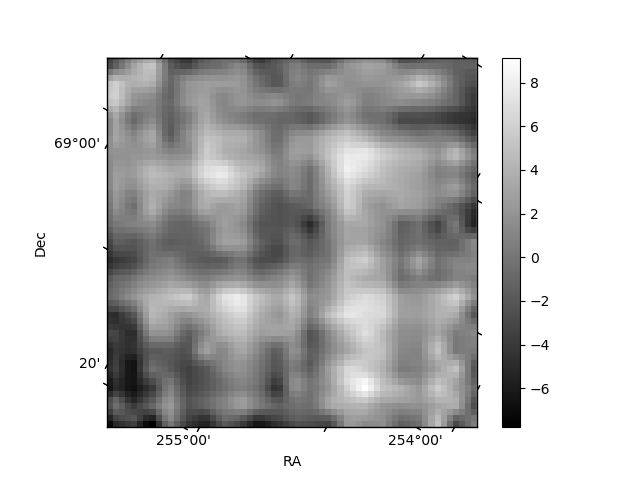
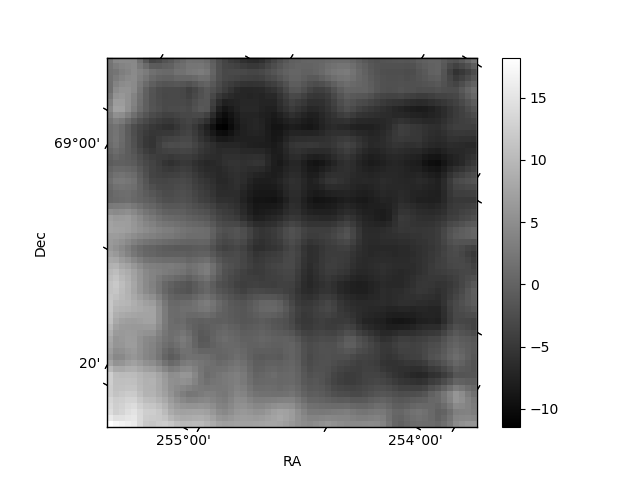
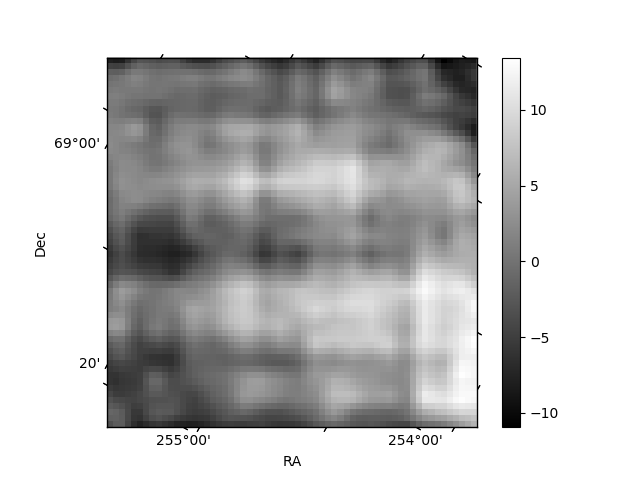
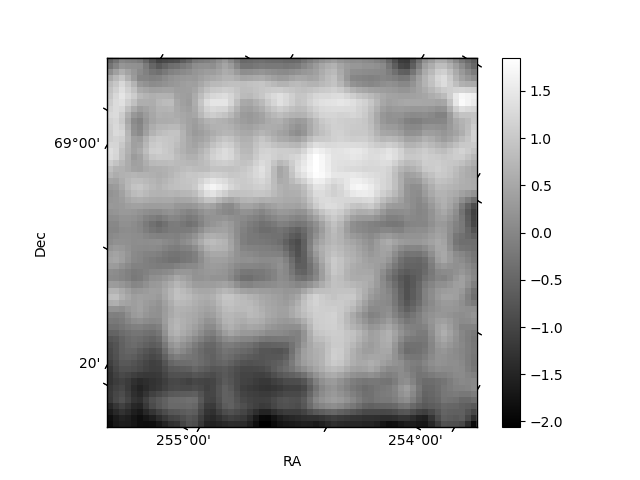
Histogram calculated using DETX and DETY for each event in the final _common_clean file
| Quadrant A | 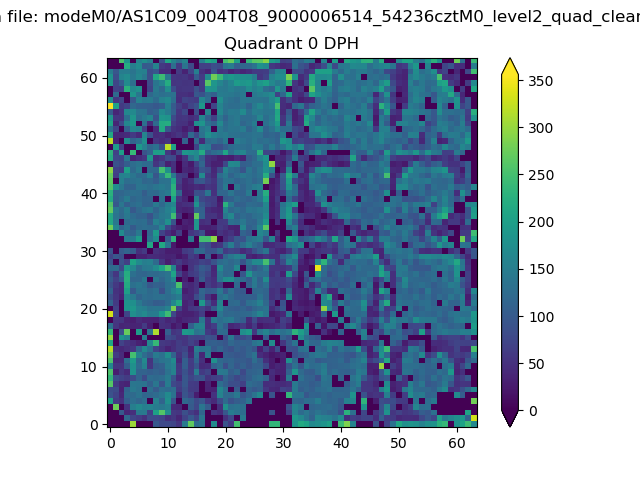 |
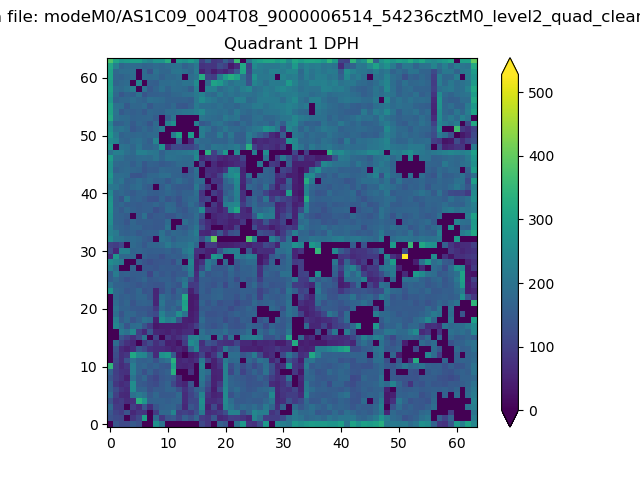 |
Quadrant B |
|---|---|---|---|
| Quadrant D | 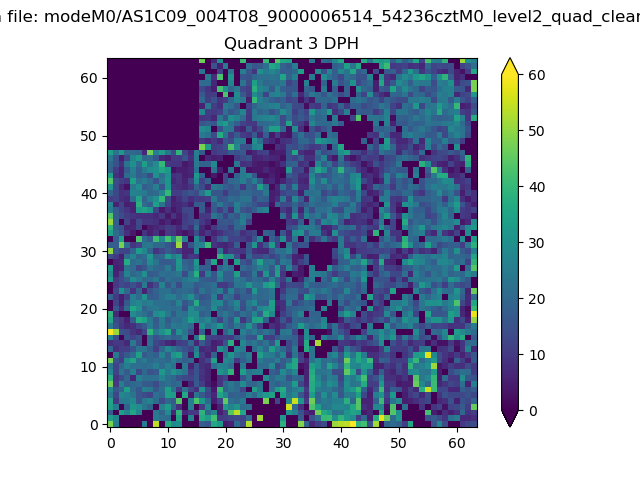 |
 |
Quadrant C |
| Plot type | Count rate plots | Images |
|---|---|---|
| Comparison with Poisson distribution Blue bars denote a histogram of data divided into 1 sec bins. Red curve is a Poisson curve with rate = median count rate of data. |
 |
 |
| Quadrant-wise count rates Data is divided into 100 sec bins |
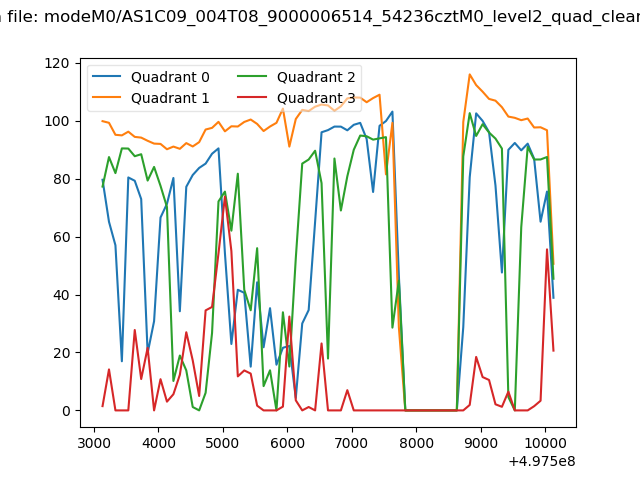 |
|
| Module-wise count rates for Quadrant A Data is divided into 100 sec bins |
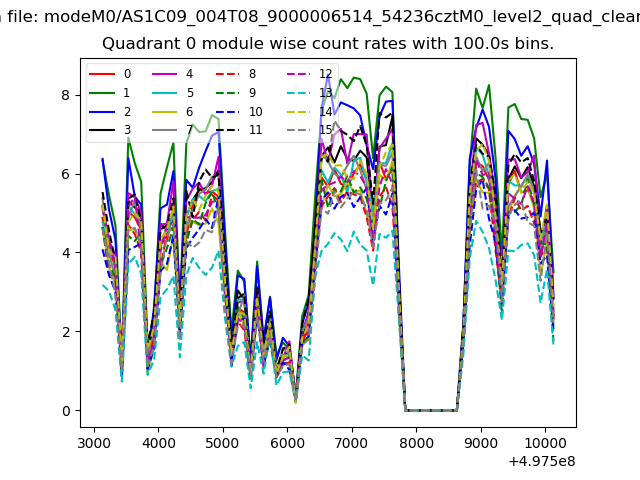 |
 |
| Module-wise count rates for Quadrant B Data is divided into 100 sec bins |
 |
 |
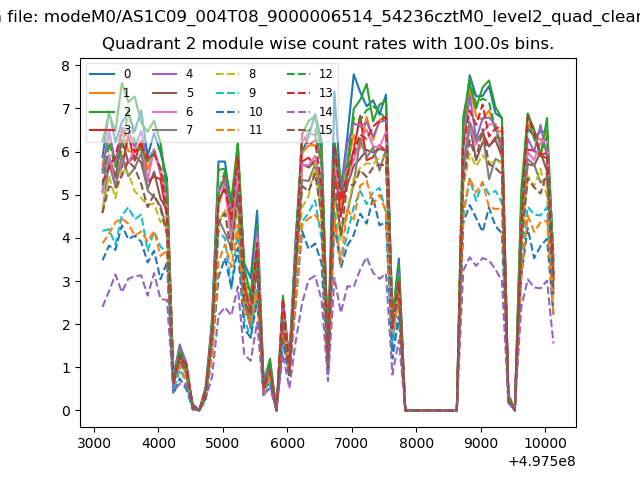
| Module-wise count rates for Quadrant C Data is divided into 100 sec bins |
 |
 |
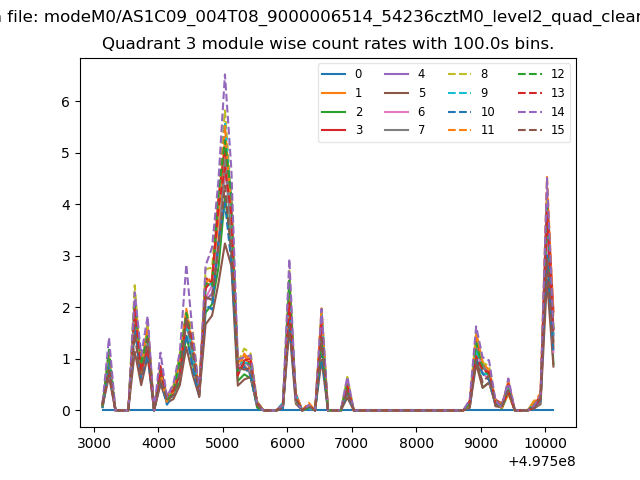
| Module-wise count rates for Quadrant D Data is divided into 100 sec bins |
 |
 |
| Parameter | Plot |
|---|---|
| CZT HV Monitor | 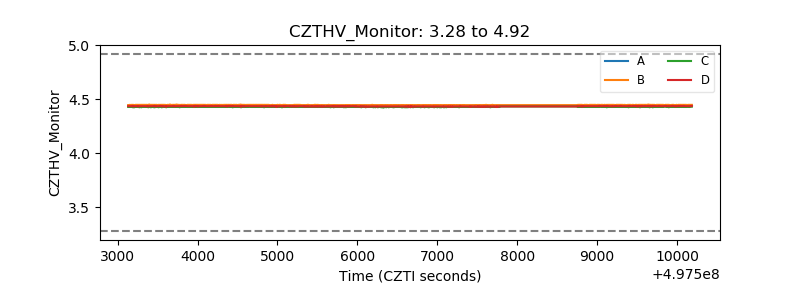 |
| D_VDD | 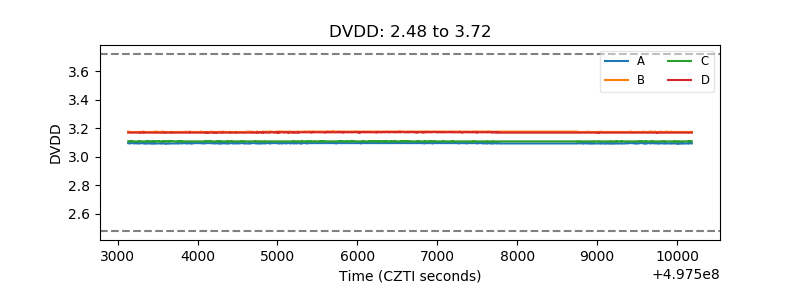 |
| Temperature 1 | 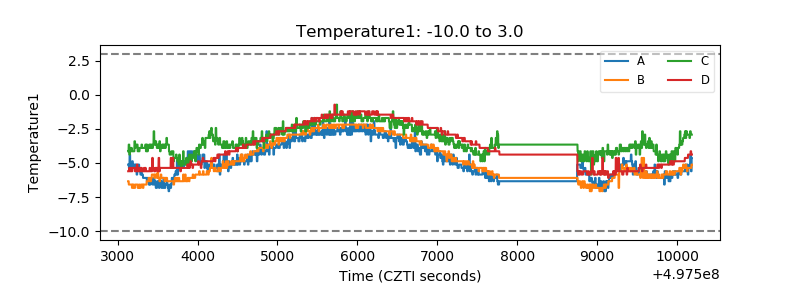 |
| Veto HV Monitor | 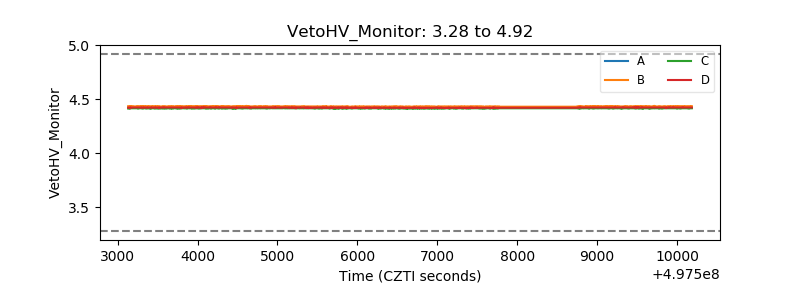 |
| Veto LLD | 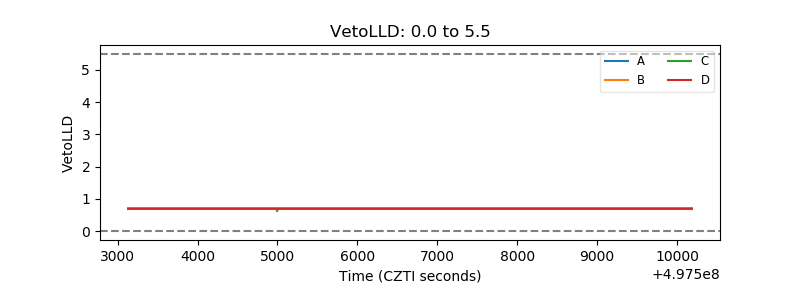 |
| Alpha Counter | 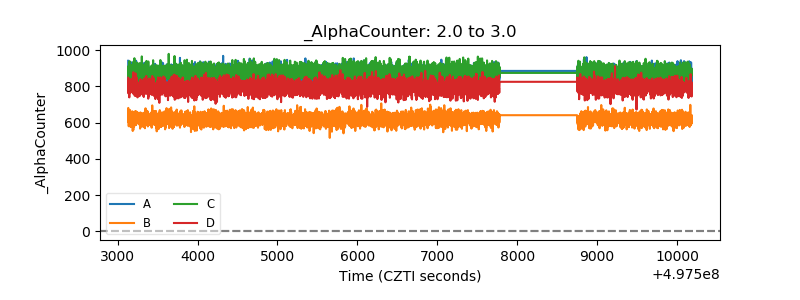 |
| _CPM_Rate |  |
| CZT Counter | 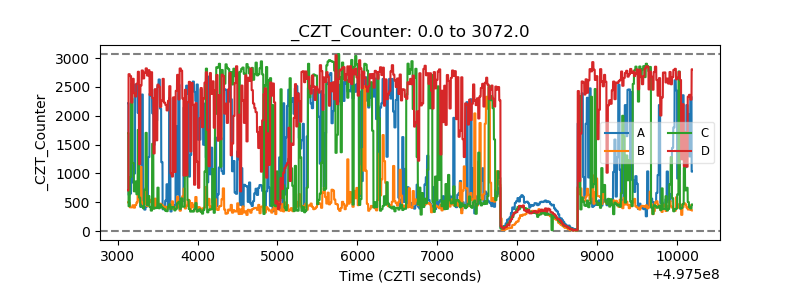 |
| +2.5 Volts monitor |  |
| +5 Volts monitor | 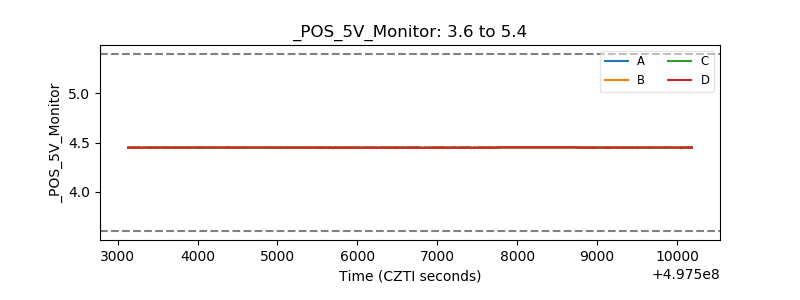 |
| _ROLL_ROT | 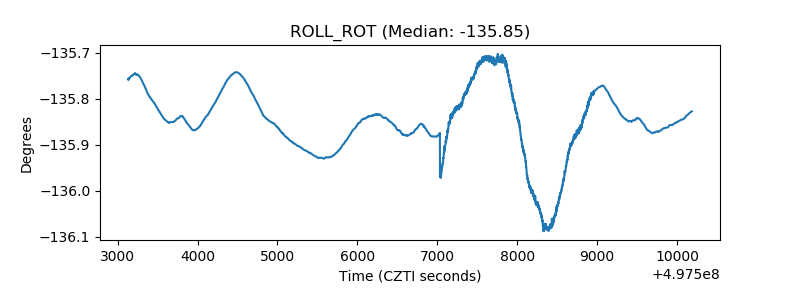 |
| _Roll_DEC | 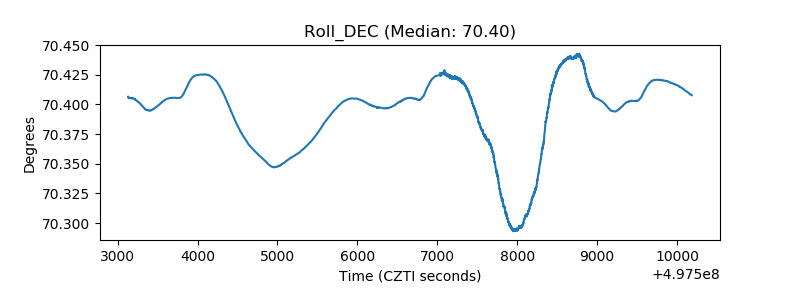 |
| _Roll_RA |  |
| Veto Counter | 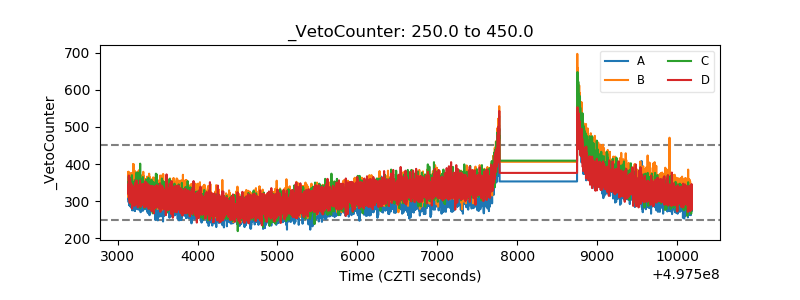 |