| Param | Original file | Final file |
|---|---|---|
| Filename | modeM0/AS1C09_004T08_9000006514_54238cztM0_level2.fits | modeM0/AS1C09_004T08_9000006514_54238cztM0_level2_quad_clean.evt |
| Size (bytes) | 753,955,200 | 69,053,760 |
| Size | 719.0 MB | 65.9 MB |
| Events in quadrant A | 5,944,395 | 487,855 |
| Events in quadrant B | 3,393,679 | 605,413 |
| Events in quadrant C | 3,817,950 | 507,386 |
| Events in quadrant D | 14,289,990 | 73,523 |
| Mode M0 | |||
|---|---|---|---|
| Quadrant | BADHDUFLAG | Total packets | Discarded packets |
| A | 0 | 21759 | 1 |
| B | 0 | 14314 | 1 |
| C | 0 | 15863 | 1 |
| D | 0 | 46579 | 1 |
| Mode M9 | |||
|---|---|---|---|
| Quadrant | BADHDUFLAG | Total packets | Discarded packets |
| A | 0 | 10 | 0 |
| B | 0 | 10 | 0 |
| C | 0 | 10 | 0 |
| D | 0 | 10 | 0 |
| Mode SS | |||
|---|---|---|---|
| Quadrant | BADHDUFLAG | Total packets | Discarded packets |
| A | 0 | 122 | 0 |
| B | 0 | 122 | 0 |
| C | 0 | 122 | 0 |
| D | 0 | 122 | 0 |
| Quadrant | Total seconds | Saturated seconds | Saturation percentage |
|---|---|---|---|
| A | 5958 | 1122 | 18.831823% |
| B | 5959 | 255 | 4.279241% |
| C | 5959 | 449 | 7.534821% |
| D | 5959 | 5229 | 87.749622% |
Noise dominated data is calculated using 1-second bins in cleaned event files. If a bin has >2000 counts, and if more than 50% of those come from <1% of pixels, then it is considered to be noise-dominated and hence unusable.
| Quadrant | # 1 sec bins | Bins with >0 counts | Bins with >2000 counts | High rate bins dominated by noise | Noise dominated (total time) | Noise dominated (detector-on time) | Marked lightcurve |
|---|---|---|---|---|---|---|---|
| A | 7008 | 5959 | 895 | 895 | 12.77% | 15.02% | 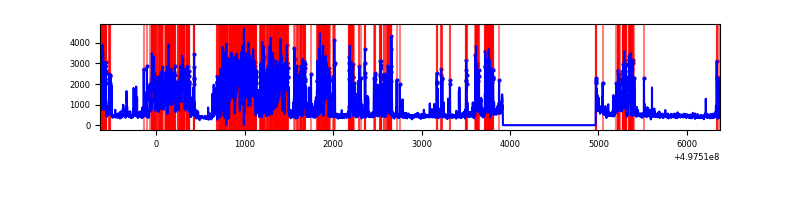 |
| B | 7009 | 5959 | 117 | 117 | 1.67% | 1.96% | 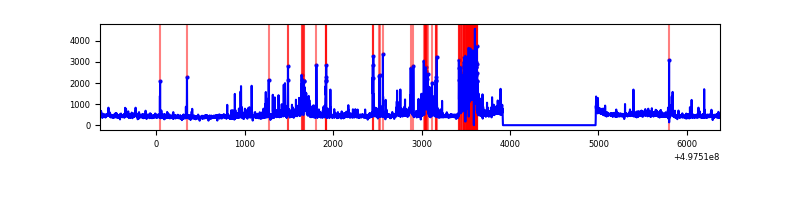 |
| C | 7009 | 5960 | 377 | 377 | 5.38% | 6.33% | 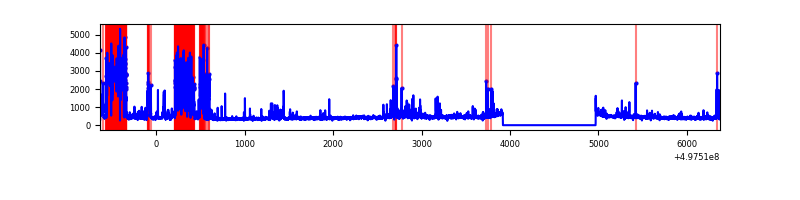 |
| D | 7009 | 5958 | 4559 | 4559 | 65.04% | 76.52% | 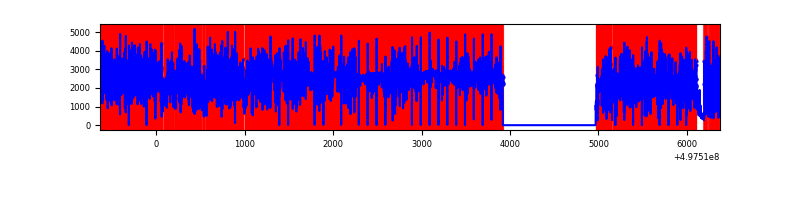 |
Top three noisy pixels from each quadrant. If the there are fewer than three noisy pixels in the level2.evt file, extra rows are filled as -1
| Pixel properties | Quadrant properties | ||||||
|---|---|---|---|---|---|---|---|
| Quadrant | DetID | PixID | Counts | Sigma | Mean | Median | Sigma |
| A | 7 | 29 | 1747131 | 12054.56 | 584 | 570 | 144.9 |
| A | 12 | 17 | 1555347 | 10730.89 | 584 | 570 | 144.9 |
| A | 12 | 194 | 204793 | 1409.52 | 584 | 570 | 144.9 |
| B | 5 | 185 | 317650 | 2426.71 | 615 | 595 | 130.7 |
| B | 4 | 171 | 295369 | 2256.17 | 615 | 595 | 130.7 |
| B | 2 | 249 | 78605 | 597.08 | 615 | 595 | 130.7 |
| C | 12 | 2 | 650338 | 4044.96 | 578 | 572 | 160.6 |
| C | 15 | 198 | 596614 | 3710.52 | 578 | 572 | 160.6 |
| C | 15 | 215 | 95466 | 590.74 | 578 | 572 | 160.6 |
| D | 8 | 176 | 12941937 | 191080.1 | 230 | 219 | 67.7 |
| D | 3 | 12 | 173497 | 2558.39 | 230 | 219 | 67.7 |
| D | 8 | 160 | 90788 | 1337.22 | 230 | 219 | 67.7 |
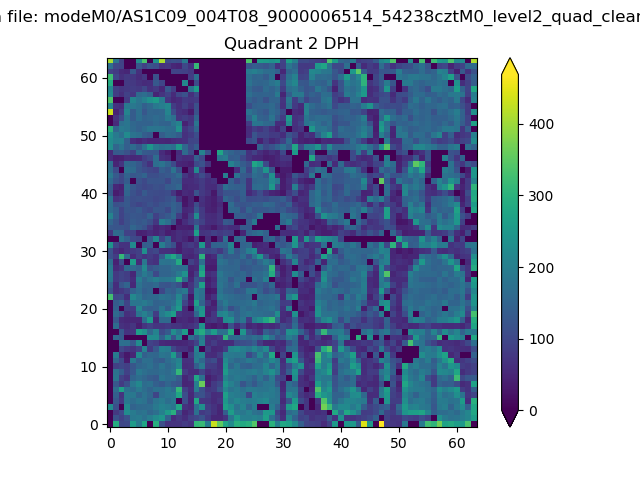
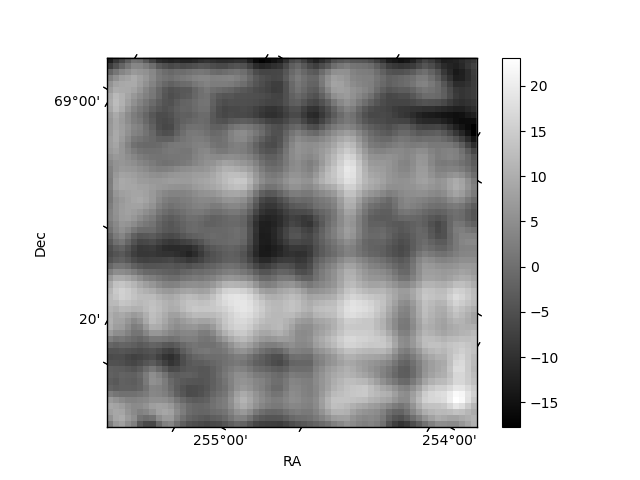
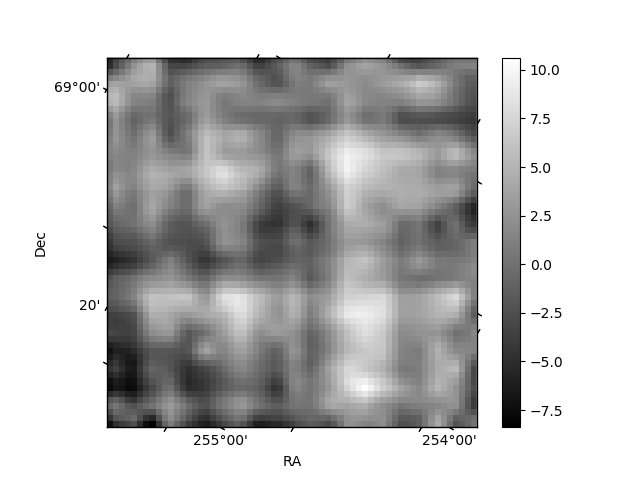
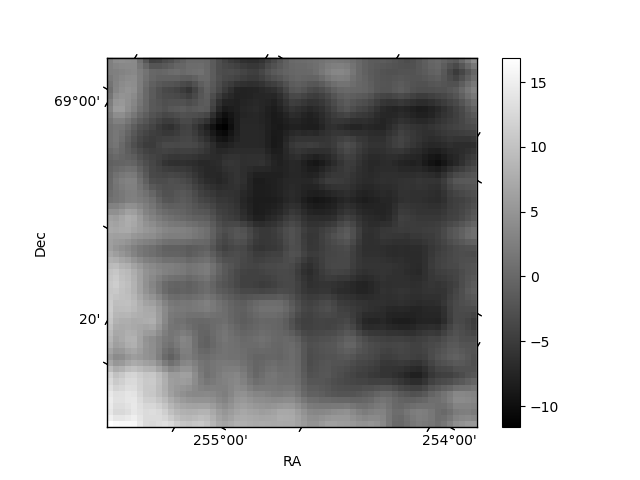
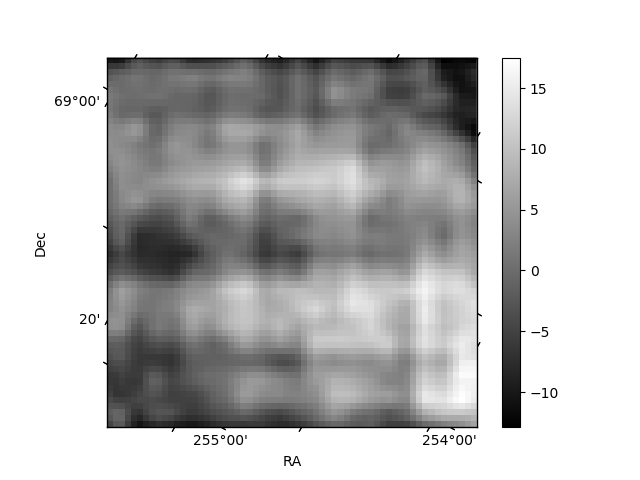
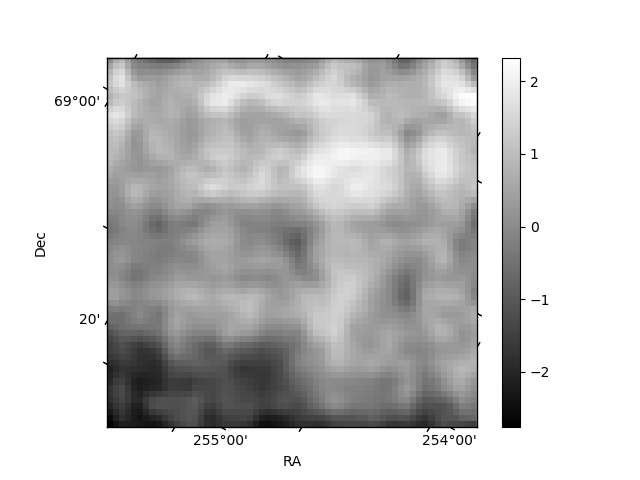
Histogram calculated using DETX and DETY for each event in the final _common_clean file
| Quadrant A | 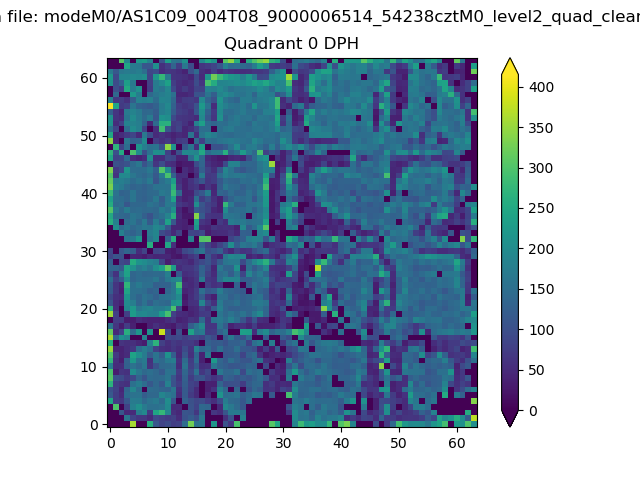 |
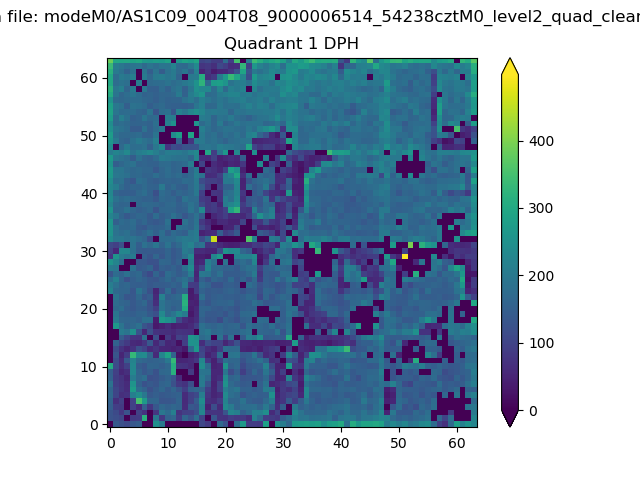 |
Quadrant B |
|---|---|---|---|
| Quadrant D | 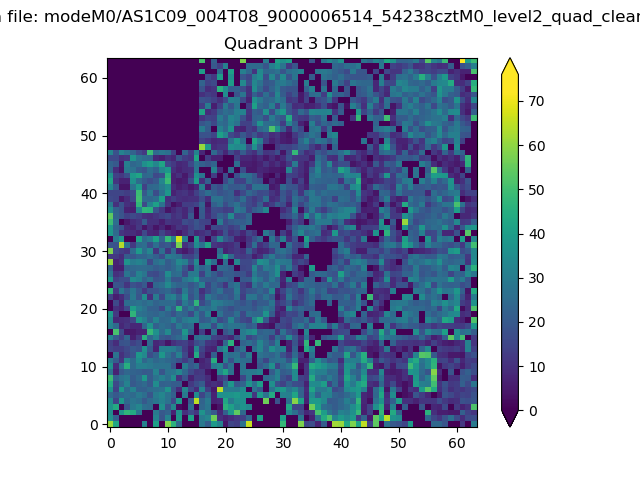 |
 |
Quadrant C |
| Plot type | Count rate plots | Images |
|---|---|---|
| Comparison with Poisson distribution Blue bars denote a histogram of data divided into 1 sec bins. Red curve is a Poisson curve with rate = median count rate of data. |
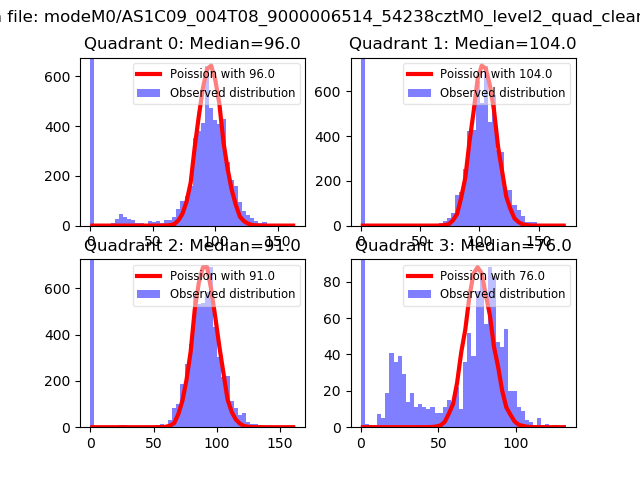 |
 |
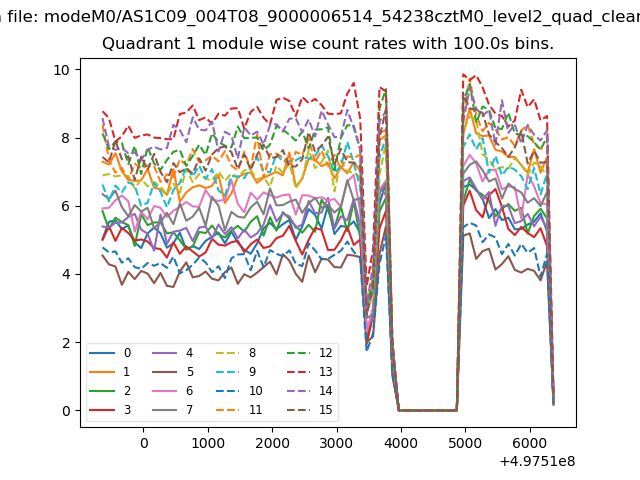
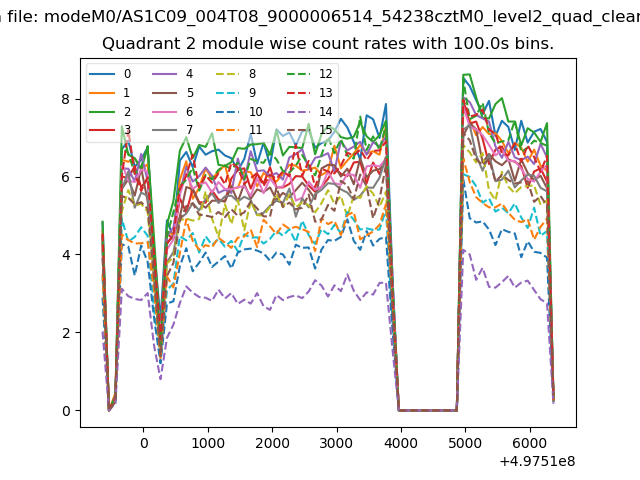
| Quadrant-wise count rates Data is divided into 100 sec bins |
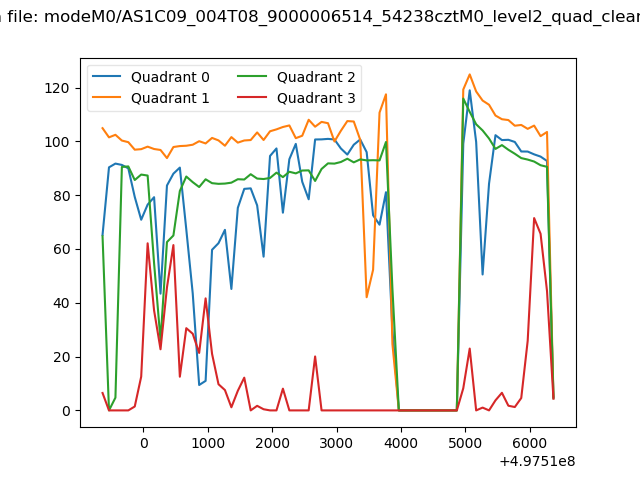 |
|
| Module-wise count rates for Quadrant A Data is divided into 100 sec bins |
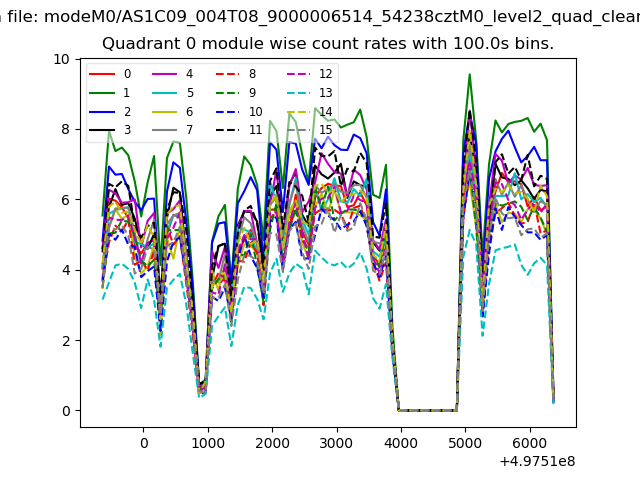 |
 |
| Module-wise count rates for Quadrant B Data is divided into 100 sec bins |
 |
 |
| Module-wise count rates for Quadrant C Data is divided into 100 sec bins |
 |
 |
| Module-wise count rates for Quadrant D Data is divided into 100 sec bins |
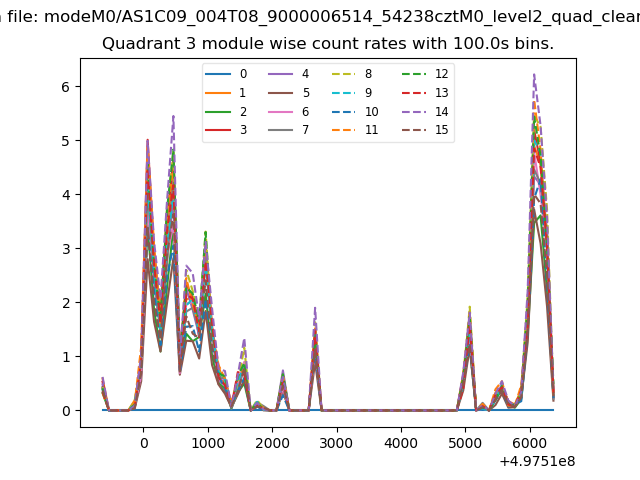 |
 |
| Parameter | Plot |
|---|---|
| CZT HV Monitor | 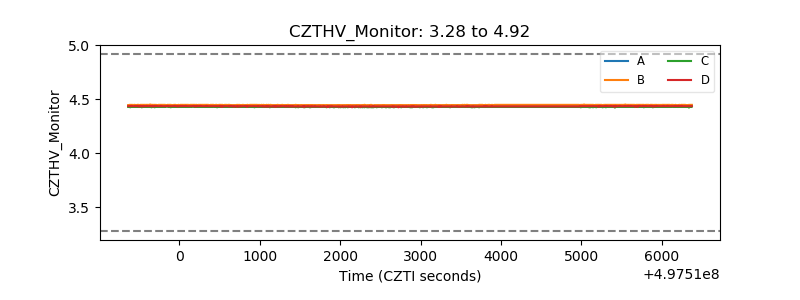 |
| D_VDD | 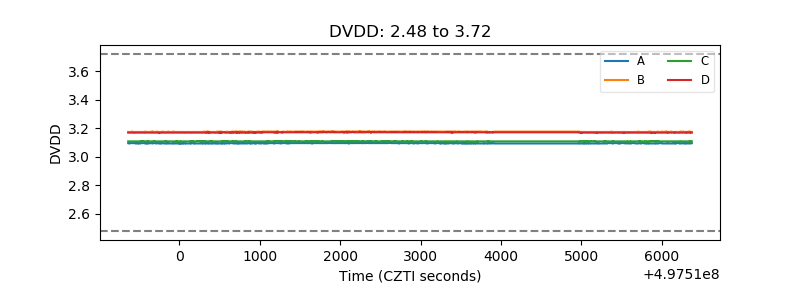 |
| Temperature 1 | 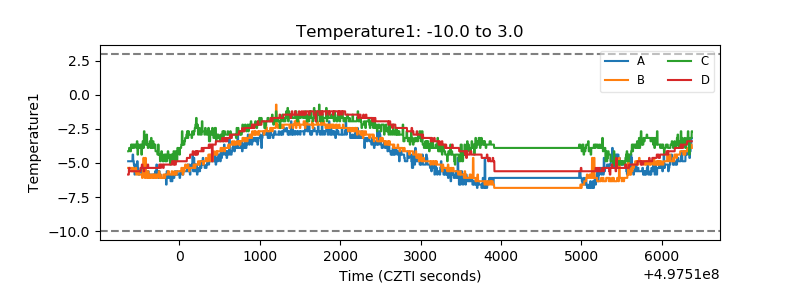 |
| Veto HV Monitor | 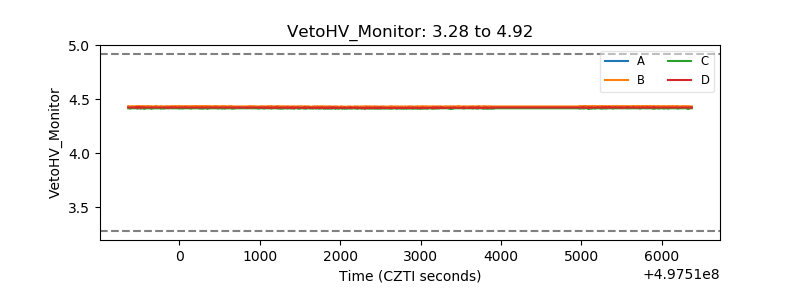 |
| Veto LLD | 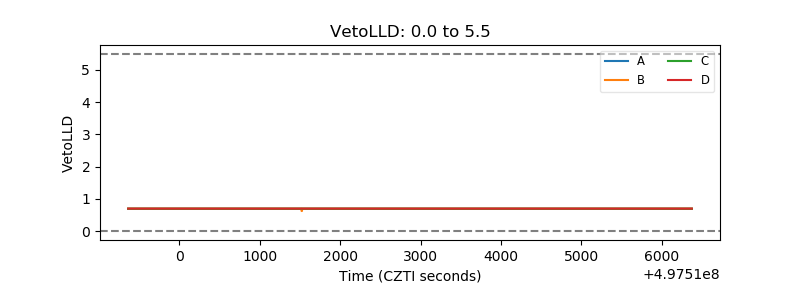 |
| Alpha Counter | 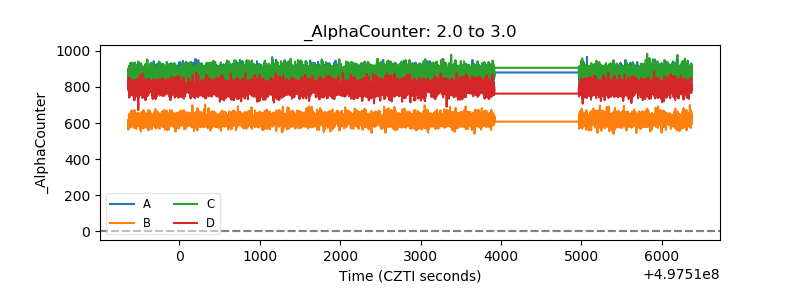 |
| _CPM_Rate | 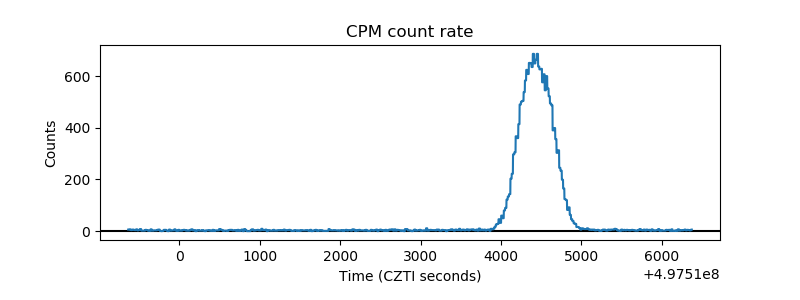 |
| CZT Counter | 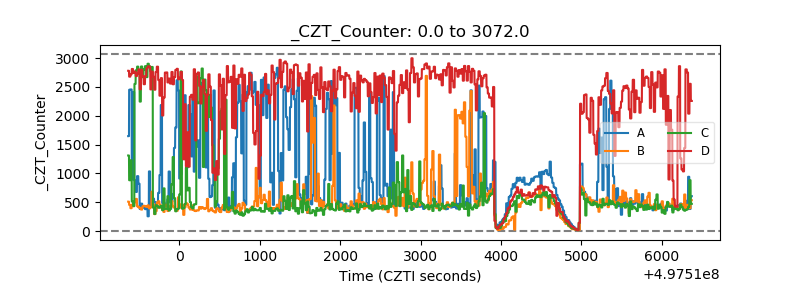 |
| +2.5 Volts monitor | 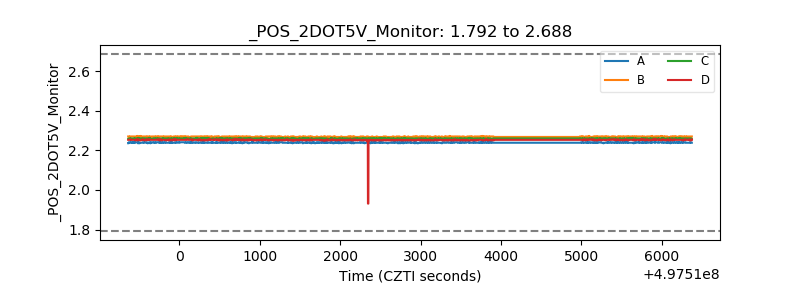 |
| +5 Volts monitor | 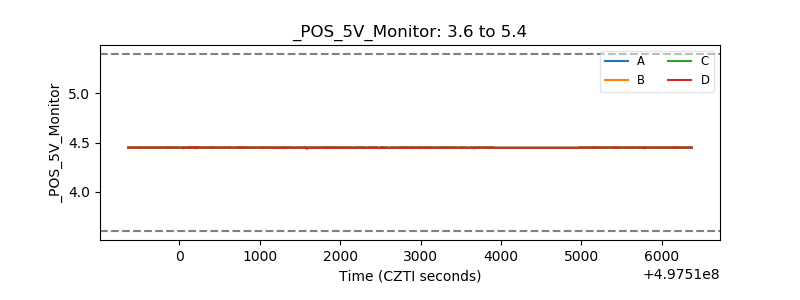 |
| _ROLL_ROT | 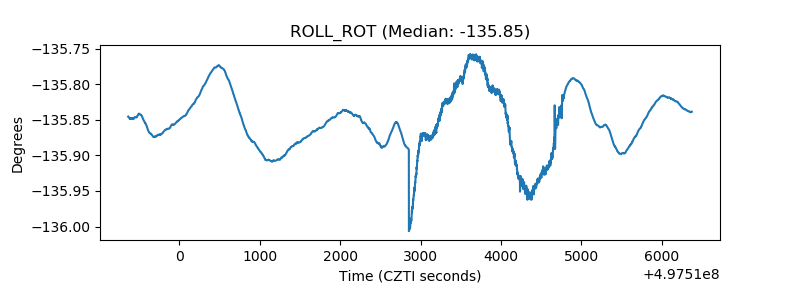 |
| _Roll_DEC | 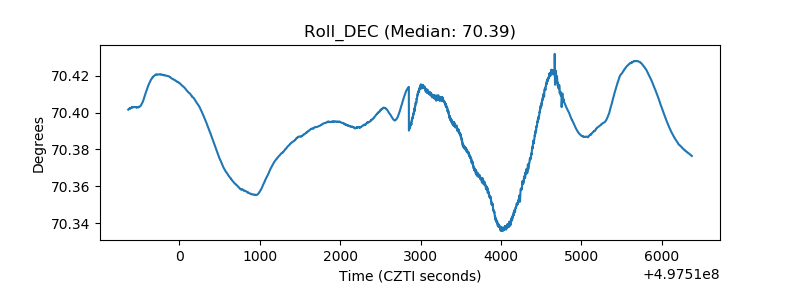 |
| _Roll_RA | 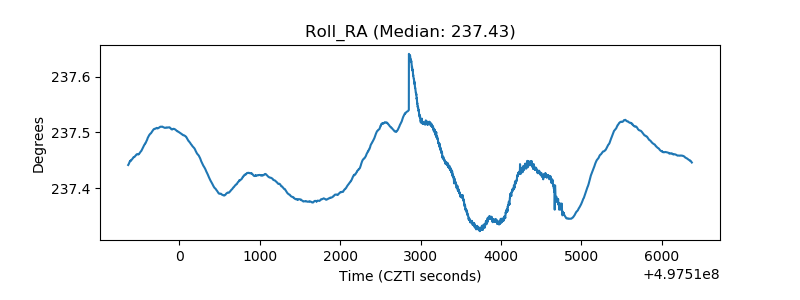 |
| Veto Counter | 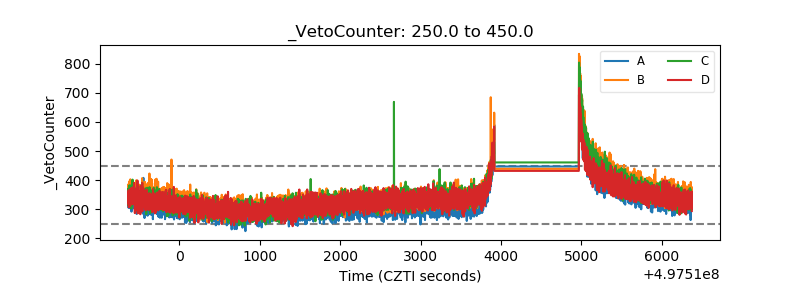 |