| Param | Original file | Final file |
|---|---|---|
| Filename | modeM0/AS1C09_004T08_9000006514_54239cztM0_level2.fits | modeM0/AS1C09_004T08_9000006514_54239cztM0_level2_quad_clean.evt |
| Size (bytes) | 703,897,920 | 80,389,440 |
| Size | 671.3 MB | 76.7 MB |
| Events in quadrant A | 5,816,045 | 548,033 |
| Events in quadrant B | 3,626,610 | 680,342 |
| Events in quadrant C | 3,402,135 | 577,057 |
| Events in quadrant D | 12,719,188 | 187,021 |
| Mode M0 | |||
|---|---|---|---|
| Quadrant | BADHDUFLAG | Total packets | Discarded packets |
| A | 0 | 21581 | 1 |
| B | 0 | 15049 | 1 |
| C | 0 | 14876 | 1 |
| D | 0 | 42109 | 5 |
| Mode M9 | |||
|---|---|---|---|
| Quadrant | BADHDUFLAG | Total packets | Discarded packets |
| A | 0 | 12 | 0 |
| B | 0 | 12 | 0 |
| C | 0 | 12 | 0 |
| D | 0 | 12 | 0 |
| Mode SS | |||
|---|---|---|---|
| Quadrant | BADHDUFLAG | Total packets | Discarded packets |
| A | 0 | 128 | 0 |
| B | 0 | 128 | 0 |
| C | 0 | 128 | 0 |
| D | 0 | 128 | 0 |
| Quadrant | Total seconds | Saturated seconds | Saturation percentage |
|---|---|---|---|
| A | 6330 | 994 | 15.703002% |
| B | 6331 | 133 | 2.100774% |
| C | 6331 | 217 | 3.427579% |
| D | 6330 | 4379 | 69.178515% |
Noise dominated data is calculated using 1-second bins in cleaned event files. If a bin has >2000 counts, and if more than 50% of those come from <1% of pixels, then it is considered to be noise-dominated and hence unusable.
| Quadrant | # 1 sec bins | Bins with >0 counts | Bins with >2000 counts | High rate bins dominated by noise | Noise dominated (total time) | Noise dominated (detector-on time) | Marked lightcurve |
|---|---|---|---|---|---|---|---|
| A | 7450 | 6331 | 734 | 734 | 9.85% | 11.59% | 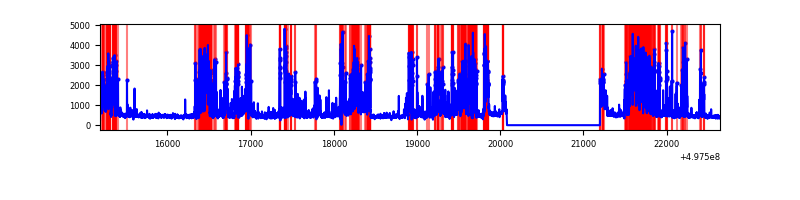 |
| B | 7451 | 6332 | 38 | 38 | 0.51% | 0.60% | 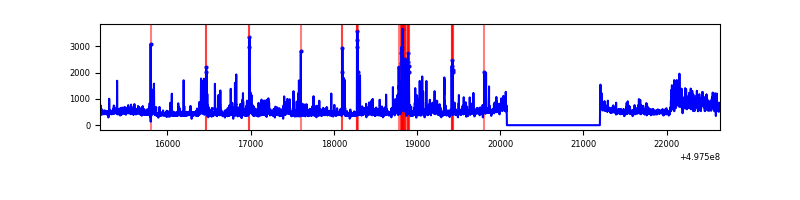 |
| C | 7451 | 6332 | 174 | 174 | 2.34% | 2.75% | 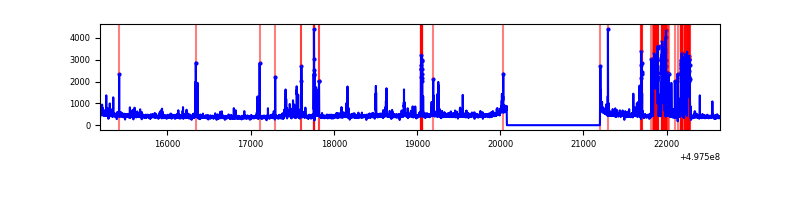 |
| D | 7449 | 6329 | 3512 | 3512 | 47.15% | 55.49% | 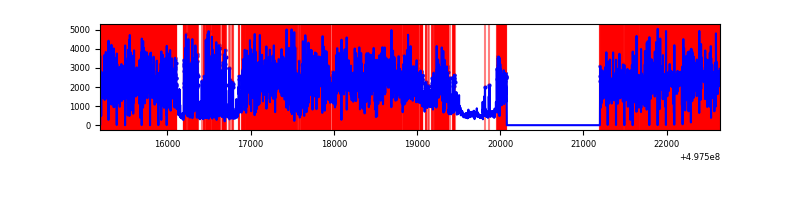 |
Top three noisy pixels from each quadrant. If the there are fewer than three noisy pixels in the level2.evt file, extra rows are filled as -1
| Pixel properties | Quadrant properties | ||||||
|---|---|---|---|---|---|---|---|
| Quadrant | DetID | PixID | Counts | Sigma | Mean | Median | Sigma |
| A | 7 | 29 | 2491831 | 15951.4 | 635 | 619 | 156.2 |
| A | 12 | 17 | 425325 | 2719.42 | 635 | 619 | 156.2 |
| A | 15 | 174 | 218300 | 1393.83 | 635 | 619 | 156.2 |
| B | 5 | 172 | 382713 | 2653.7 | 672 | 651 | 144.0 |
| B | 4 | 171 | 213867 | 1480.94 | 672 | 651 | 144.0 |
| B | 8 | 234 | 85146 | 586.88 | 672 | 651 | 144.0 |
| C | 1 | 241 | 510536 | 2896.17 | 644 | 637 | 176.1 |
| C | 14 | 254 | 67576 | 380.21 | 644 | 637 | 176.1 |
| C | 12 | 2 | 56771 | 318.83 | 644 | 637 | 176.1 |
| D | 8 | 176 | 10869360 | 104627.34 | 360 | 343 | 103.9 |
| D | 3 | 12 | 137073 | 1316.19 | 360 | 343 | 103.9 |
| D | 14 | 52 | 77844 | 746.04 | 360 | 343 | 103.9 |
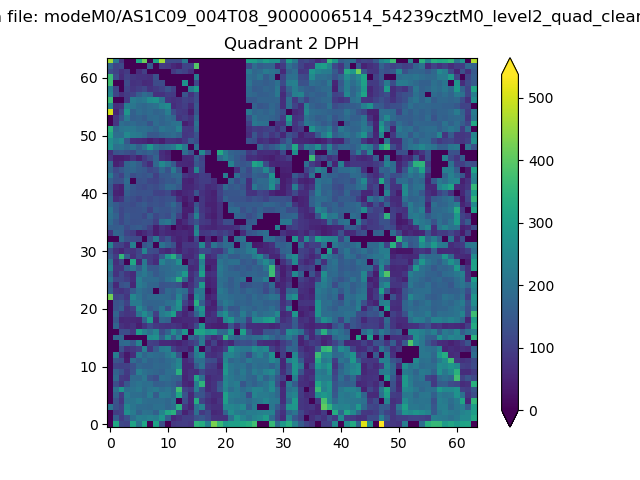
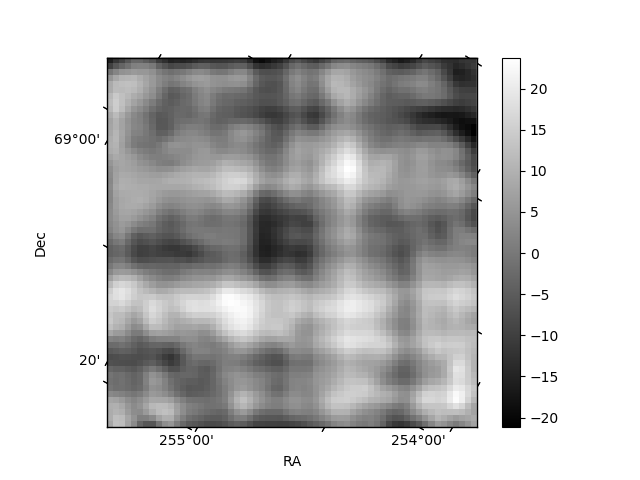
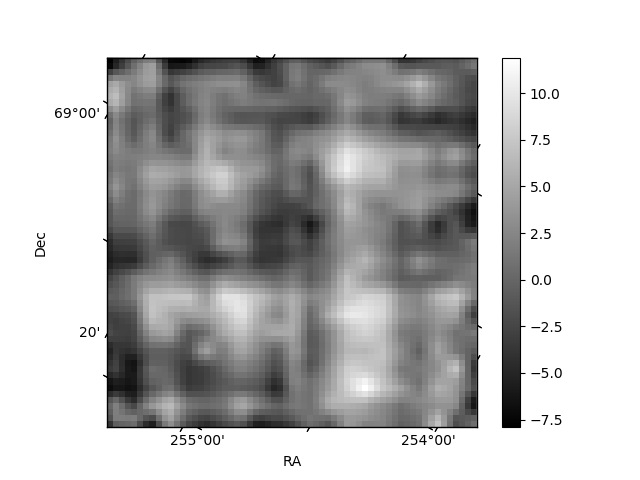
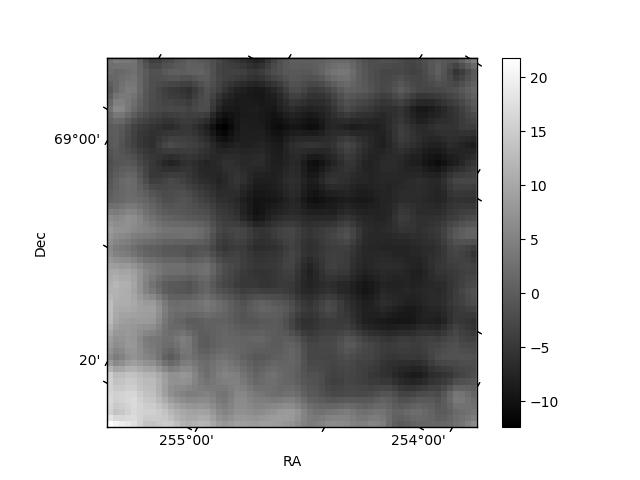
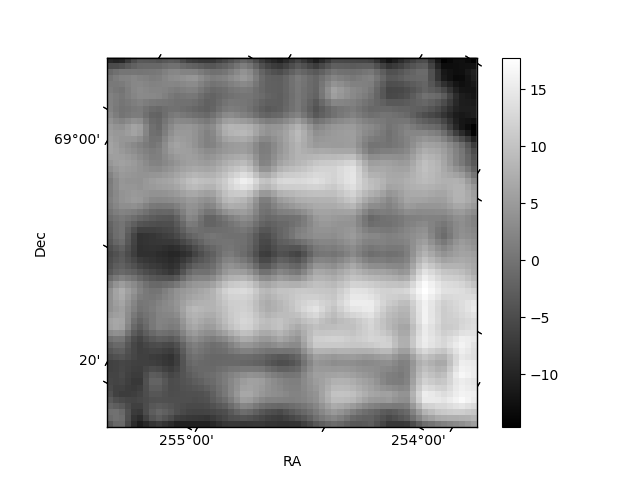
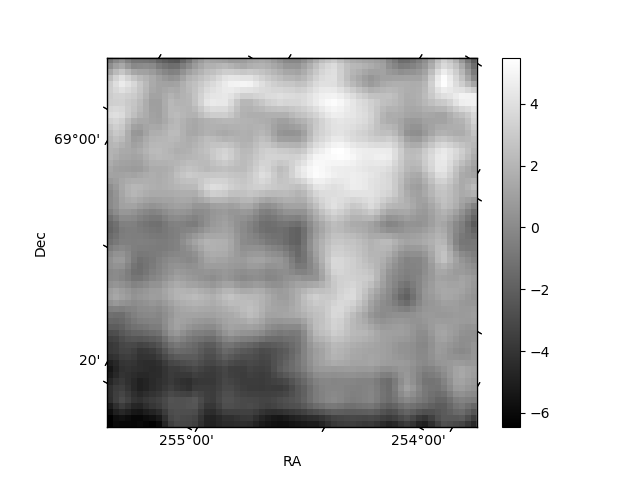
Histogram calculated using DETX and DETY for each event in the final _common_clean file
| Quadrant A | 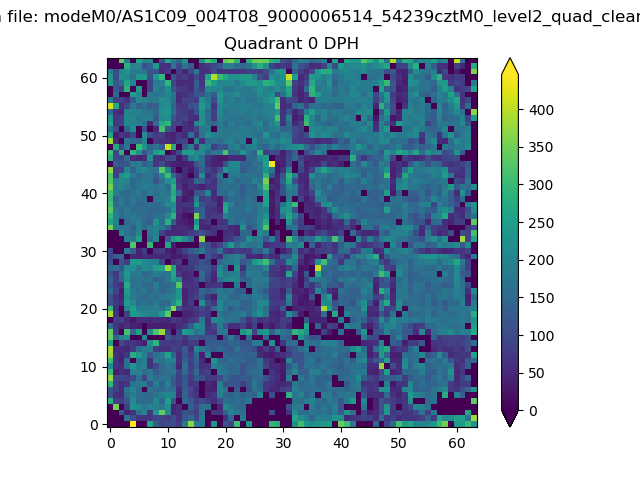 |
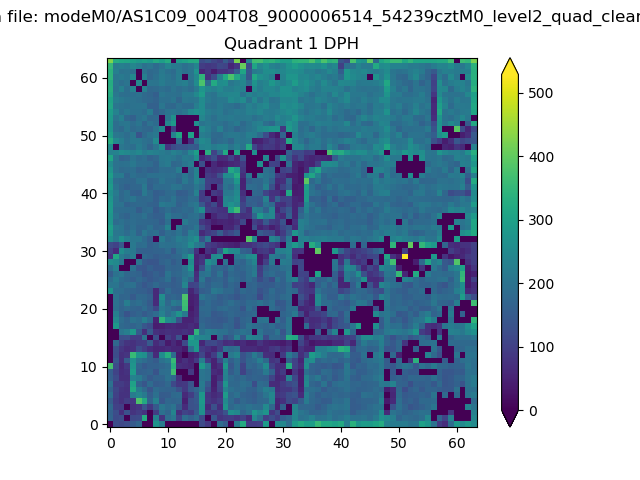 |
Quadrant B |
|---|---|---|---|
| Quadrant D | 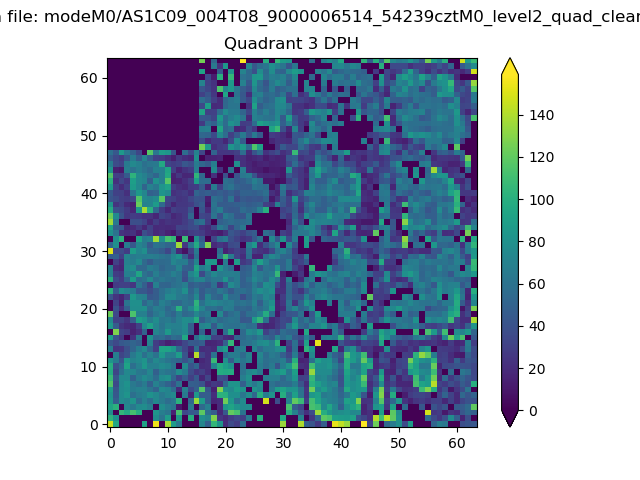 |
 |
Quadrant C |
| Plot type | Count rate plots | Images |
|---|---|---|
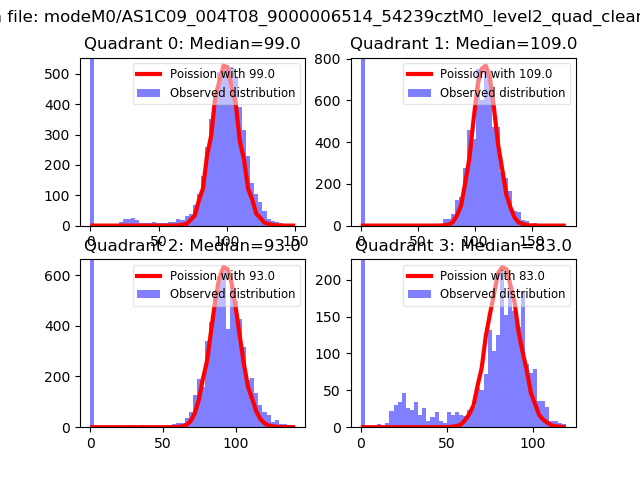
| Comparison with Poisson distribution Blue bars denote a histogram of data divided into 1 sec bins. Red curve is a Poisson curve with rate = median count rate of data. |
 |
 |
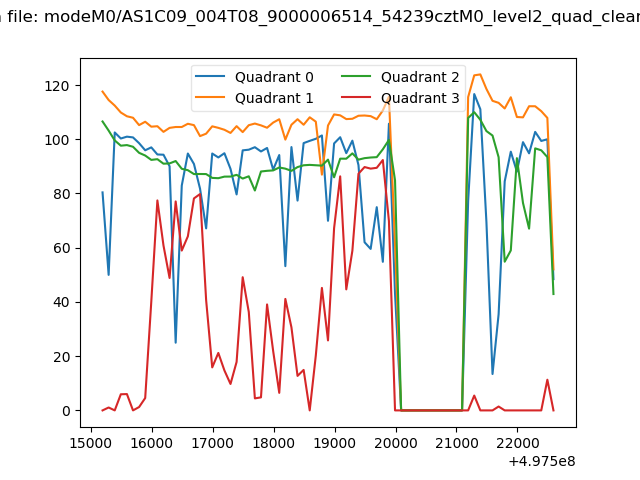
| Quadrant-wise count rates Data is divided into 100 sec bins |
 |
|
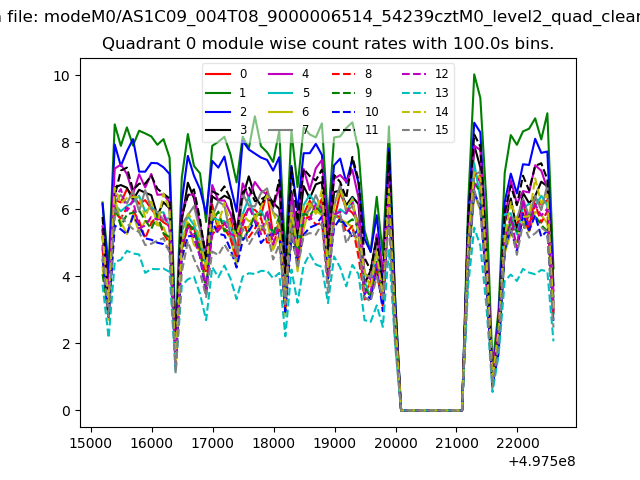
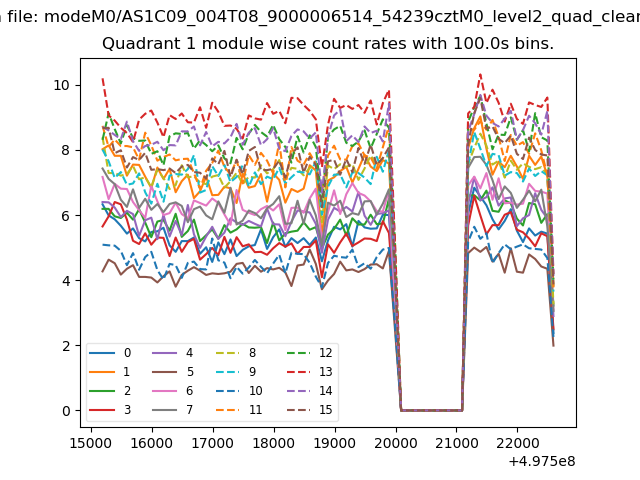
| Module-wise count rates for Quadrant A Data is divided into 100 sec bins |
 |
 |
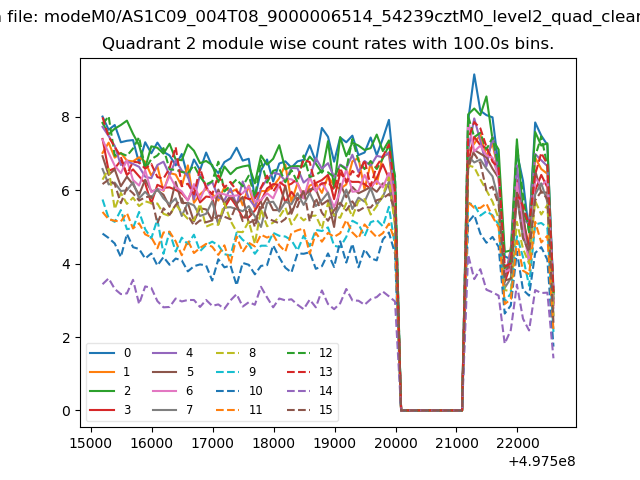
| Module-wise count rates for Quadrant B Data is divided into 100 sec bins |
 |
 |
| Module-wise count rates for Quadrant C Data is divided into 100 sec bins |
 |
 |
| Module-wise count rates for Quadrant D Data is divided into 100 sec bins |
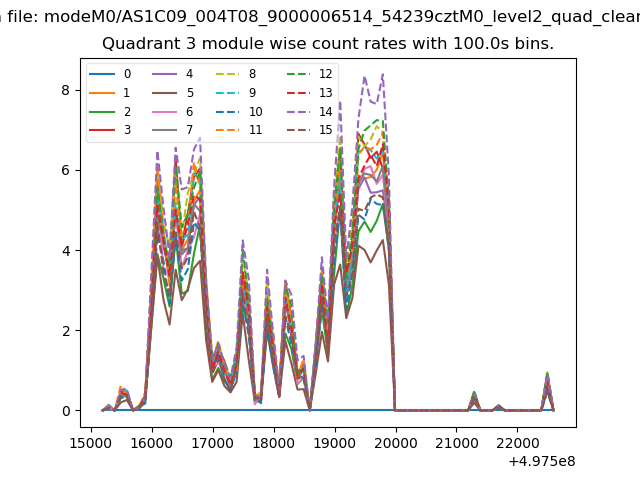 |
 |
| Parameter | Plot |
|---|---|
| CZT HV Monitor | 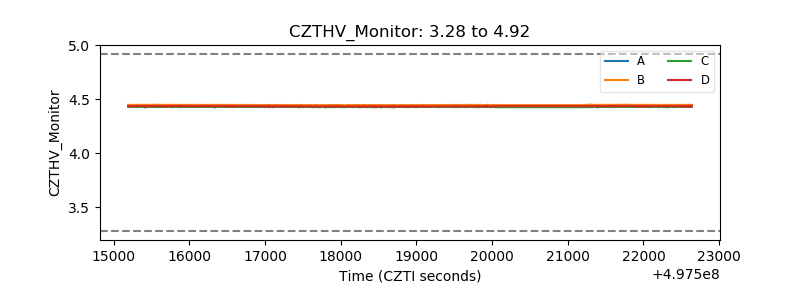 |
| D_VDD | 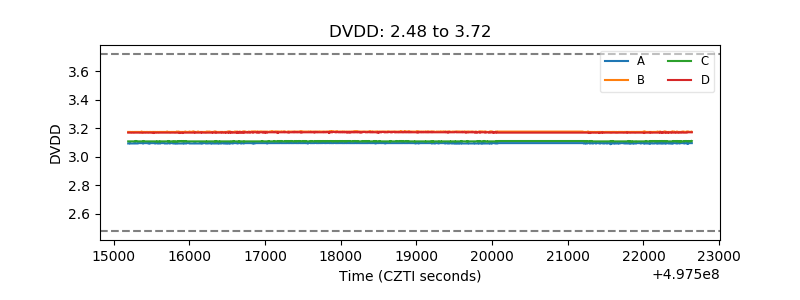 |
| Temperature 1 | 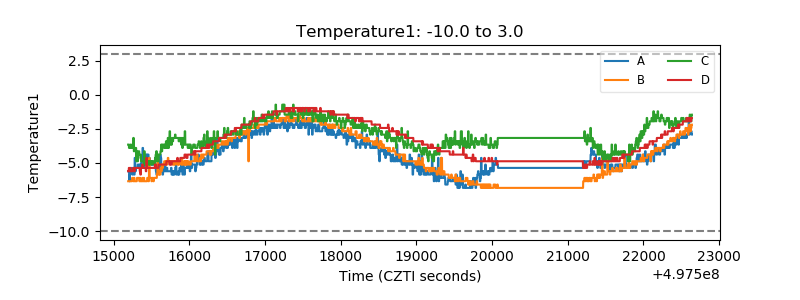 |
| Veto HV Monitor | 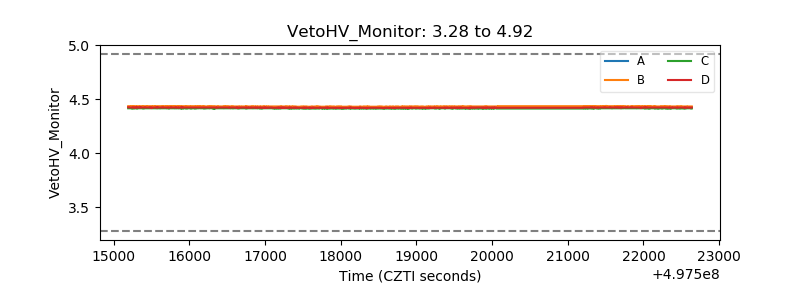 |
| Veto LLD | 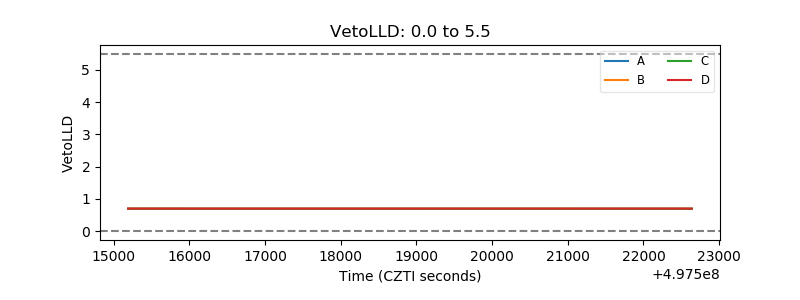 |
| Alpha Counter | 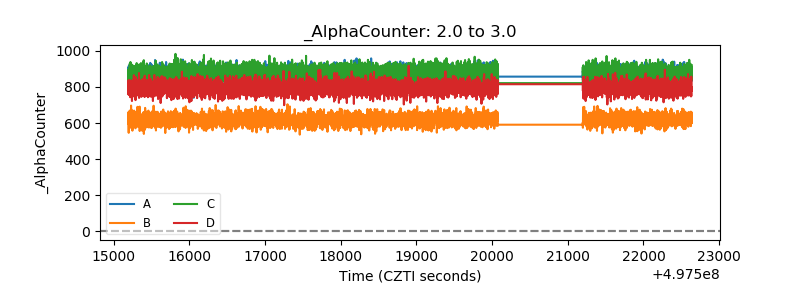 |
| _CPM_Rate | 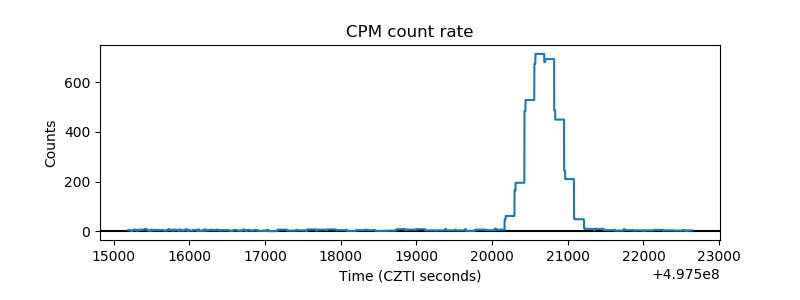 |
| CZT Counter | 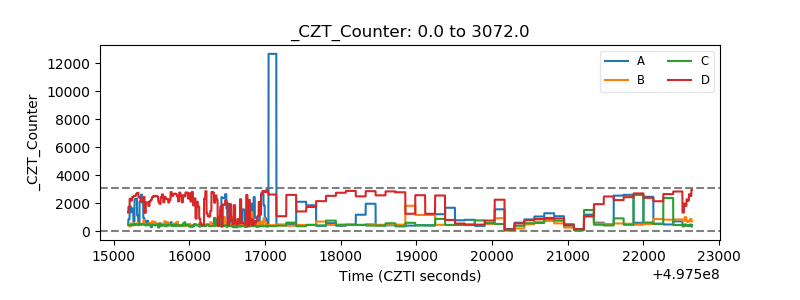 |
| +2.5 Volts monitor |  |
| +5 Volts monitor |  |
| _ROLL_ROT | 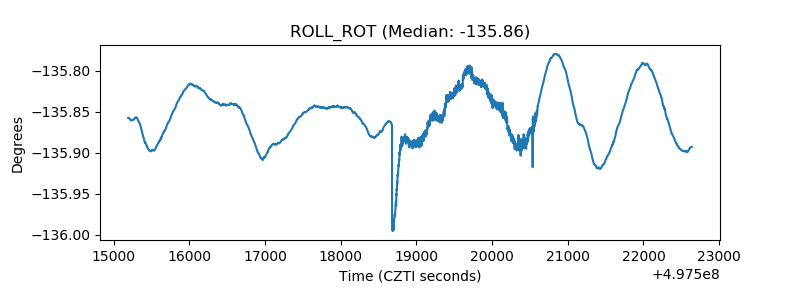 |
| _Roll_DEC | 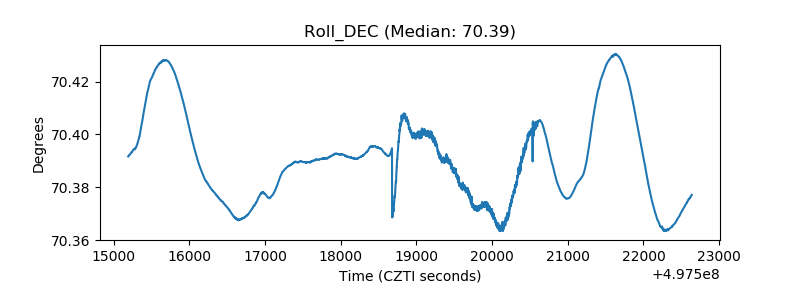 |
| _Roll_RA | 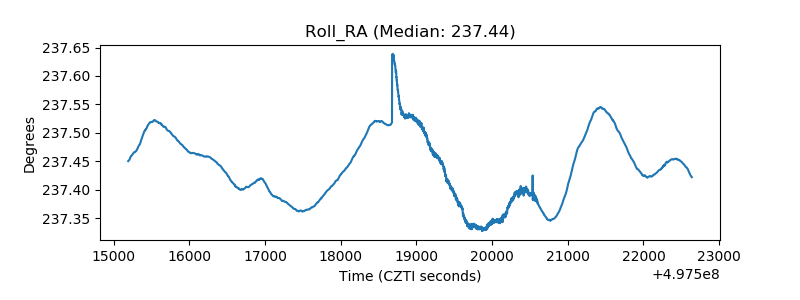 |
| Veto Counter | 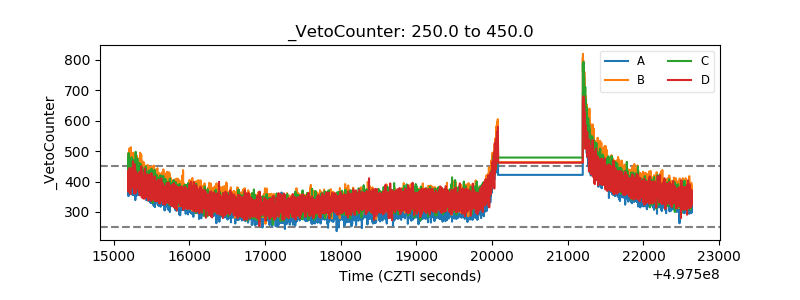 |