| Param | Original file | Final file |
|---|---|---|
| Filename | modeM0/AS1C09_004T08_9000006514_54240cztM0_level2.fits | modeM0/AS1C09_004T08_9000006514_54240cztM0_level2_quad_clean.evt |
| Size (bytes) | 719,398,080 | 78,828,480 |
| Size | 686.1 MB | 75.2 MB |
| Events in quadrant A | 5,113,580 | 575,361 |
| Events in quadrant B | 4,432,388 | 678,631 |
| Events in quadrant C | 4,258,902 | 550,921 |
| Events in quadrant D | 12,335,958 | 142,814 |
| Mode M0 | |||
|---|---|---|---|
| Quadrant | BADHDUFLAG | Total packets | Discarded packets |
| A | 0 | 19467 | 1 |
| B | 0 | 17427 | 1 |
| C | 0 | 17263 | 1 |
| D | 0 | 40967 | 1 |
| Mode M9 | |||
|---|---|---|---|
| Quadrant | BADHDUFLAG | Total packets | Discarded packets |
| A | 0 | 12 | 0 |
| B | 0 | 12 | 0 |
| C | 0 | 12 | 0 |
| D | 0 | 12 | 0 |
| Mode SS | |||
|---|---|---|---|
| Quadrant | BADHDUFLAG | Total packets | Discarded packets |
| A | 0 | 128 | 0 |
| B | 0 | 128 | 0 |
| C | 0 | 128 | 0 |
| D | 0 | 128 | 0 |
| Quadrant | Total seconds | Saturated seconds | Saturation percentage |
|---|---|---|---|
| A | 6291 | 757 | 12.033063% |
| B | 6292 | 189 | 3.003814% |
| C | 6292 | 530 | 8.423395% |
| D | 6292 | 4757 | 75.603942% |
Noise dominated data is calculated using 1-second bins in cleaned event files. If a bin has >2000 counts, and if more than 50% of those come from <1% of pixels, then it is considered to be noise-dominated and hence unusable.
| Quadrant | # 1 sec bins | Bins with >0 counts | Bins with >2000 counts | High rate bins dominated by noise | Noise dominated (total time) | Noise dominated (detector-on time) | Marked lightcurve |
|---|---|---|---|---|---|---|---|
| A | 7421 | 6292 | 491 | 491 | 6.62% | 7.80% | 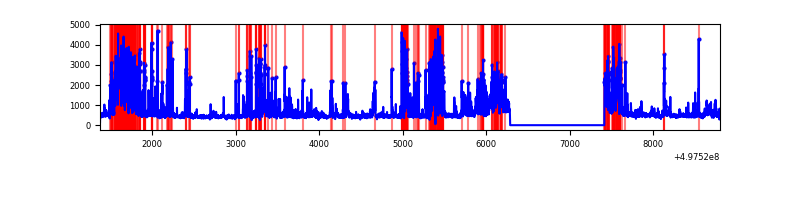 |
| B | 7422 | 6293 | 86 | 86 | 1.16% | 1.37% | 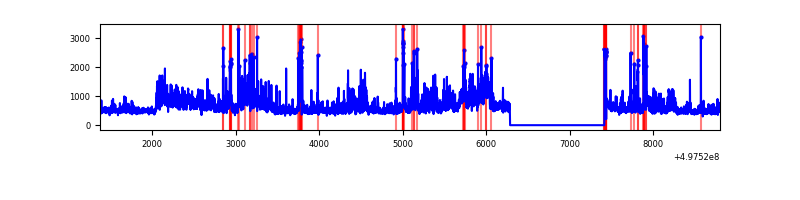 |
| C | 7422 | 6293 | 386 | 386 | 5.20% | 6.13% | 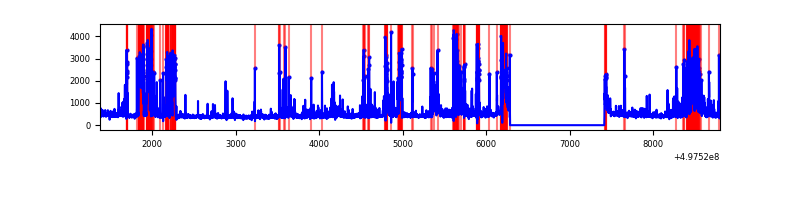 |
| D | 7421 | 6292 | 3616 | 3616 | 48.73% | 57.47% | 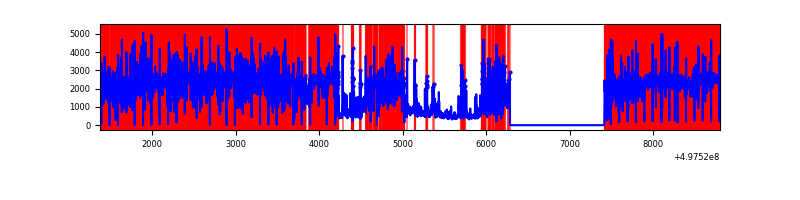 |
Top three noisy pixels from each quadrant. If the there are fewer than three noisy pixels in the level2.evt file, extra rows are filled as -1
| Pixel properties | Quadrant properties | ||||||
|---|---|---|---|---|---|---|---|
| Quadrant | DetID | PixID | Counts | Sigma | Mean | Median | Sigma |
| A | 7 | 29 | 1977411 | 12286.98 | 650 | 634 | 160.9 |
| A | 5 | 243 | 325736 | 2020.72 | 650 | 634 | 160.9 |
| A | 15 | 174 | 106644 | 658.92 | 650 | 634 | 160.9 |
| B | 5 | 172 | 975902 | 6845.17 | 669 | 647 | 142.5 |
| B | 5 | 185 | 229239 | 1604.45 | 669 | 647 | 142.5 |
| B | 4 | 171 | 96983 | 676.17 | 669 | 647 | 142.5 |
| C | 1 | 241 | 506565 | 2940.48 | 626 | 618 | 172.1 |
| C | 15 | 198 | 476288 | 2764.52 | 626 | 618 | 172.1 |
| C | 15 | 215 | 428691 | 2487.89 | 626 | 618 | 172.1 |
| D | 8 | 176 | 9734109 | 122515.59 | 271 | 258 | 79.4 |
| D | 2 | 172 | 912782 | 11485.53 | 271 | 258 | 79.4 |
| D | 3 | 12 | 346057 | 4352.42 | 271 | 258 | 79.4 |
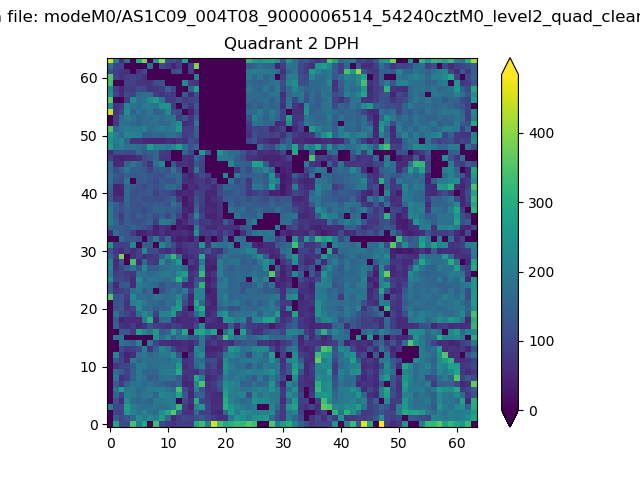
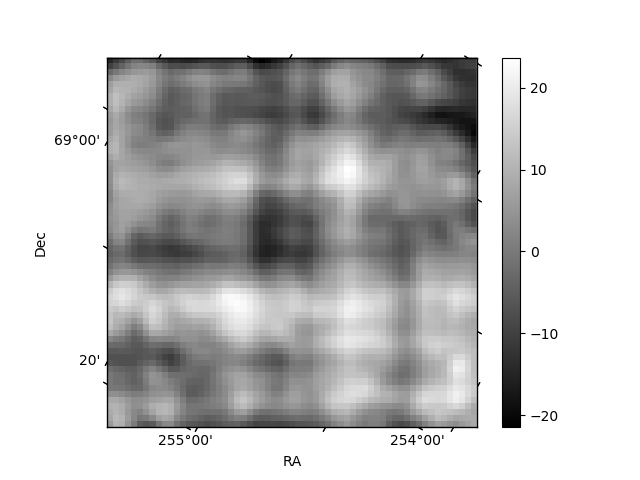
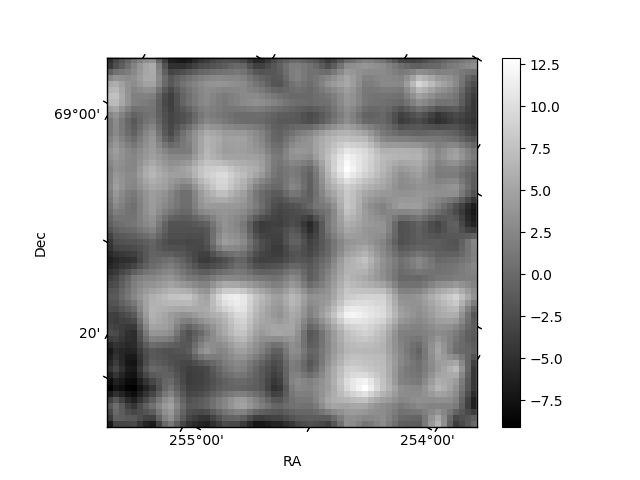
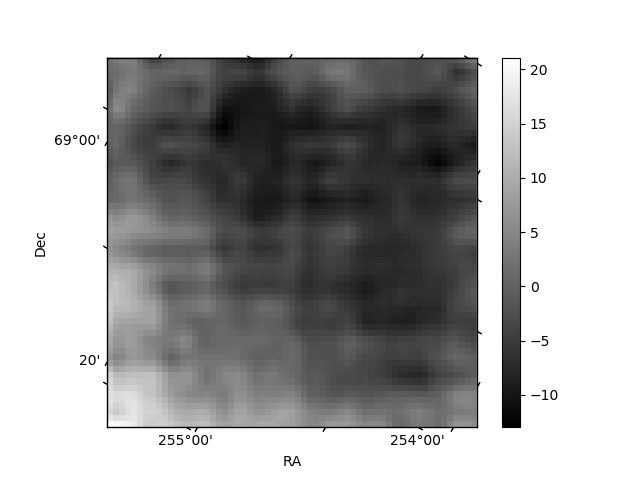
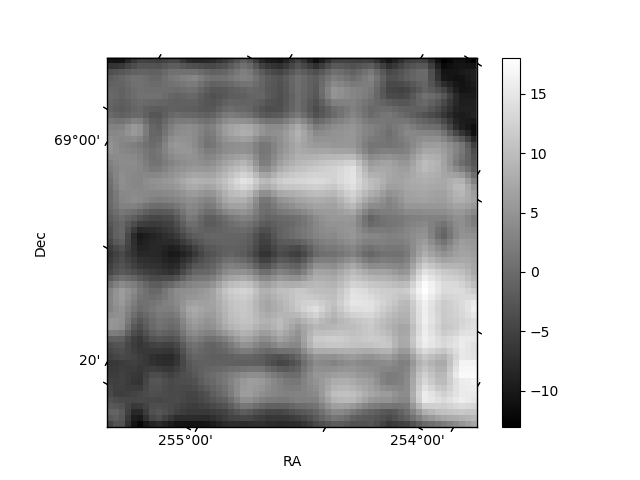
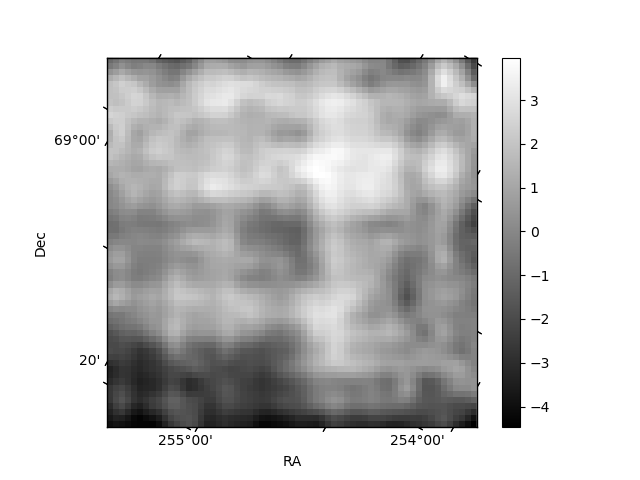
Histogram calculated using DETX and DETY for each event in the final _common_clean file
| Quadrant A | 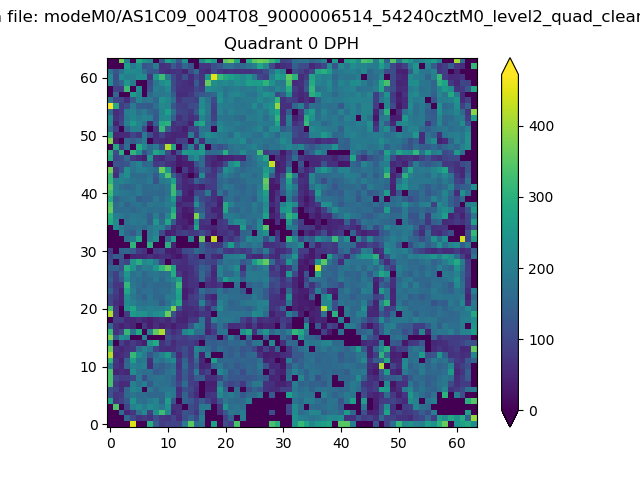 |
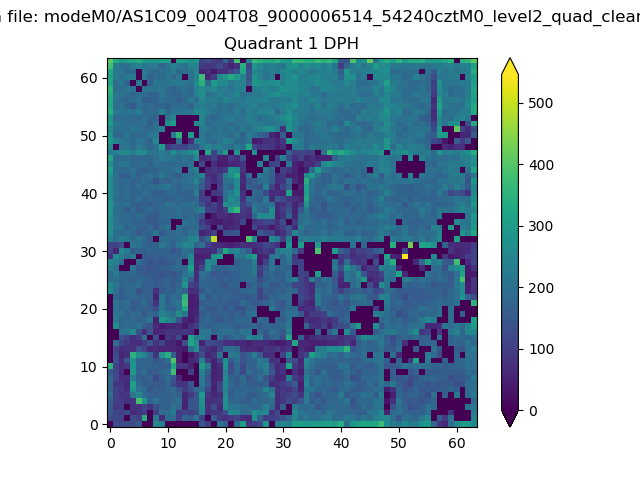 |
Quadrant B |
|---|---|---|---|
| Quadrant D | 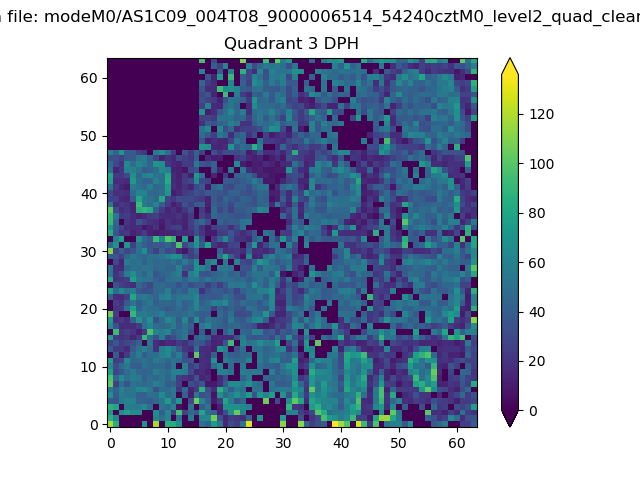 |
 |
Quadrant C |
| Plot type | Count rate plots | Images |
|---|---|---|
| Comparison with Poisson distribution Blue bars denote a histogram of data divided into 1 sec bins. Red curve is a Poisson curve with rate = median count rate of data. |
 |
 |
| Quadrant-wise count rates Data is divided into 100 sec bins |
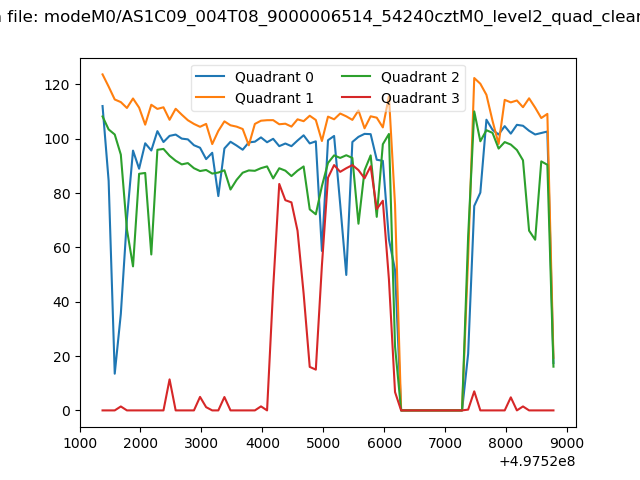 |
|
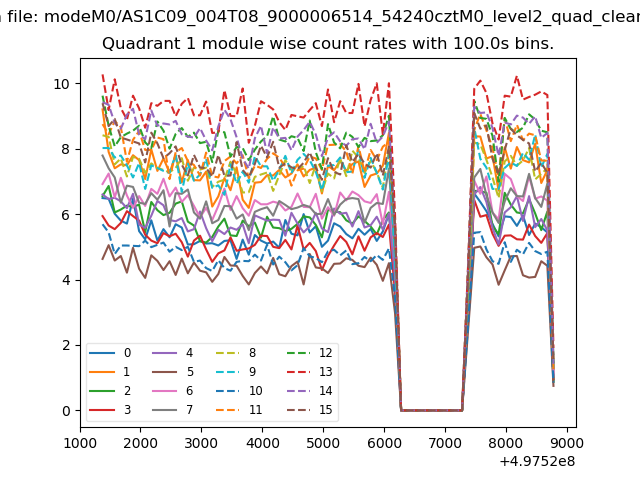
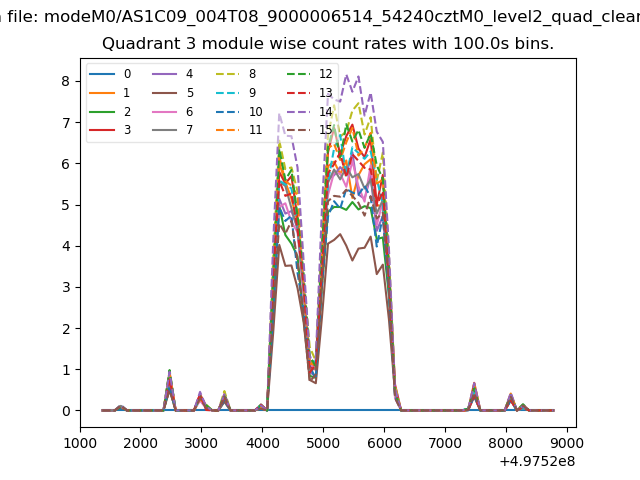
| Module-wise count rates for Quadrant A Data is divided into 100 sec bins |
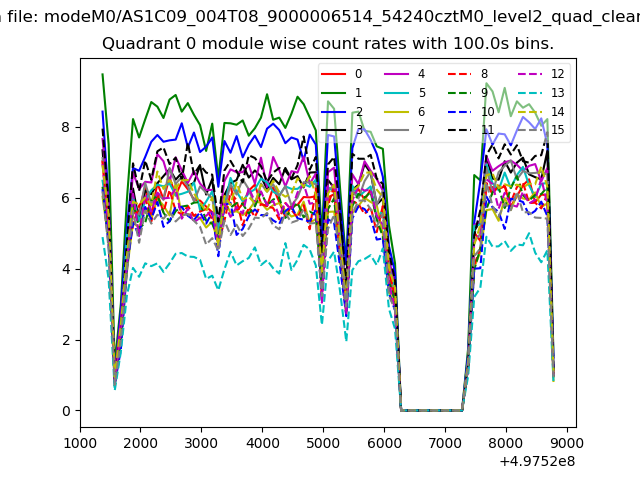 |
 |
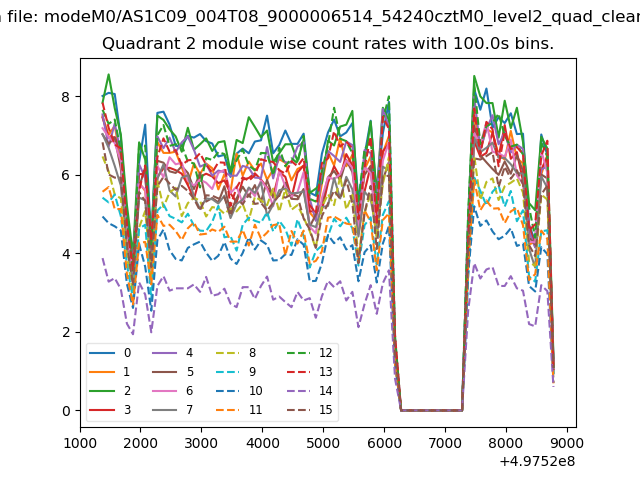
| Module-wise count rates for Quadrant B Data is divided into 100 sec bins |
 |
 |
| Module-wise count rates for Quadrant C Data is divided into 100 sec bins |
 |
 |
| Module-wise count rates for Quadrant D Data is divided into 100 sec bins |
 |
 |
| Parameter | Plot |
|---|---|
| CZT HV Monitor | 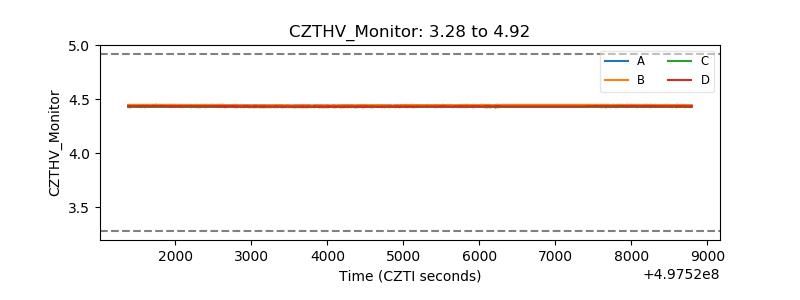 |
| D_VDD | 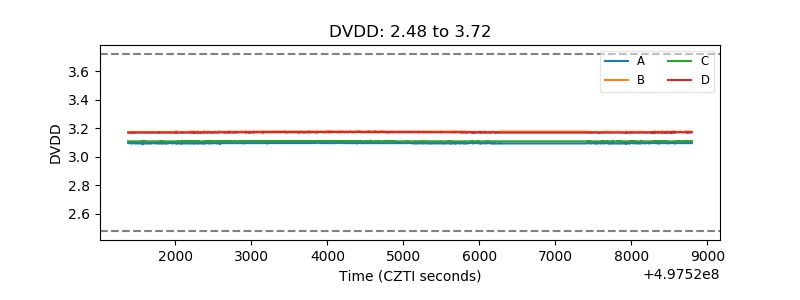 |
| Temperature 1 | 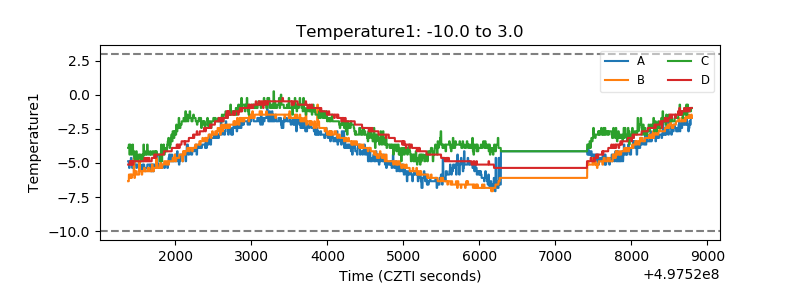 |
| Veto HV Monitor |  |
| Veto LLD | 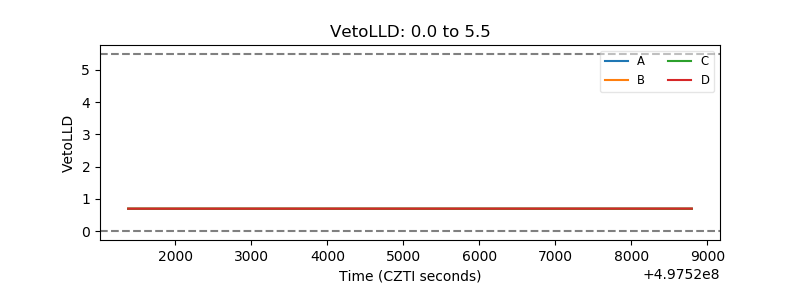 |
| Alpha Counter | 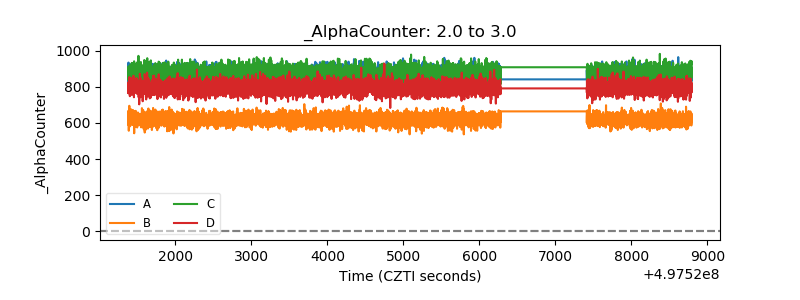 |
| _CPM_Rate | 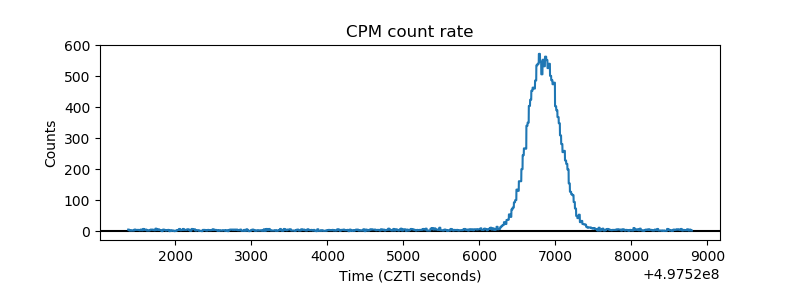 |
| CZT Counter | 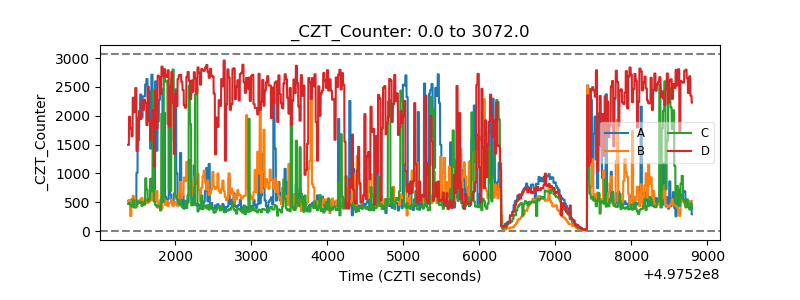 |
| +2.5 Volts monitor |  |
| +5 Volts monitor |  |
| _ROLL_ROT | 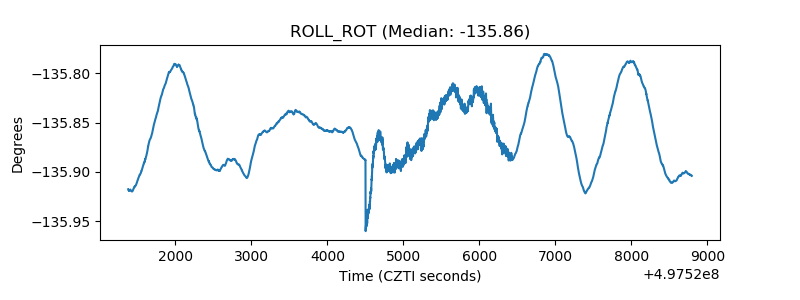 |
| _Roll_DEC | 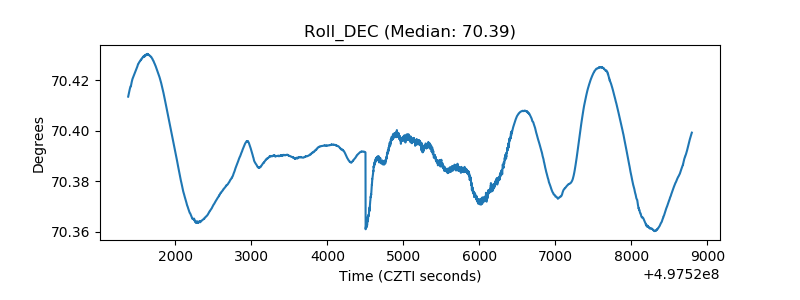 |
| _Roll_RA | 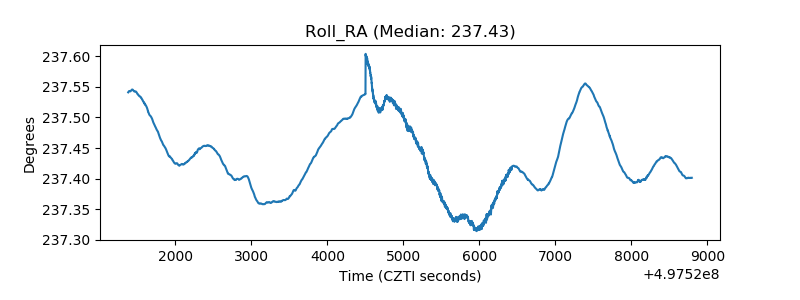 |
| Veto Counter | 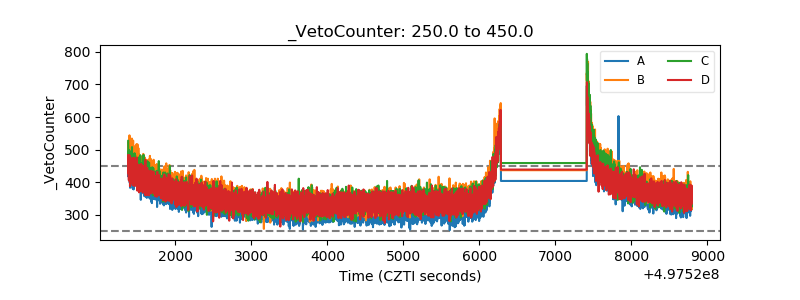 |