| Param | Original file | Final file |
|---|---|---|
| Filename | modeM0/AS1C09_004T08_9000006514_54241cztM0_level2.fits | modeM0/AS1C09_004T08_9000006514_54241cztM0_level2_quad_clean.evt |
| Size (bytes) | 930,185,280 | 72,498,240 |
| Size | 887.1 MB | 69.1 MB |
| Events in quadrant A | 5,723,881 | 588,304 |
| Events in quadrant B | 7,165,387 | 539,330 |
| Events in quadrant C | 8,863,939 | 410,057 |
| Events in quadrant D | 12,173,397 | 201,843 |
| Mode M0 | |||
|---|---|---|---|
| Quadrant | BADHDUFLAG | Total packets | Discarded packets |
| A | 0 | 21497 | 2 |
| B | 0 | 25711 | 2 |
| C | 0 | 30854 | 8 |
| D | 0 | 40644 | 2 |
| Mode M9 | |||
|---|---|---|---|
| Quadrant | BADHDUFLAG | Total packets | Discarded packets |
| A | 0 | 11 | 0 |
| B | 0 | 11 | 0 |
| C | 0 | 11 | 0 |
| D | 0 | 11 | 0 |
| Mode SS | |||
|---|---|---|---|
| Quadrant | BADHDUFLAG | Total packets | Discarded packets |
| A | 0 | 132 | 0 |
| B | 0 | 132 | 0 |
| C | 0 | 132 | 0 |
| D | 0 | 132 | 0 |
| Quadrant | Total seconds | Saturated seconds | Saturation percentage |
|---|---|---|---|
| A | 6531 | 888 | 13.596693% |
| B | 6532 | 1596 | 24.433558% |
| C | 6531 | 2375 | 36.365028% |
| D | 6531 | 4406 | 67.462869% |
Noise dominated data is calculated using 1-second bins in cleaned event files. If a bin has >2000 counts, and if more than 50% of those come from <1% of pixels, then it is considered to be noise-dominated and hence unusable.
| Quadrant | # 1 sec bins | Bins with >0 counts | Bins with >2000 counts | High rate bins dominated by noise | Noise dominated (total time) | Noise dominated (detector-on time) | Marked lightcurve |
|---|---|---|---|---|---|---|---|
| A | 7596 | 6533 | 638 | 638 | 8.40% | 9.77% | 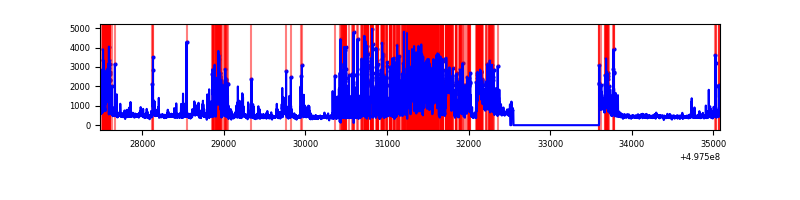 |
| B | 7596 | 6533 | 1487 | 1487 | 19.58% | 22.76% | 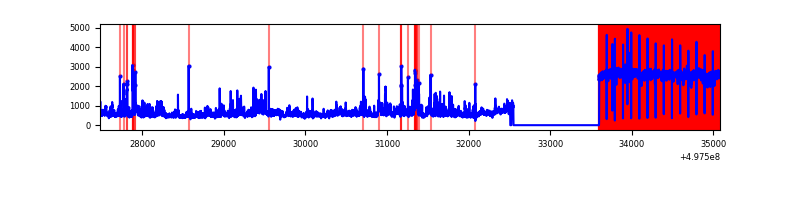 |
| C | 7595 | 6531 | 1975 | 1975 | 26.00% | 30.24% | 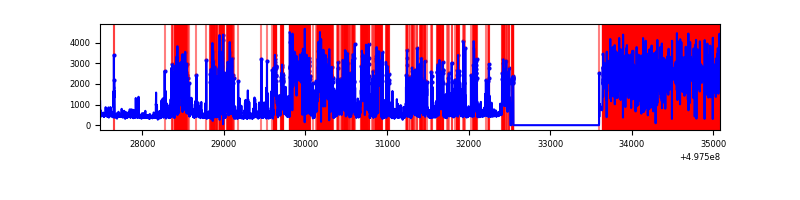 |
| D | 7596 | 6532 | 3357 | 3357 | 44.19% | 51.39% | 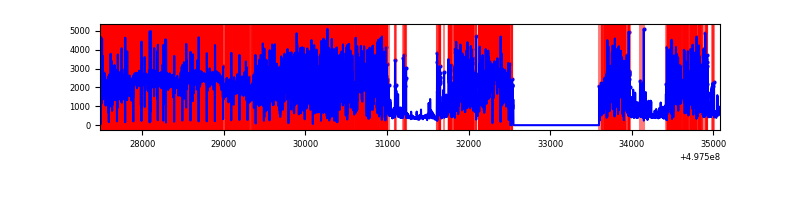 |
Top three noisy pixels from each quadrant. If the there are fewer than three noisy pixels in the level2.evt file, extra rows are filled as -1
| Pixel properties | Quadrant properties | ||||||
|---|---|---|---|---|---|---|---|
| Quadrant | DetID | PixID | Counts | Sigma | Mean | Median | Sigma |
| A | 7 | 29 | 2233505 | 13342.44 | 676 | 657 | 167.3 |
| A | 5 | 243 | 408085 | 2434.6 | 676 | 657 | 167.3 |
| A | 15 | 174 | 286485 | 1707.97 | 676 | 657 | 167.3 |
| B | 5 | 172 | 4323367 | 36615.72 | 553 | 534 | 118.1 |
| B | 5 | 185 | 154784 | 1306.54 | 553 | 534 | 118.1 |
| B | 4 | 171 | 127583 | 1076.14 | 553 | 534 | 118.1 |
| C | 1 | 29 | 4002010 | 26639.07 | 540 | 533 | 150.2 |
| C | 1 | 241 | 1700013 | 11313.96 | 540 | 533 | 150.2 |
| C | 15 | 215 | 739048 | 4916.52 | 540 | 533 | 150.2 |
| D | 8 | 176 | 10355302 | 105031.31 | 341 | 325 | 98.6 |
| D | 8 | 160 | 133330 | 1349.08 | 341 | 325 | 98.6 |
| D | 3 | 12 | 86229 | 871.33 | 341 | 325 | 98.6 |
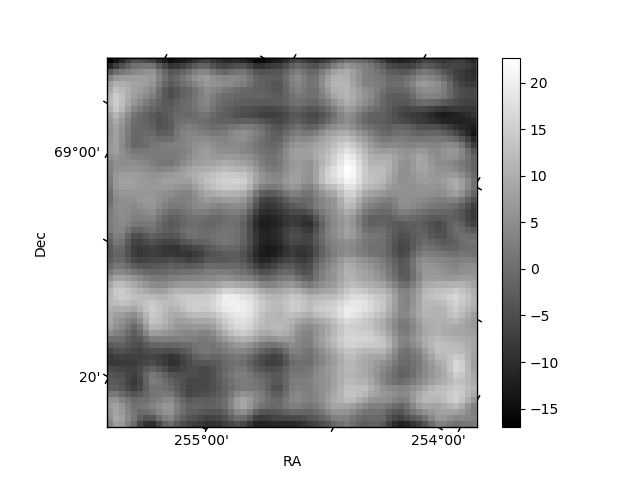
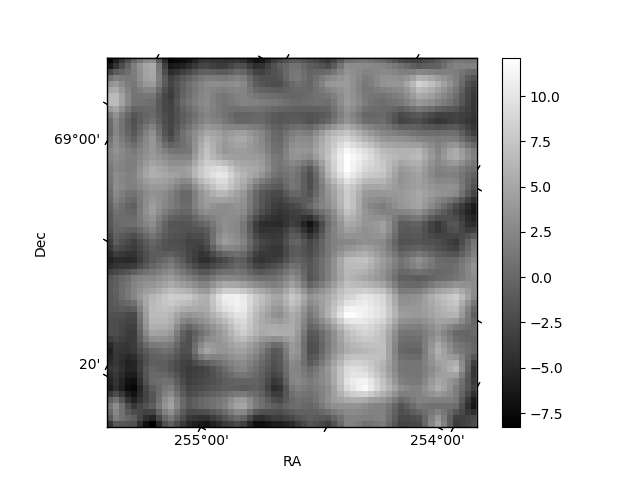
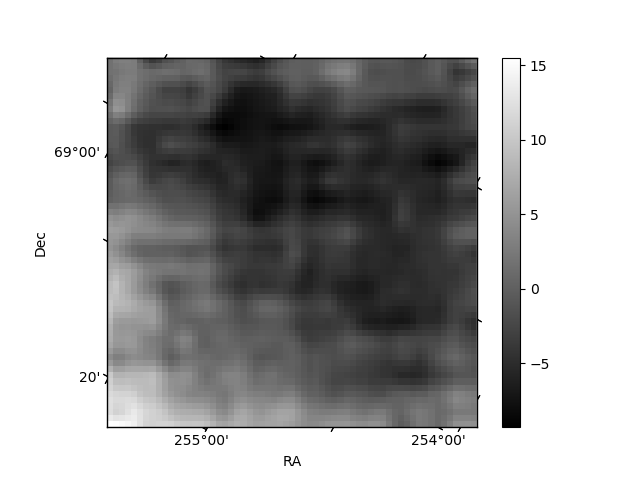
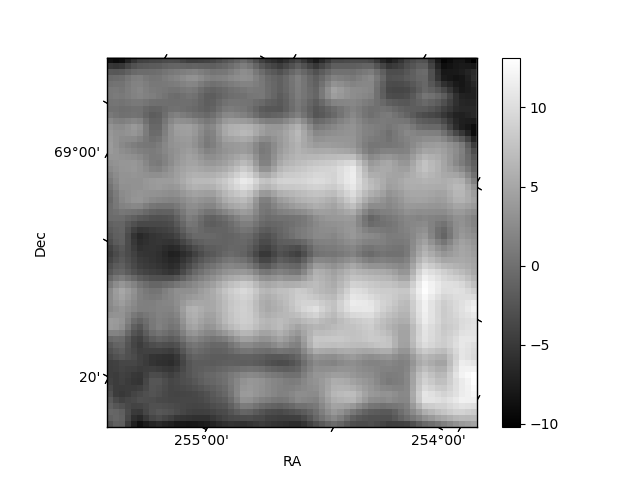
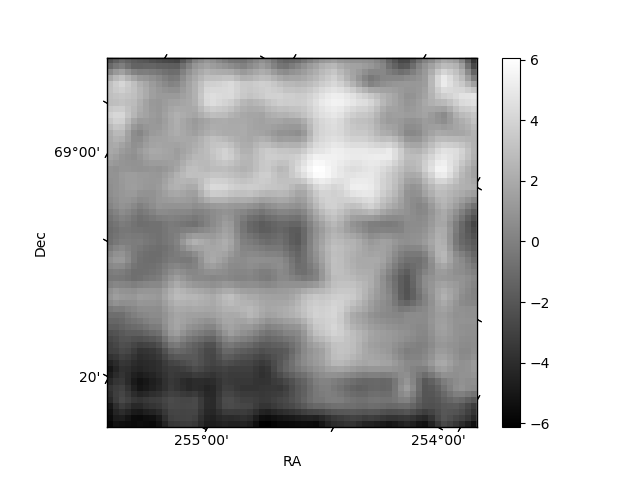
Histogram calculated using DETX and DETY for each event in the final _common_clean file
| Quadrant A | 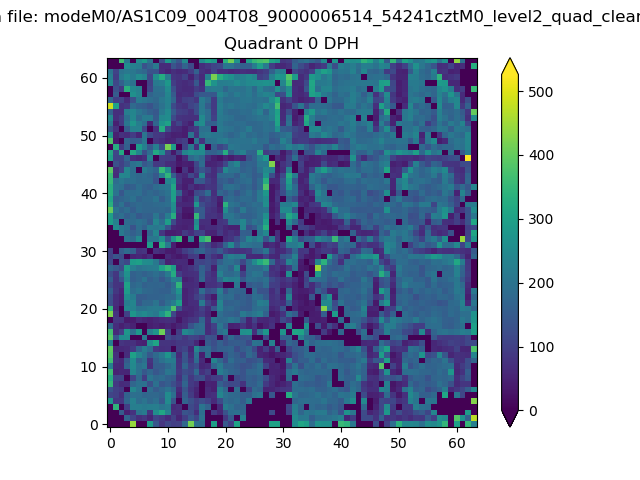 |
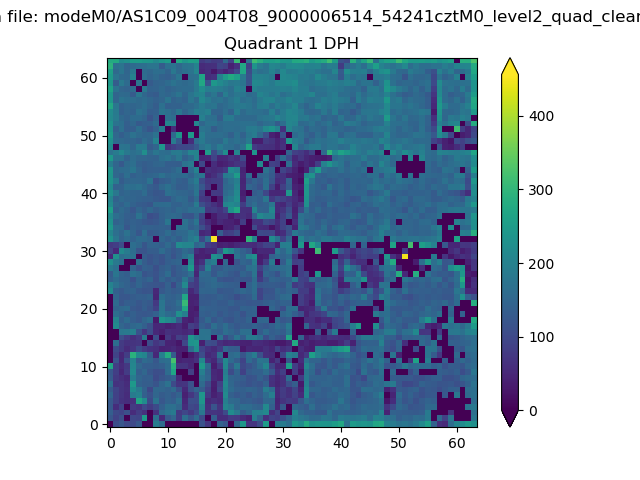 |
Quadrant B |
|---|---|---|---|
| Quadrant D | 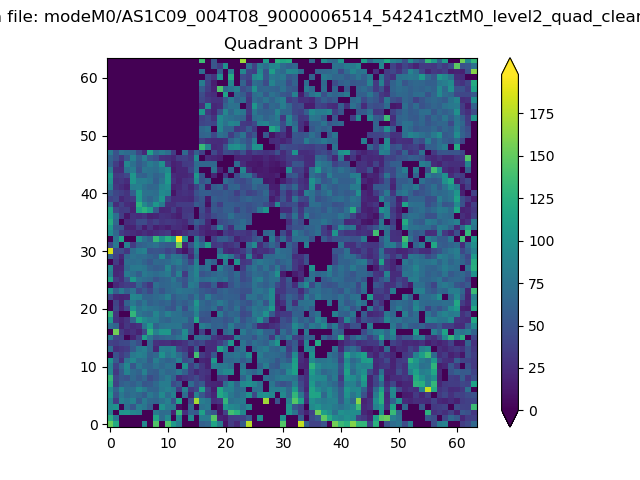 |
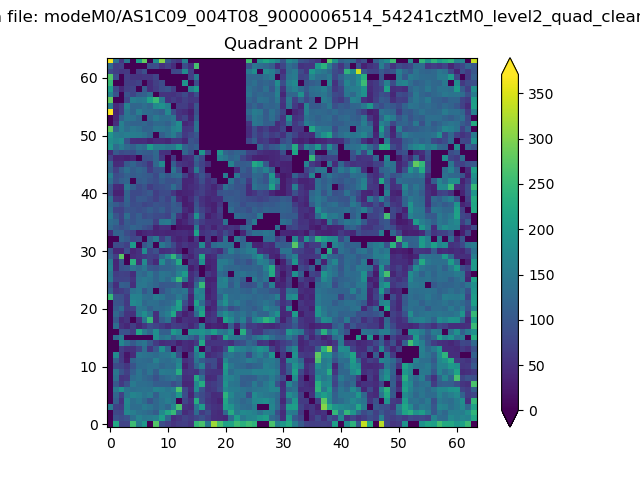 |
Quadrant C |
| Plot type | Count rate plots | Images |
|---|---|---|
| Comparison with Poisson distribution Blue bars denote a histogram of data divided into 1 sec bins. Red curve is a Poisson curve with rate = median count rate of data. |
 |
 |
| Quadrant-wise count rates Data is divided into 100 sec bins |
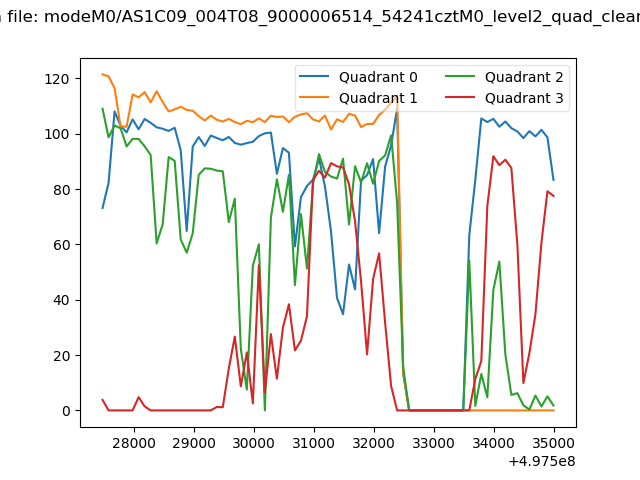 |
|
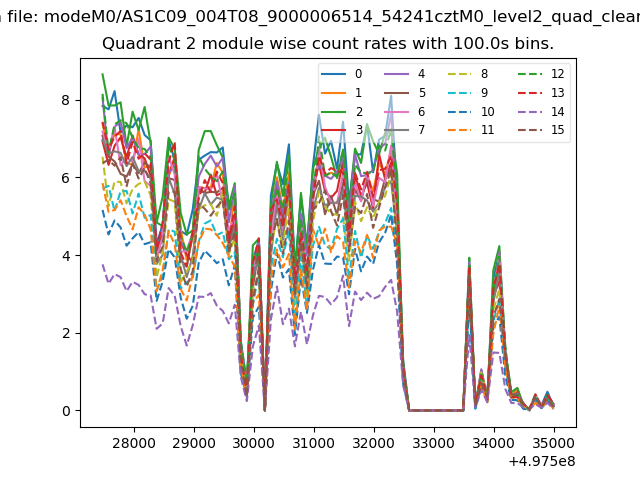
| Module-wise count rates for Quadrant A Data is divided into 100 sec bins |
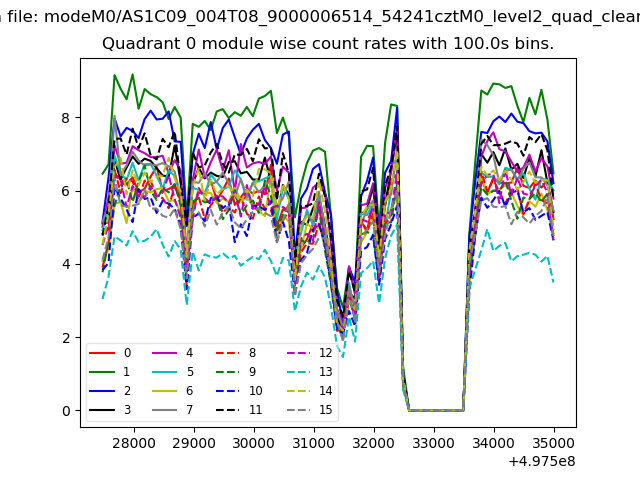 |
 |
| Module-wise count rates for Quadrant B Data is divided into 100 sec bins |
 |
 |
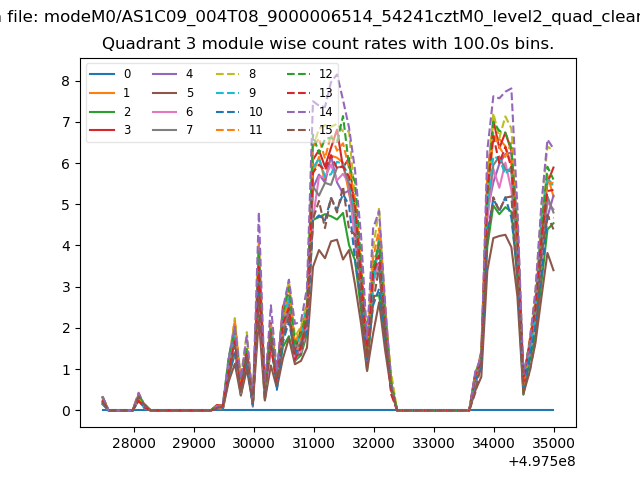
| Module-wise count rates for Quadrant C Data is divided into 100 sec bins |
 |
 |
| Module-wise count rates for Quadrant D Data is divided into 100 sec bins |
 |
 |
| Parameter | Plot |
|---|---|
| CZT HV Monitor | 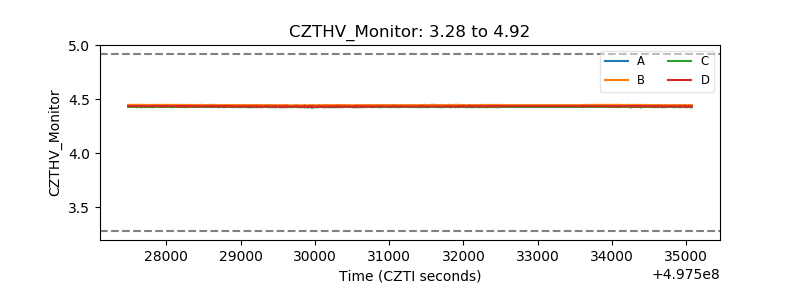 |
| D_VDD | 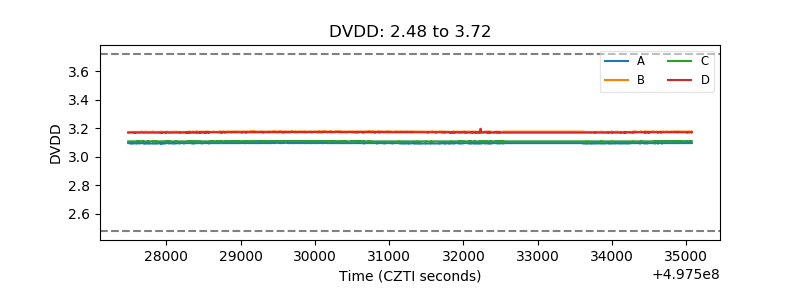 |
| Temperature 1 | 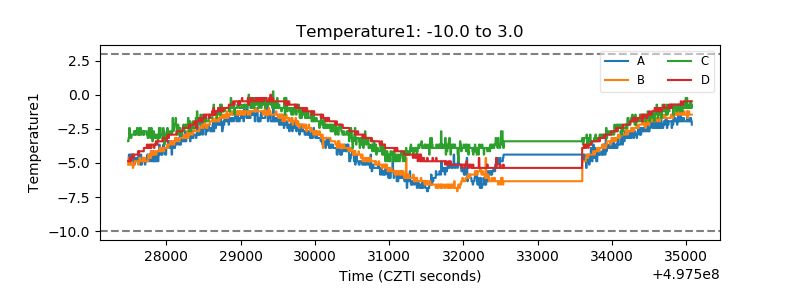 |
| Veto HV Monitor | 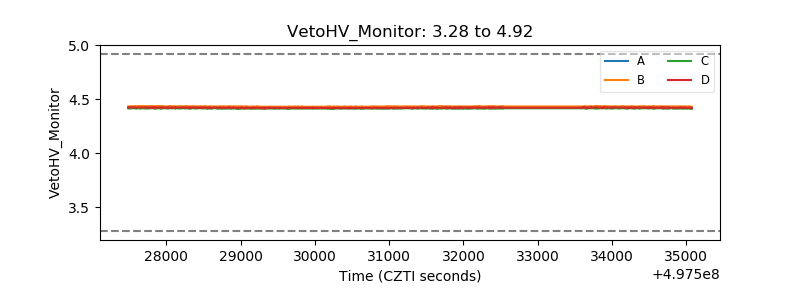 |
| Veto LLD | 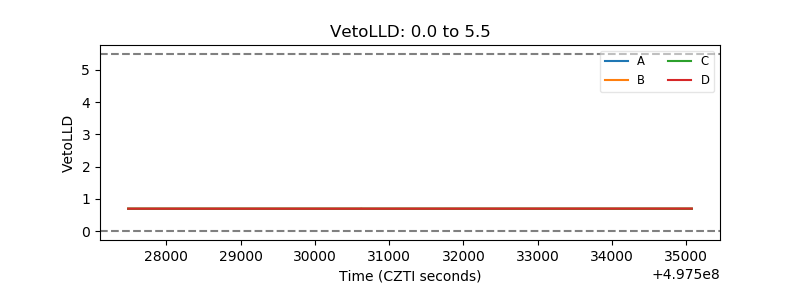 |
| Alpha Counter | 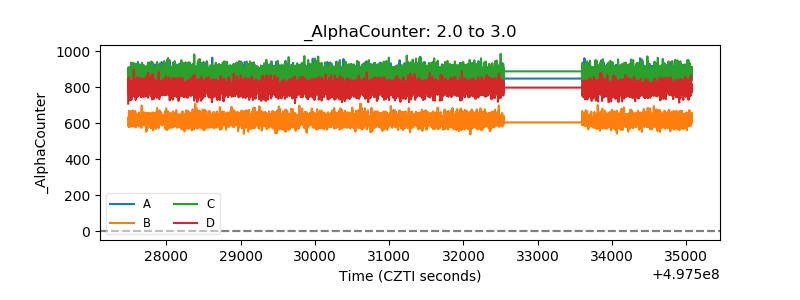 |
| _CPM_Rate |  |
| CZT Counter | 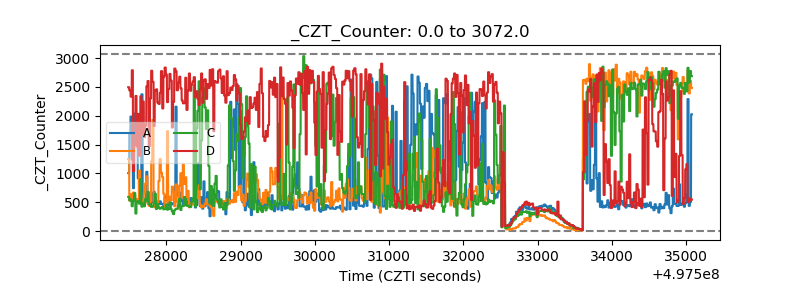 |
| +2.5 Volts monitor |  |
| +5 Volts monitor | 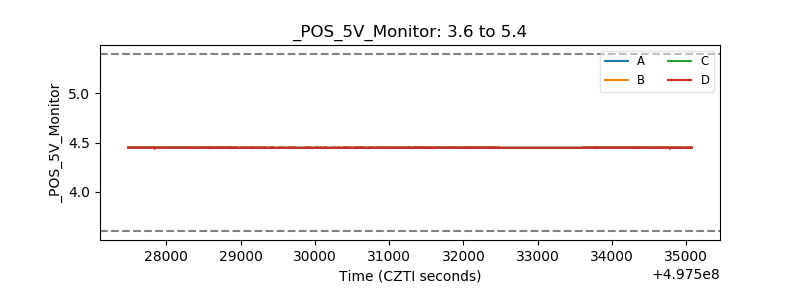 |
| _ROLL_ROT | 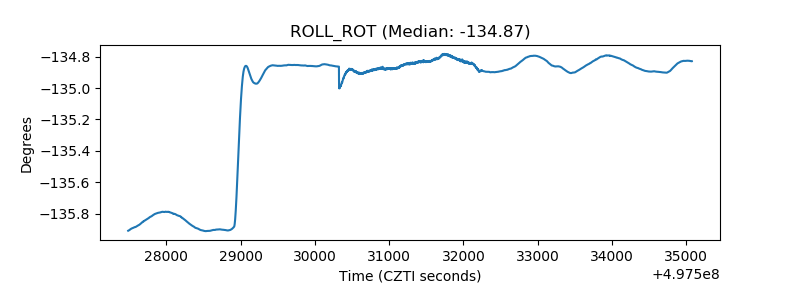 |
| _Roll_DEC | 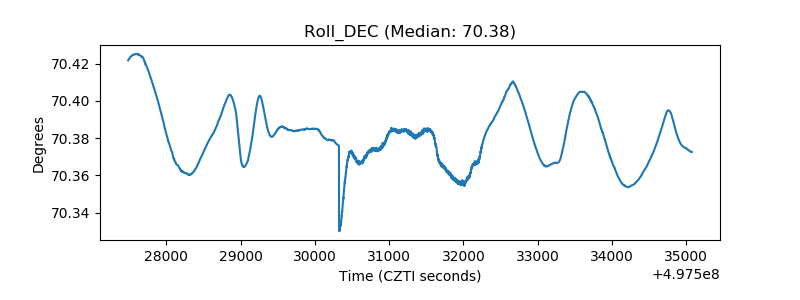 |
| _Roll_RA |  |
| Veto Counter | 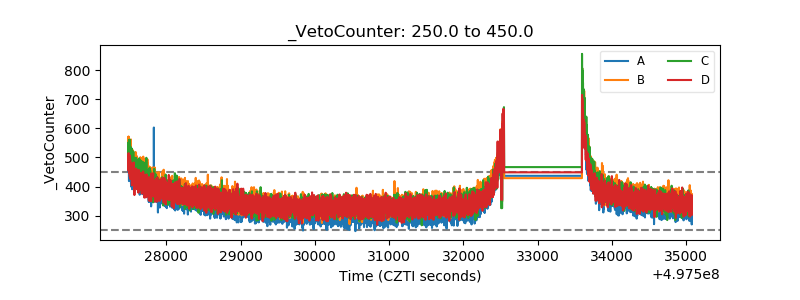 |