| Param | Original file | Final file |
|---|---|---|
| Filename | modeM0/AS1C09_004T08_9000006514_54242cztM0_level2.fits | modeM0/AS1C09_004T08_9000006514_54242cztM0_level2_quad_clean.evt |
| Size (bytes) | 1,385,438,400 | 59,175,360 |
| Size | 1.3 GB | 56.4 MB |
| Events in quadrant A | 5,778,682 | 628,134 |
| Events in quadrant B | 17,303,035 | 52,704 |
| Events in quadrant C | 16,214,089 | 266,782 |
| Events in quadrant D | 11,472,327 | 367,961 |
| Mode M0 | |||
|---|---|---|---|
| Quadrant | BADHDUFLAG | Total packets | Discarded packets |
| A | 0 | 21877 | 0 |
| B | 0 | 56051 | 0 |
| C | 0 | 52671 | 0 |
| D | 0 | 38773 | 0 |
| Mode M9 | |||
|---|---|---|---|
| Quadrant | BADHDUFLAG | Total packets | Discarded packets |
| A | 0 | 9 | 0 |
| B | 0 | 9 | 0 |
| C | 0 | 9 | 0 |
| D | 0 | 9 | 0 |
| Mode SS | |||
|---|---|---|---|
| Quadrant | BADHDUFLAG | Total packets | Discarded packets |
| A | 0 | 136 | 0 |
| B | 0 | 136 | 0 |
| C | 0 | 136 | 0 |
| D | 0 | 136 | 0 |
| Quadrant | Total seconds | Saturated seconds | Saturation percentage |
|---|---|---|---|
| A | 6716 | 854 | 12.715902% |
| B | 6716 | 6716 | 100.000000% |
| C | 6715 | 5785 | 86.150410% |
| D | 6716 | 3577 | 53.260870% |
Noise dominated data is calculated using 1-second bins in cleaned event files. If a bin has >2000 counts, and if more than 50% of those come from <1% of pixels, then it is considered to be noise-dominated and hence unusable.
| Quadrant | # 1 sec bins | Bins with >0 counts | Bins with >2000 counts | High rate bins dominated by noise | Noise dominated (total time) | Noise dominated (detector-on time) | Marked lightcurve |
|---|---|---|---|---|---|---|---|
| A | 7581 | 6717 | 628 | 628 | 8.28% | 9.35% | 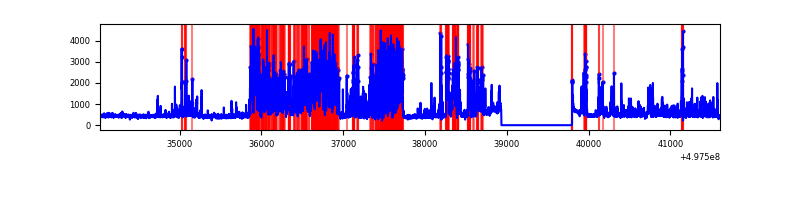 |
| B | 7580 | 6715 | 6600 | 6600 | 87.07% | 98.29% | 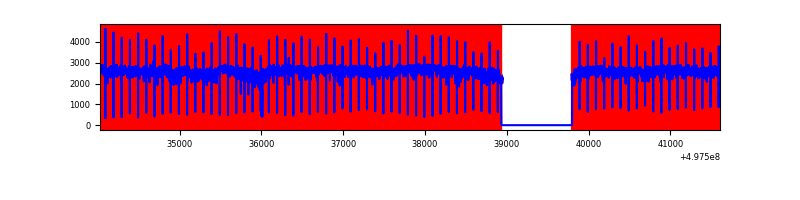 |
| C | 7579 | 6714 | 5313 | 5313 | 70.10% | 79.13% | 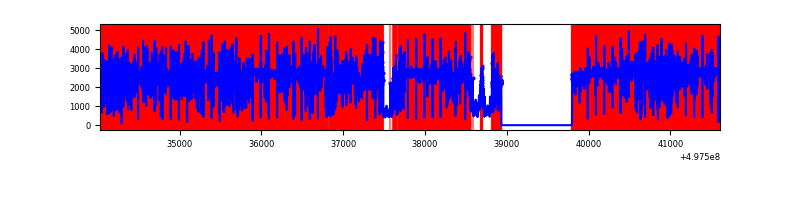 |
| D | 7580 | 6715 | 2895 | 2895 | 38.19% | 43.11% | 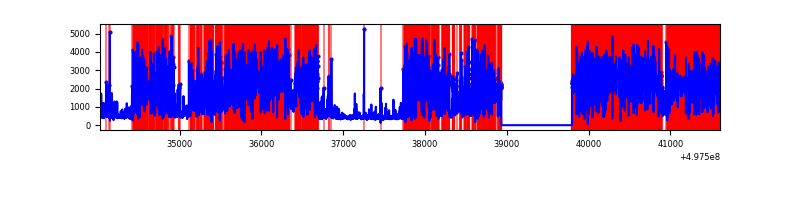 |
Top three noisy pixels from each quadrant. If the there are fewer than three noisy pixels in the level2.evt file, extra rows are filled as -1
| Pixel properties | Quadrant properties | ||||||
|---|---|---|---|---|---|---|---|
| Quadrant | DetID | PixID | Counts | Sigma | Mean | Median | Sigma |
| A | 7 | 29 | 2802005 | 16598.28 | 683 | 667 | 168.8 |
| A | 15 | 174 | 140265 | 827.14 | 683 | 667 | 168.8 |
| A | 13 | 248 | 34010 | 197.56 | 683 | 667 | 168.8 |
| B | 5 | 172 | 16896546 | 1026338.43 | 70 | 68 | 16.5 |
| B | 5 | 236 | 45075 | 2733.85 | 70 | 68 | 16.5 |
| B | 4 | 171 | 22341 | 1352.92 | 70 | 68 | 16.5 |
| C | 1 | 241 | 9792208 | 114371.94 | 308 | 303 | 85.6 |
| C | 1 | 29 | 4903498 | 57270.56 | 308 | 303 | 85.6 |
| C | 12 | 252 | 121275 | 1412.98 | 308 | 303 | 85.6 |
| D | 8 | 176 | 9365073 | 74498.36 | 446 | 427 | 125.7 |
| D | 8 | 160 | 64027 | 505.96 | 446 | 427 | 125.7 |
| D | 10 | 181 | 63462 | 501.46 | 446 | 427 | 125.7 |
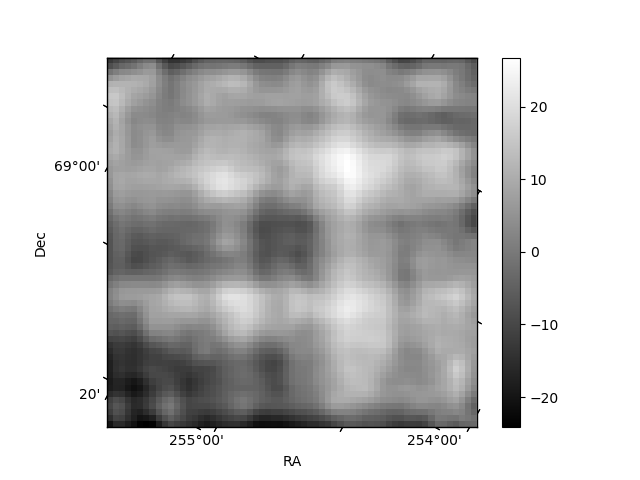
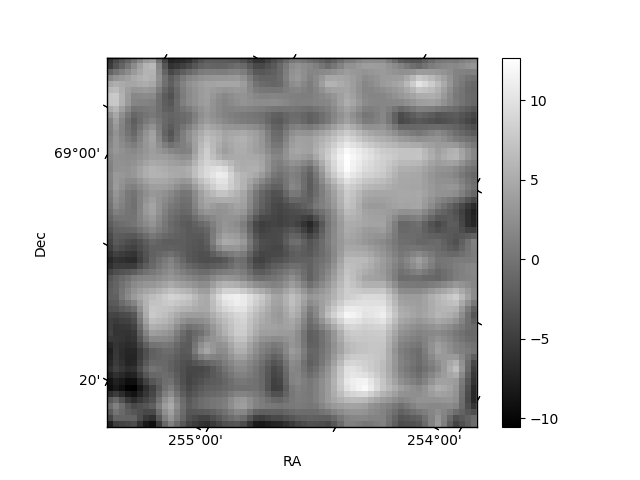
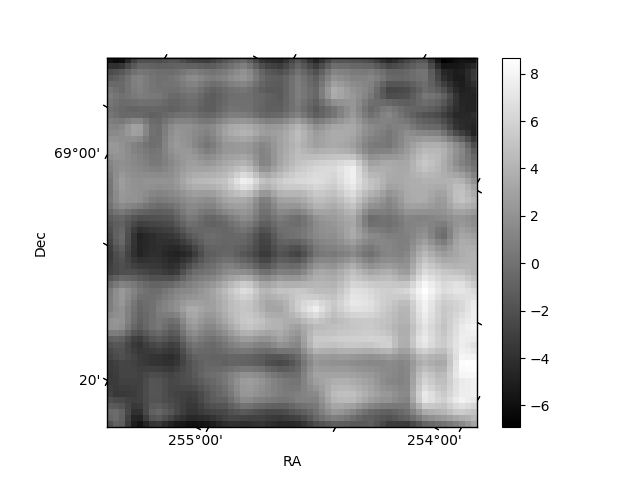
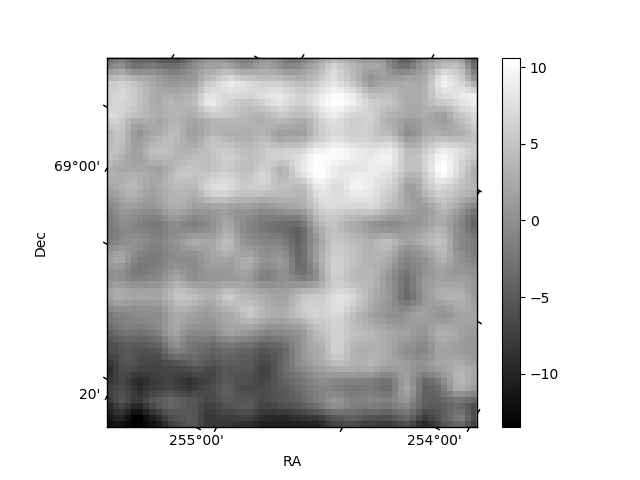
Histogram calculated using DETX and DETY for each event in the final _common_clean file
| Quadrant A | 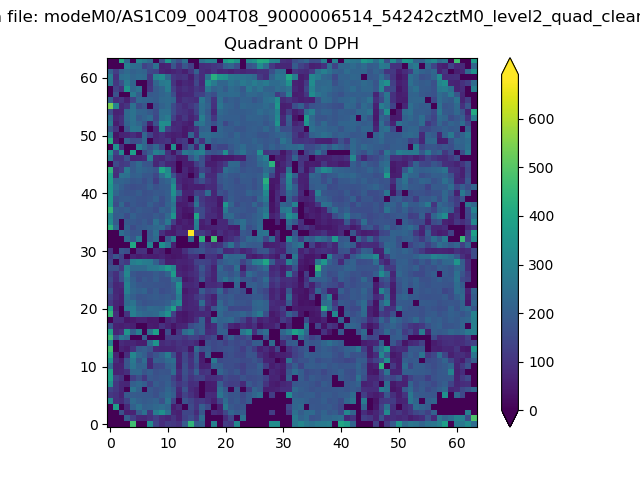 |
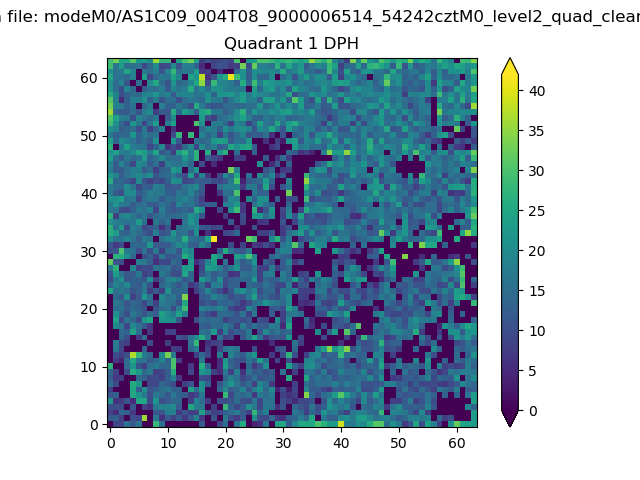 |
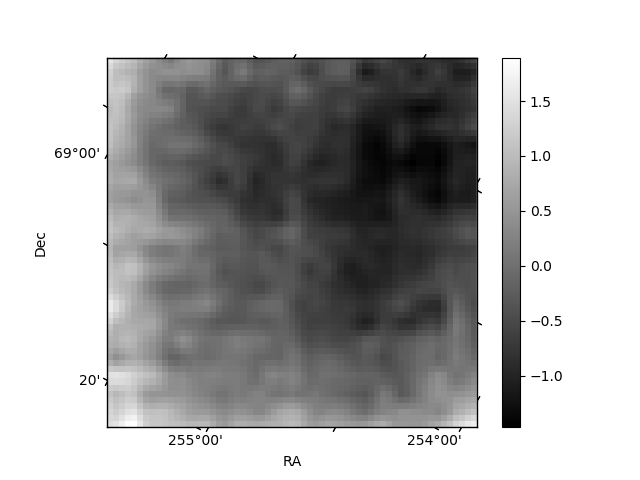
Quadrant B |
|---|---|---|---|
| Quadrant D | 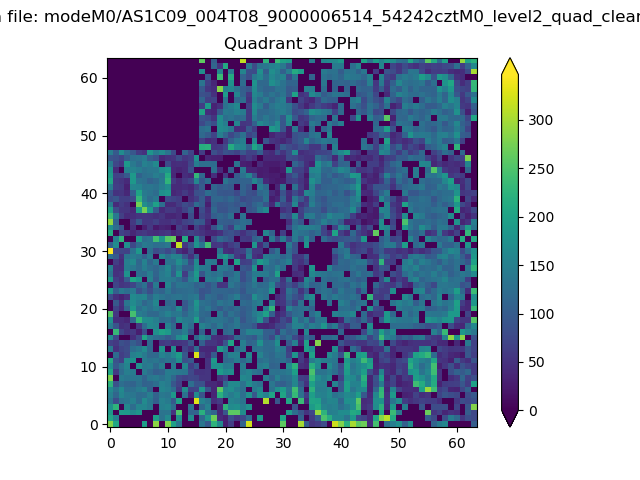 |
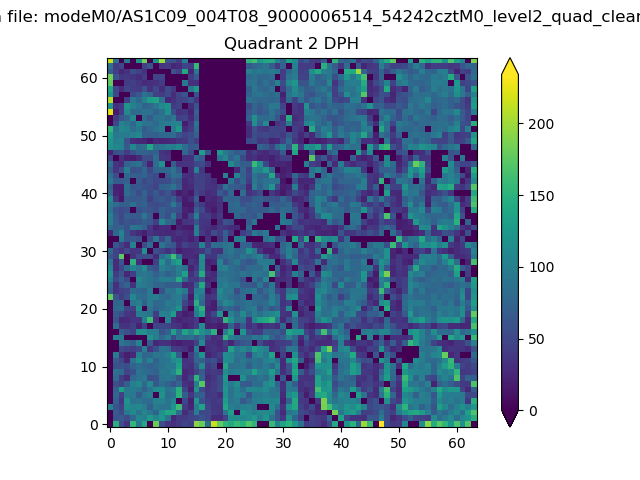 |
Quadrant C |
| Plot type | Count rate plots | Images |
|---|---|---|
| Comparison with Poisson distribution Blue bars denote a histogram of data divided into 1 sec bins. Red curve is a Poisson curve with rate = median count rate of data. |
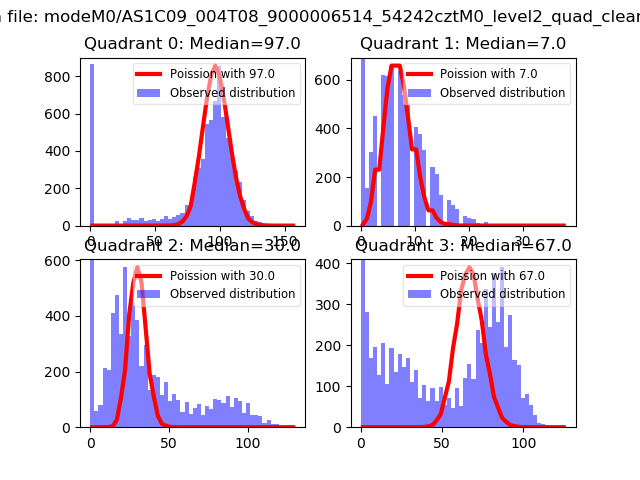 |
 |
| Quadrant-wise count rates Data is divided into 100 sec bins |
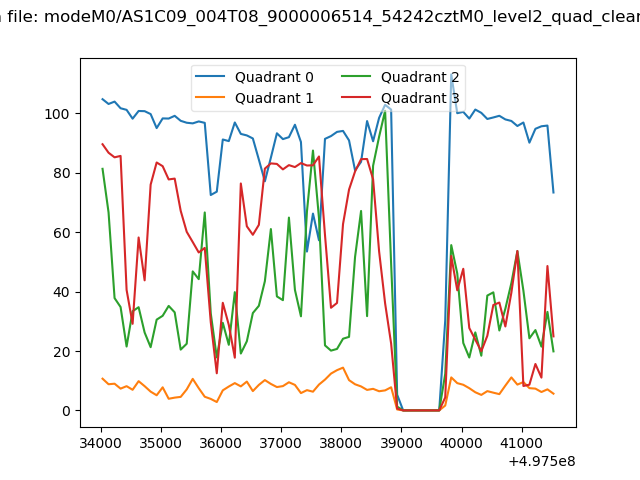 |
|
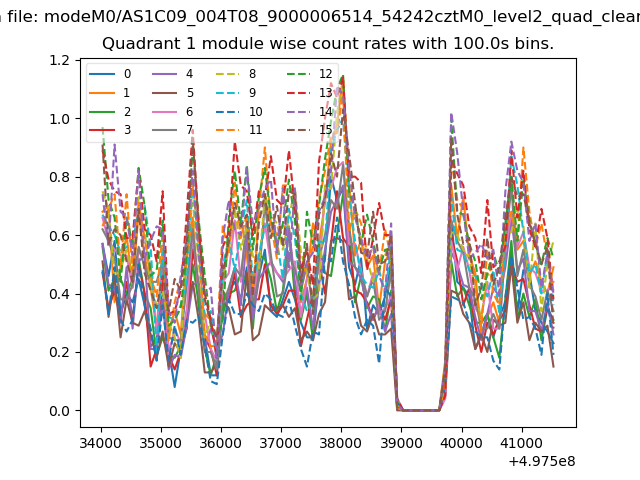
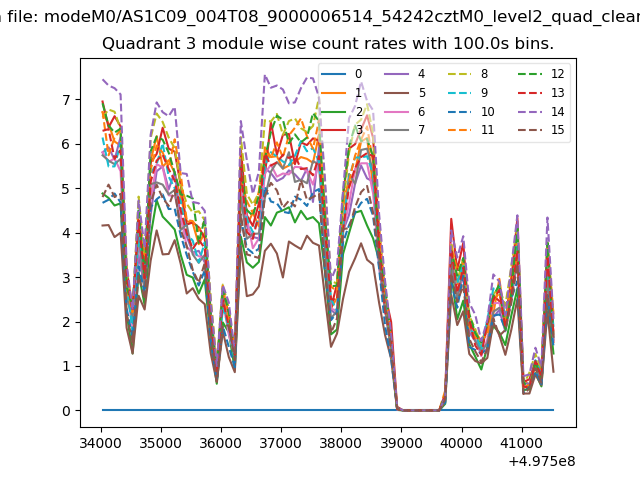
| Module-wise count rates for Quadrant A Data is divided into 100 sec bins |
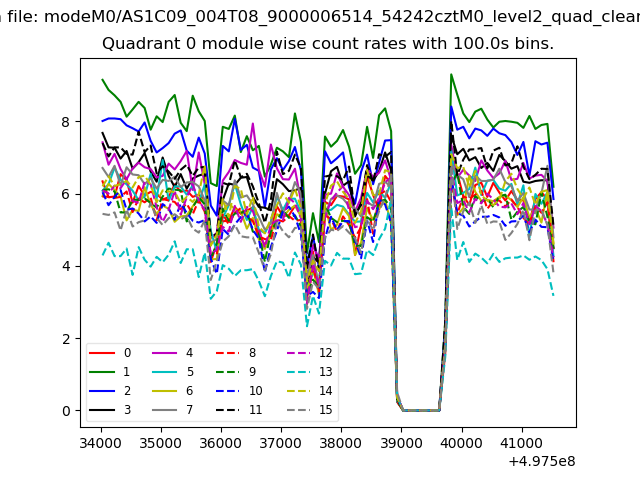 |
 |
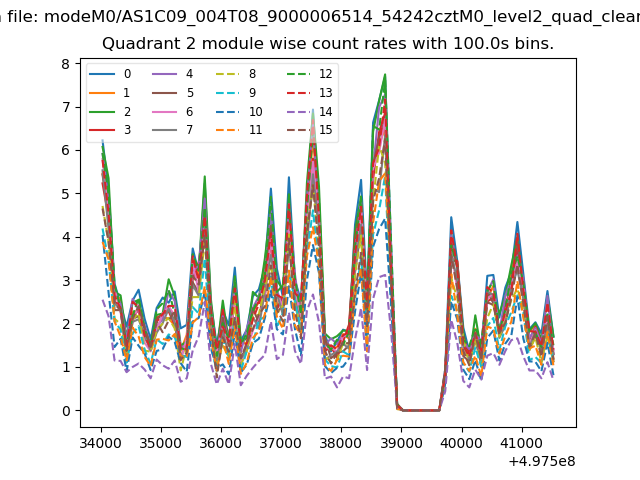
| Module-wise count rates for Quadrant B Data is divided into 100 sec bins |
 |
 |
| Module-wise count rates for Quadrant C Data is divided into 100 sec bins |
 |
 |
| Module-wise count rates for Quadrant D Data is divided into 100 sec bins |
 |
 |
| Parameter | Plot |
|---|---|
| CZT HV Monitor | 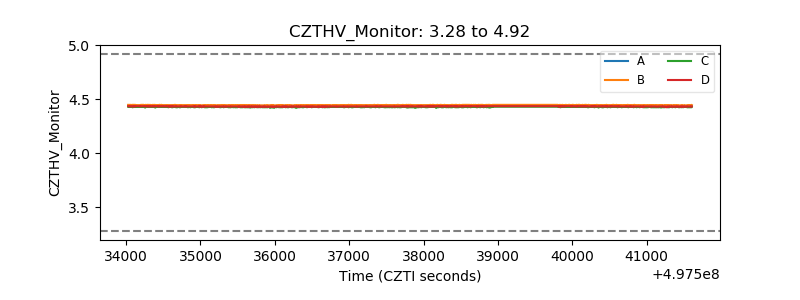 |
| D_VDD | 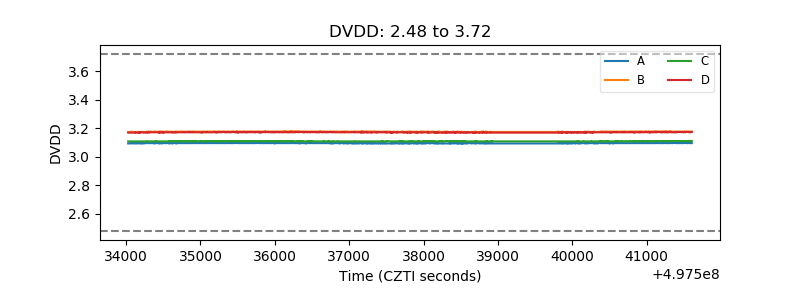 |
| Temperature 1 | 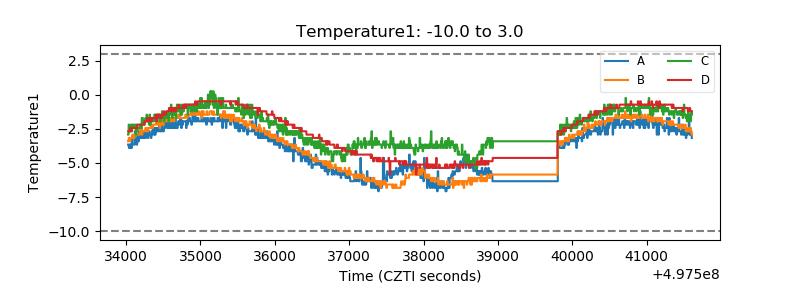 |
| Veto HV Monitor |  |
| Veto LLD | 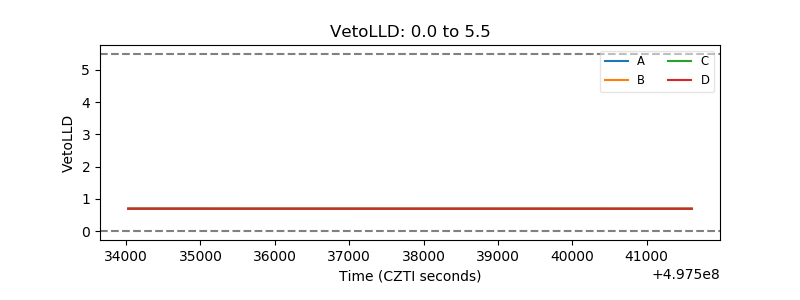 |
| Alpha Counter | 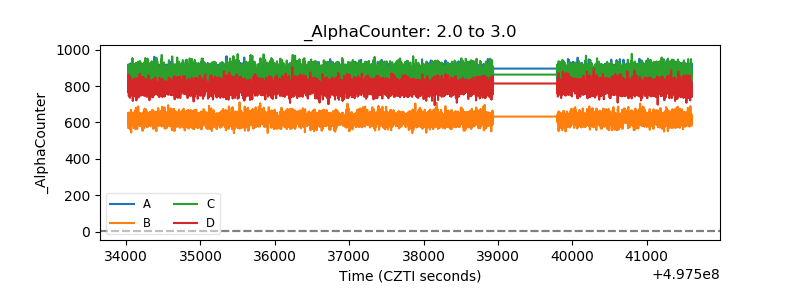 |
| _CPM_Rate | 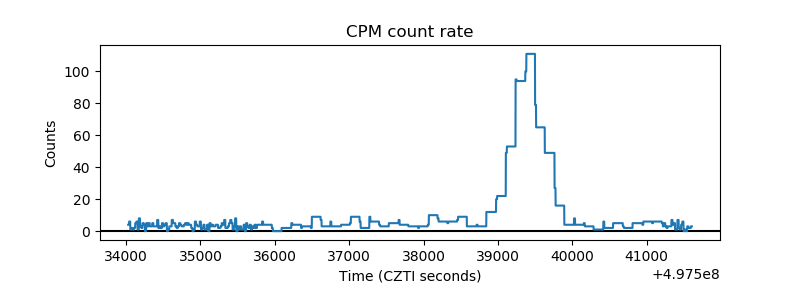 |
| CZT Counter |  |
| +2.5 Volts monitor |  |
| +5 Volts monitor |  |
| _ROLL_ROT | 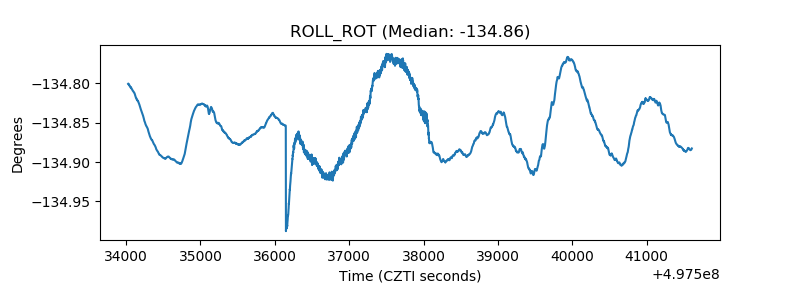 |
| _Roll_DEC | 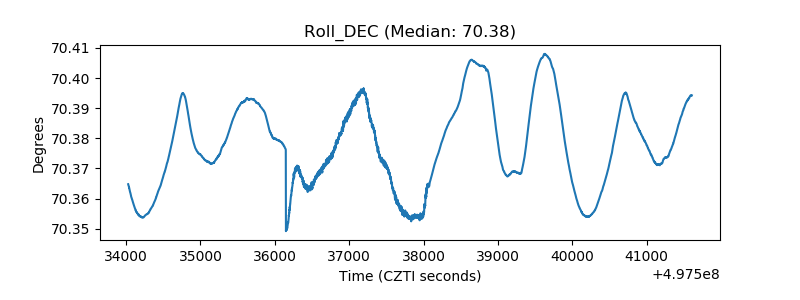 |
| _Roll_RA | 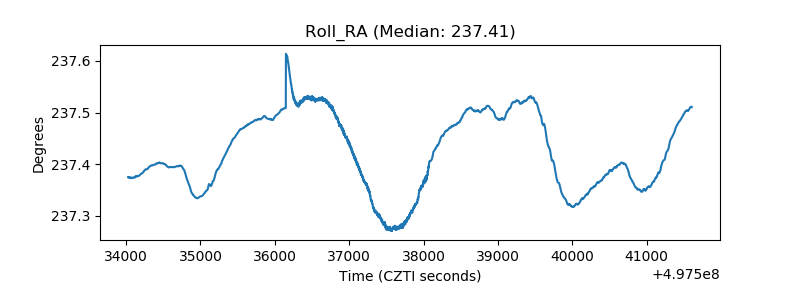 |
| Veto Counter | 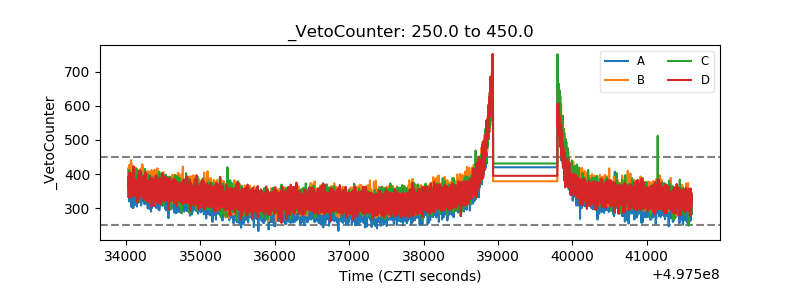 |