| Param | Original file | Final file |
|---|---|---|
| Filename | modeM0/AS1C09_004T08_9000006514_54243cztM0_level2.fits | modeM0/AS1C09_004T08_9000006514_54243cztM0_level2_quad_clean.evt |
| Size (bytes) | 1,069,744,320 | 59,901,120 |
| Size | 1020.2 MB | 57.1 MB |
| Events in quadrant A | 4,476,391 | 571,502 |
| Events in quadrant B | 13,777,168 | 181,099 |
| Events in quadrant C | 10,333,465 | 336,843 |
| Events in quadrant D | 10,515,000 | 275,243 |
| Mode M0 | |||
|---|---|---|---|
| Quadrant | BADHDUFLAG | Total packets | Discarded packets |
| A | 0 | 18039 | 1 |
| B | 0 | 45335 | 6 |
| C | 0 | 35200 | 1 |
| D | 0 | 35742 | 1 |
| Mode M9 | |||
|---|---|---|---|
| Quadrant | BADHDUFLAG | Total packets | Discarded packets |
| A | 0 | 5 | 0 |
| B | 0 | 5 | 0 |
| C | 0 | 5 | 0 |
| D | 0 | 5 | 0 |
| Mode SS | |||
|---|---|---|---|
| Quadrant | BADHDUFLAG | Total packets | Discarded packets |
| A | 0 | 132 | 0 |
| B | 0 | 132 | 0 |
| C | 0 | 132 | 0 |
| D | 0 | 132 | 0 |
| Quadrant | Total seconds | Saturated seconds | Saturation percentage |
|---|---|---|---|
| A | 6427 | 554 | 8.619885% |
| B | 6426 | 4785 | 74.463119% |
| C | 6427 | 2911 | 45.293294% |
| D | 6427 | 3351 | 52.139412% |
Noise dominated data is calculated using 1-second bins in cleaned event files. If a bin has >2000 counts, and if more than 50% of those come from <1% of pixels, then it is considered to be noise-dominated and hence unusable.
| Quadrant | # 1 sec bins | Bins with >0 counts | Bins with >2000 counts | High rate bins dominated by noise | Noise dominated (total time) | Noise dominated (detector-on time) | Marked lightcurve |
|---|---|---|---|---|---|---|---|
| A | 6977 | 6428 | 326 | 326 | 4.67% | 5.07% | 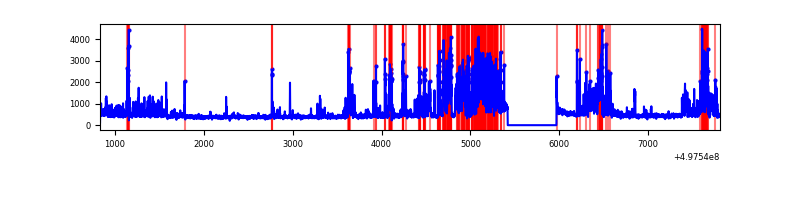 |
| B | 6976 | 6427 | 4569 | 4569 | 65.50% | 71.09% | 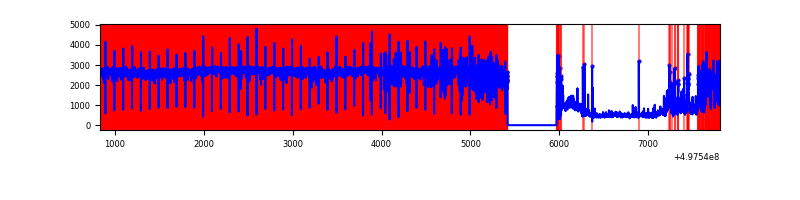 |
| C | 6977 | 6428 | 2644 | 2644 | 37.90% | 41.13% | 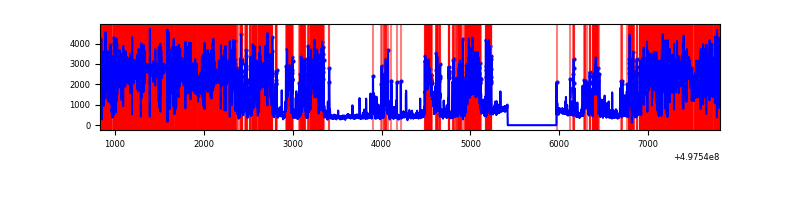 |
| D | 6976 | 6427 | 2722 | 2722 | 39.02% | 42.35% | 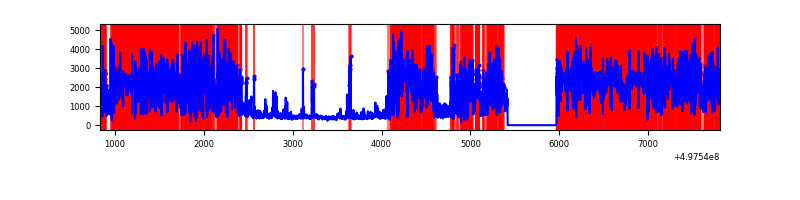 |
Top three noisy pixels from each quadrant. If the there are fewer than three noisy pixels in the level2.evt file, extra rows are filled as -1
| Pixel properties | Quadrant properties | ||||||
|---|---|---|---|---|---|---|---|
| Quadrant | DetID | PixID | Counts | Sigma | Mean | Median | Sigma |
| A | 7 | 29 | 1355201 | 8346.68 | 650 | 633 | 162.3 |
| A | 13 | 248 | 192934 | 1184.94 | 650 | 633 | 162.3 |
| A | 15 | 174 | 145222 | 890.94 | 650 | 633 | 162.3 |
| B | 5 | 172 | 12221337 | 200752.37 | 280 | 271 | 60.9 |
| B | 7 | 0 | 196372 | 3221.3 | 280 | 271 | 60.9 |
| B | 4 | 171 | 88124 | 1443.14 | 280 | 271 | 60.9 |
| C | 1 | 241 | 6102440 | 43023.81 | 517 | 512 | 141.8 |
| C | 1 | 29 | 1555164 | 10961.63 | 517 | 512 | 141.8 |
| C | 15 | 215 | 191802 | 1348.76 | 517 | 512 | 141.8 |
| D | 8 | 176 | 8194318 | 67126.49 | 427 | 408 | 122.1 |
| D | 2 | 62 | 262222 | 2144.84 | 427 | 408 | 122.1 |
| D | 8 | 160 | 125719 | 1026.58 | 427 | 408 | 122.1 |
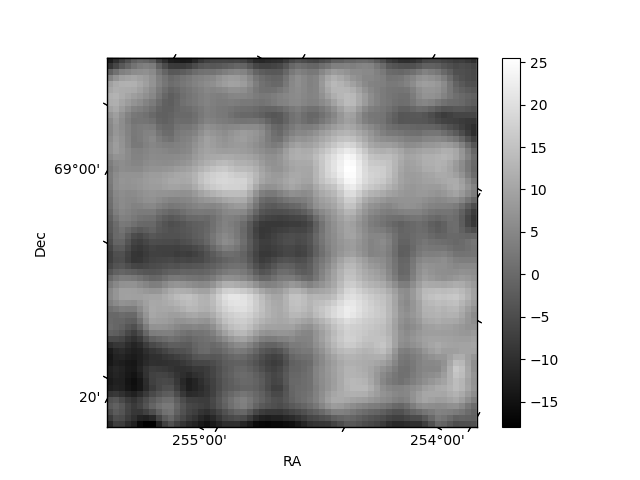
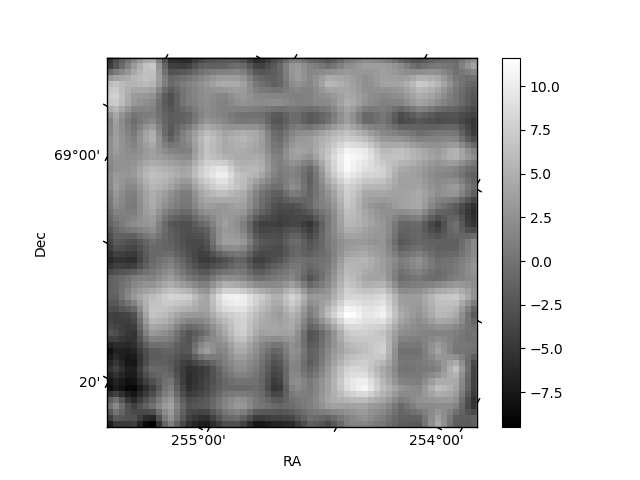
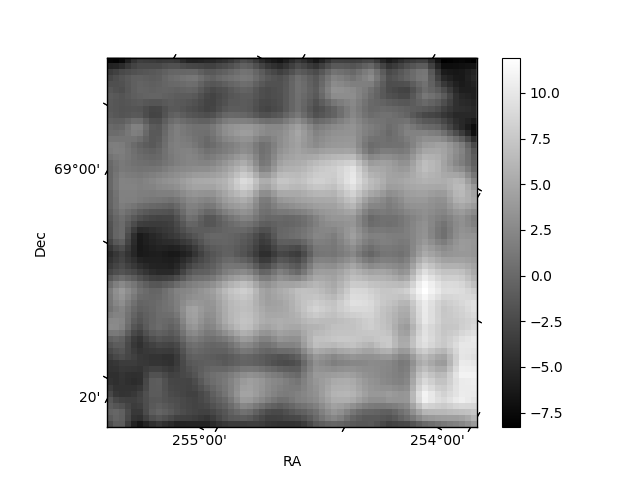
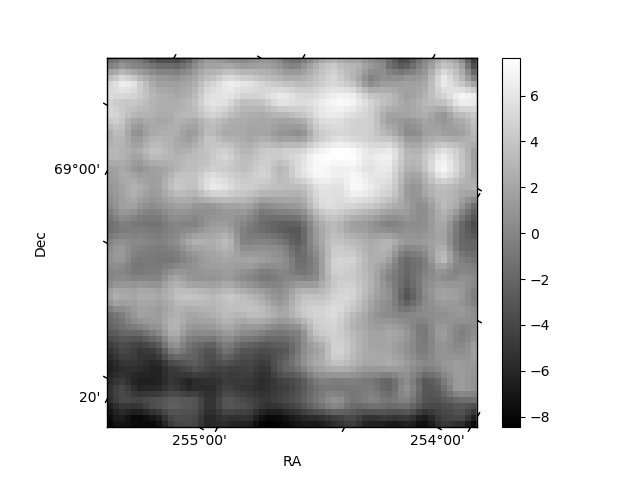
Histogram calculated using DETX and DETY for each event in the final _common_clean file
| Quadrant A | 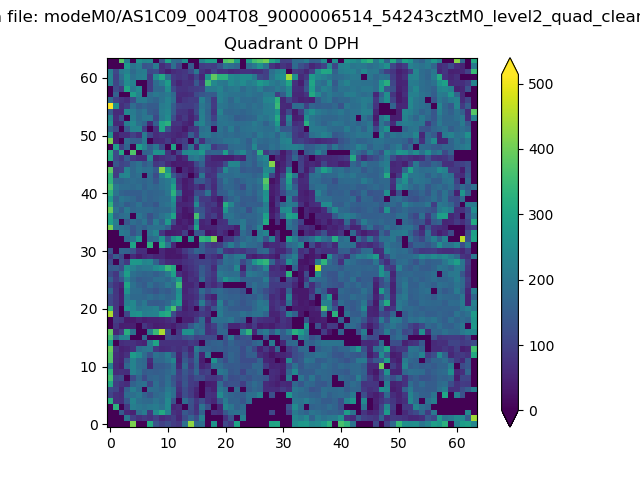 |
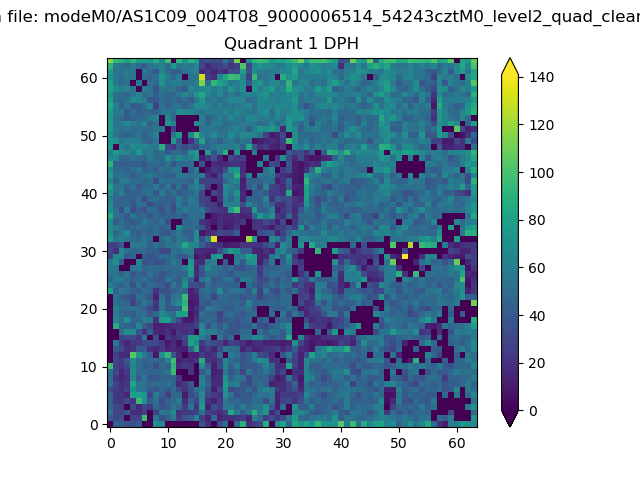 |
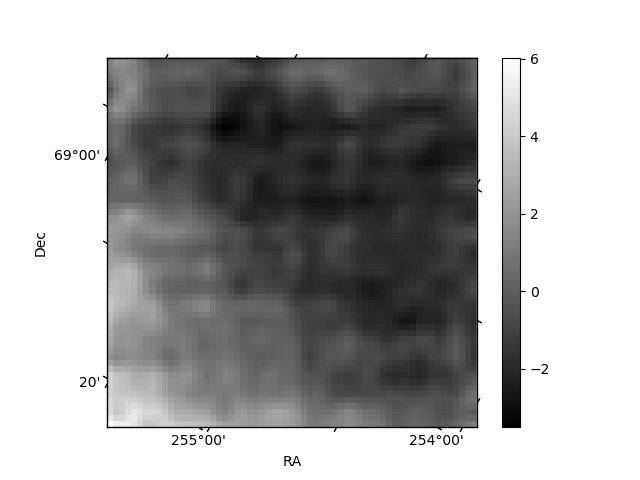
Quadrant B |
|---|---|---|---|
| Quadrant D | 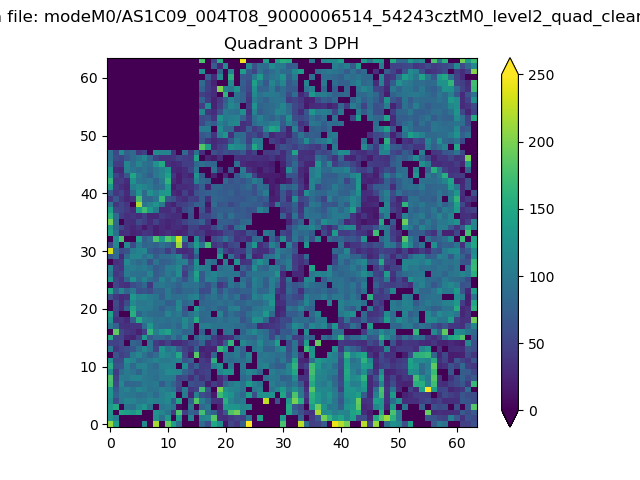 |
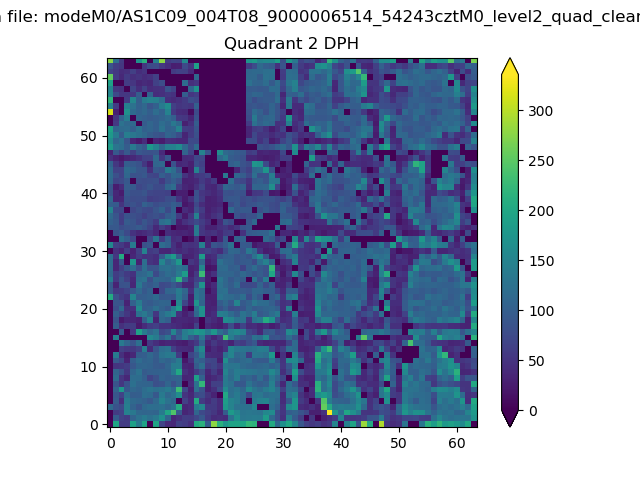 |
Quadrant C |
| Plot type | Count rate plots | Images |
|---|---|---|
| Comparison with Poisson distribution Blue bars denote a histogram of data divided into 1 sec bins. Red curve is a Poisson curve with rate = median count rate of data. |
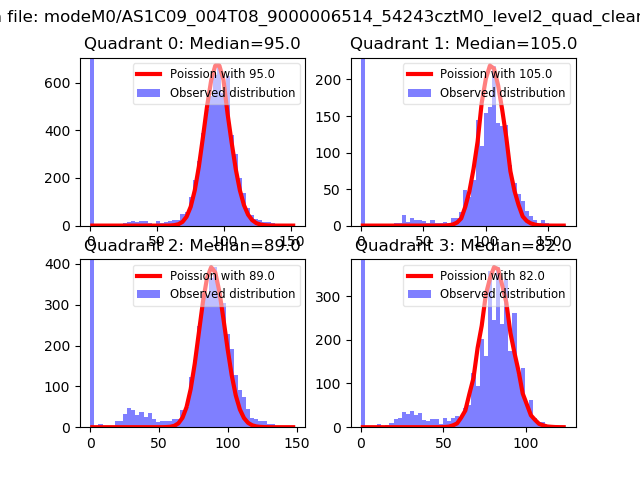 |
 |
| Quadrant-wise count rates Data is divided into 100 sec bins |
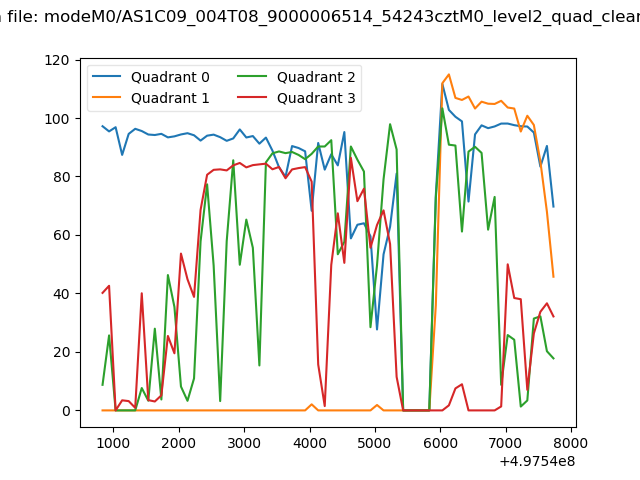 |
|
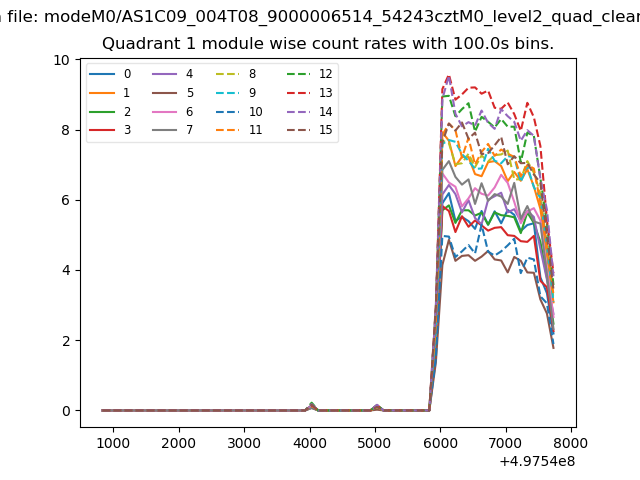
| Module-wise count rates for Quadrant A Data is divided into 100 sec bins |
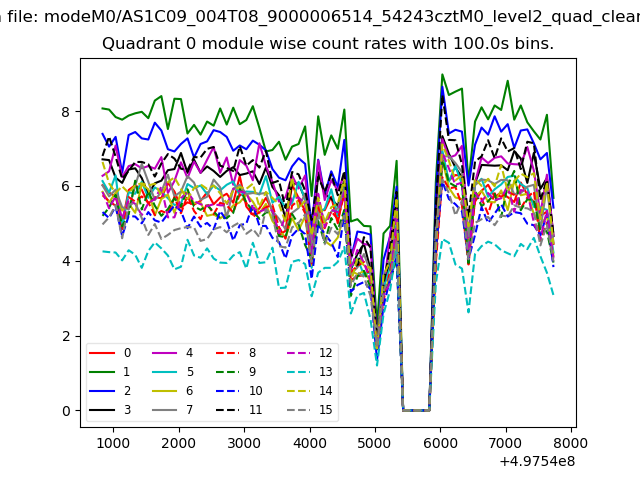 |
 |
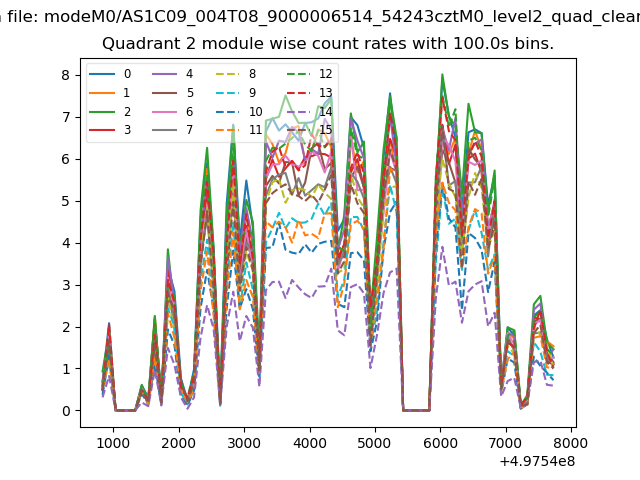
| Module-wise count rates for Quadrant B Data is divided into 100 sec bins |
 |
 |
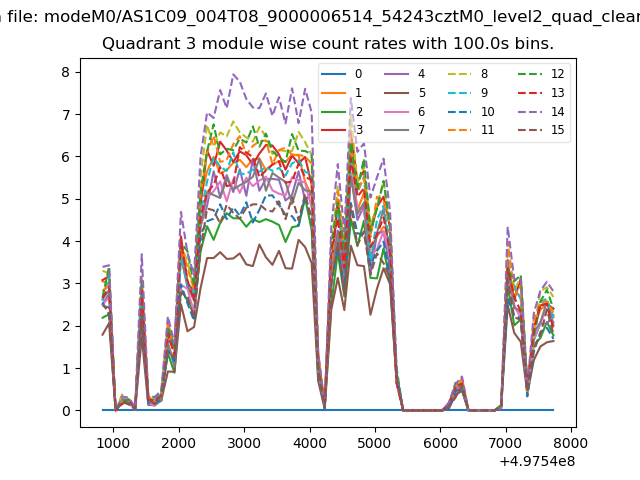
| Module-wise count rates for Quadrant C Data is divided into 100 sec bins |
 |
 |
| Module-wise count rates for Quadrant D Data is divided into 100 sec bins |
 |
 |
| Parameter | Plot |
|---|---|
| CZT HV Monitor |  |
| D_VDD | 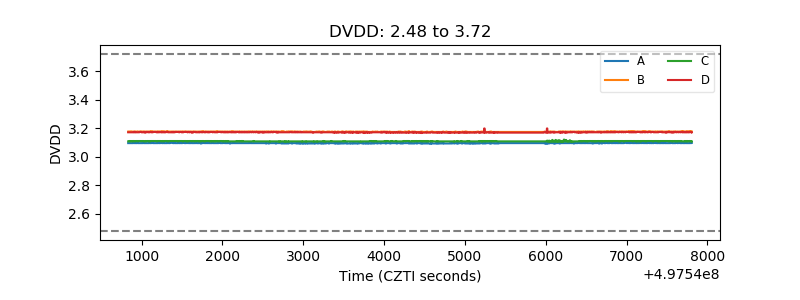 |
| Temperature 1 | 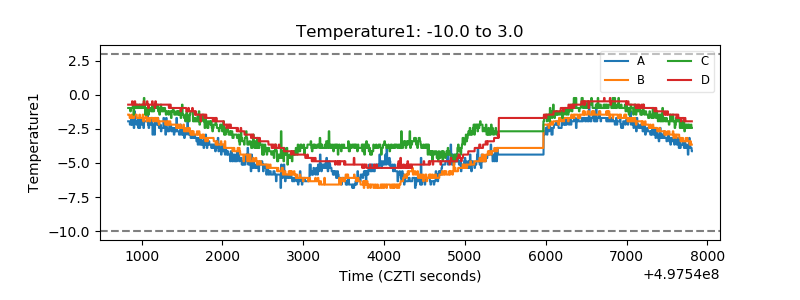 |
| Veto HV Monitor | 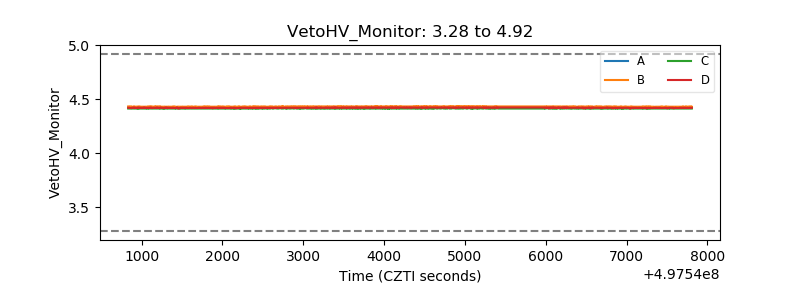 |
| Veto LLD | 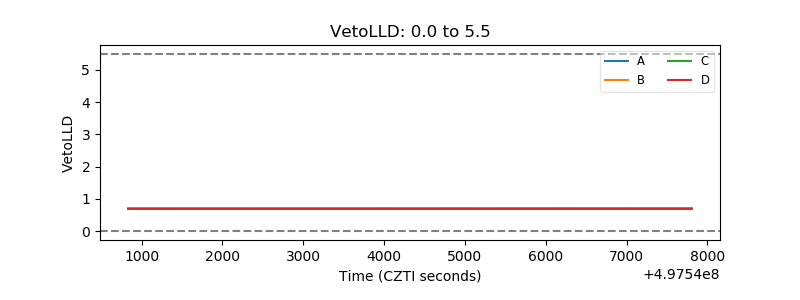 |
| Alpha Counter | 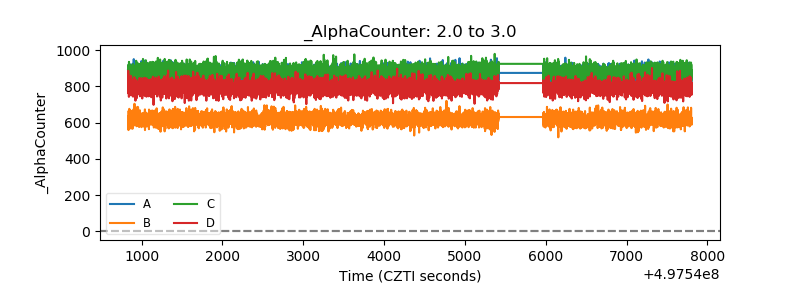 |
| _CPM_Rate | 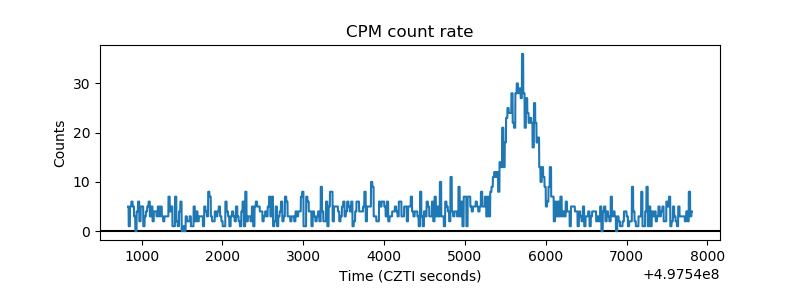 |
| CZT Counter | 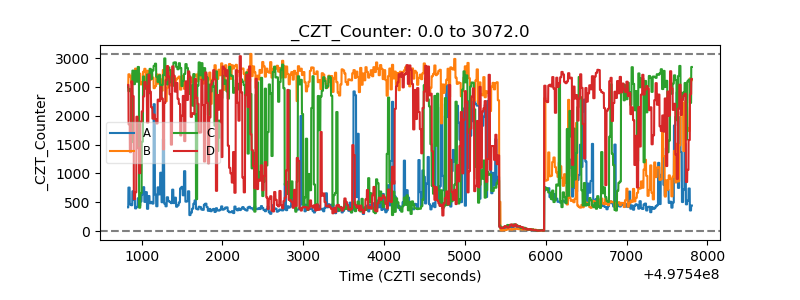 |
| +2.5 Volts monitor |  |
| +5 Volts monitor | 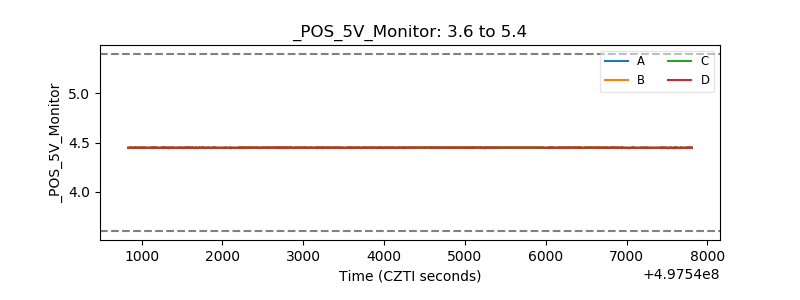 |
| _ROLL_ROT | 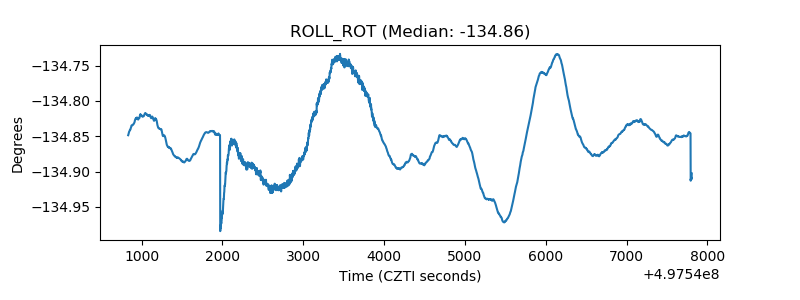 |
| _Roll_DEC | 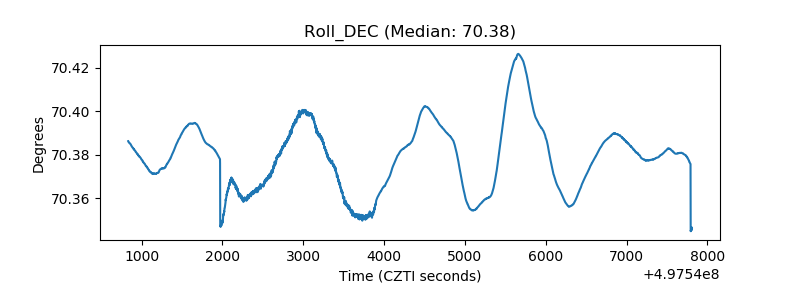 |
| _Roll_RA | 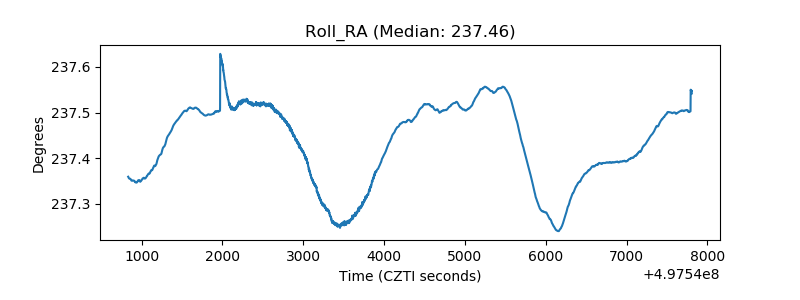 |
| Veto Counter | 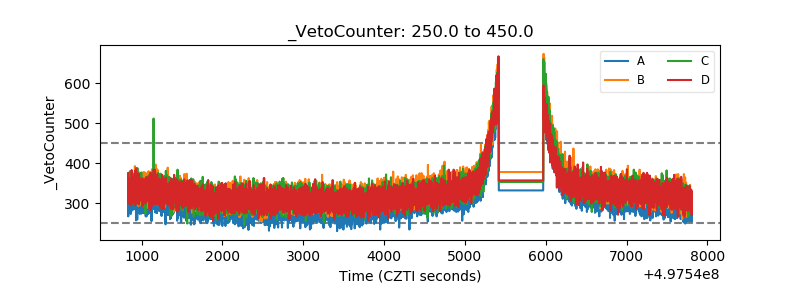 |