| Param | Original file | Final file |
|---|---|---|
| Filename | modeM0/AS1C09_004T08_9000006514_54244cztM0_level2.fits | modeM0/AS1C09_004T08_9000006514_54244cztM0_level2_quad_clean.evt |
| Size (bytes) | 1,005,975,360 | 81,835,200 |
| Size | 959.4 MB | 78.0 MB |
| Events in quadrant A | 4,891,687 | 642,532 |
| Events in quadrant B | 7,607,061 | 677,002 |
| Events in quadrant C | 12,589,733 | 306,355 |
| Events in quadrant D | 11,592,773 | 349,776 |
| Mode M0 | |||
|---|---|---|---|
| Quadrant | BADHDUFLAG | Total packets | Discarded packets |
| A | 0 | 19917 | 0 |
| B | 0 | 27729 | 0 |
| C | 0 | 42391 | 0 |
| D | 0 | 39448 | 0 |
| Mode SS | |||
|---|---|---|---|
| Quadrant | BADHDUFLAG | Total packets | Discarded packets |
| A | 0 | 144 | 0 |
| B | 0 | 144 | 0 |
| C | 0 | 144 | 0 |
| D | 0 | 144 | 0 |
| Quadrant | Total seconds | Saturated seconds | Saturation percentage |
|---|---|---|---|
| A | 7205 | 543 | 7.536433% |
| B | 7205 | 842 | 11.686329% |
| C | 7205 | 3941 | 54.698126% |
| D | 7205 | 3266 | 45.329632% |
Noise dominated data is calculated using 1-second bins in cleaned event files. If a bin has >2000 counts, and if more than 50% of those come from <1% of pixels, then it is considered to be noise-dominated and hence unusable.
| Quadrant | # 1 sec bins | Bins with >0 counts | Bins with >2000 counts | High rate bins dominated by noise | Noise dominated (total time) | Noise dominated (detector-on time) | Marked lightcurve |
|---|---|---|---|---|---|---|---|
| A | 7205 | 7205 | 355 | 355 | 4.93% | 4.93% | 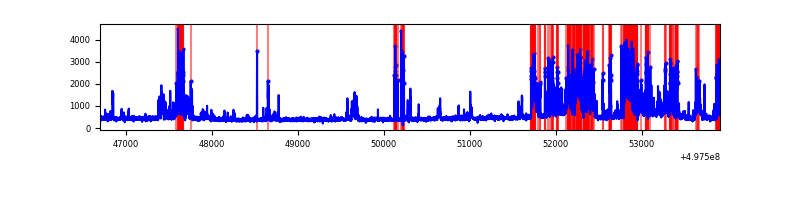 |
| B | 7205 | 7205 | 539 | 539 | 7.48% | 7.48% | 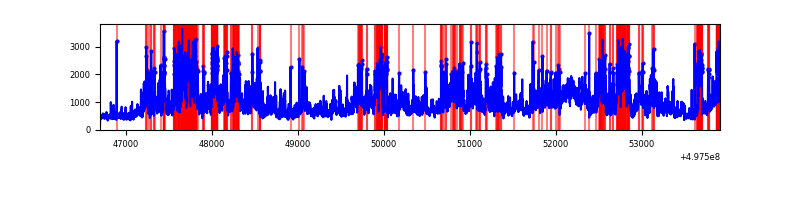 |
| C | 7205 | 7205 | 3590 | 3590 | 49.83% | 49.83% | 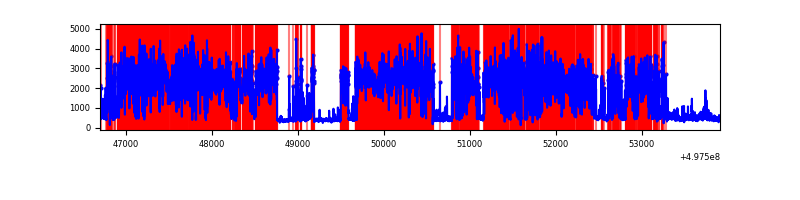 |
| D | 7204 | 7204 | 2656 | 2656 | 36.87% | 36.87% | 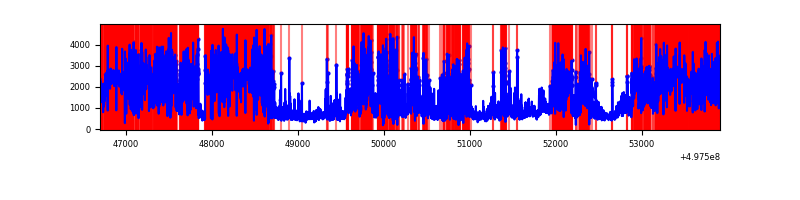 |
Top three noisy pixels from each quadrant. If the there are fewer than three noisy pixels in the level2.evt file, extra rows are filled as -1
| Pixel properties | Quadrant properties | ||||||
|---|---|---|---|---|---|---|---|
| Quadrant | DetID | PixID | Counts | Sigma | Mean | Median | Sigma |
| A | 7 | 29 | 1153496 | 6340.22 | 737 | 718 | 181.8 |
| A | 13 | 248 | 423927 | 2327.63 | 737 | 718 | 181.8 |
| A | 15 | 174 | 200649 | 1099.61 | 737 | 718 | 181.8 |
| B | 5 | 172 | 2718798 | 17414.5 | 732 | 707 | 156.1 |
| B | 7 | 0 | 1265102 | 8100.83 | 732 | 707 | 156.1 |
| B | 4 | 171 | 231095 | 1476.07 | 732 | 707 | 156.1 |
| C | 1 | 241 | 9530396 | 63016.38 | 551 | 545 | 151.2 |
| C | 1 | 29 | 284338 | 1876.59 | 551 | 545 | 151.2 |
| C | 12 | 2 | 275307 | 1816.87 | 551 | 545 | 151.2 |
| D | 8 | 176 | 7711799 | 51171.24 | 530 | 506 | 150.7 |
| D | 2 | 62 | 912753 | 6053.57 | 530 | 506 | 150.7 |
| D | 3 | 12 | 358344 | 2374.57 | 530 | 506 | 150.7 |
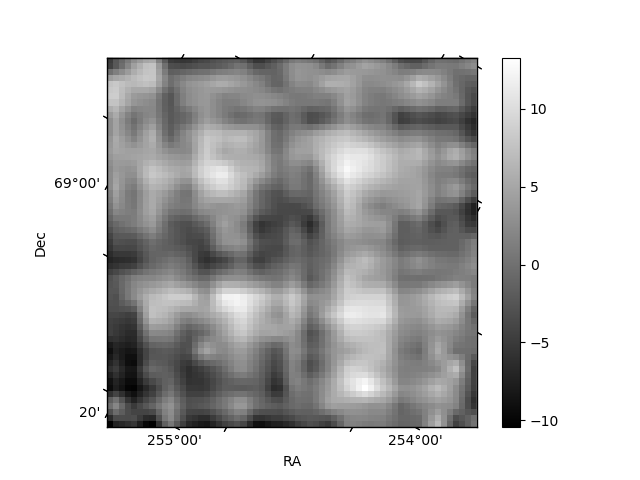
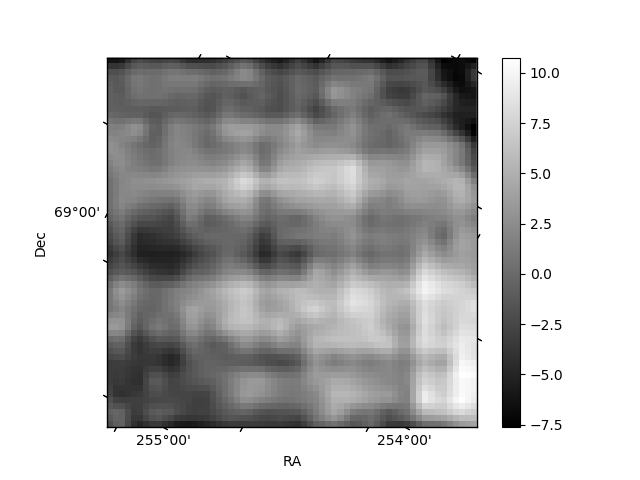
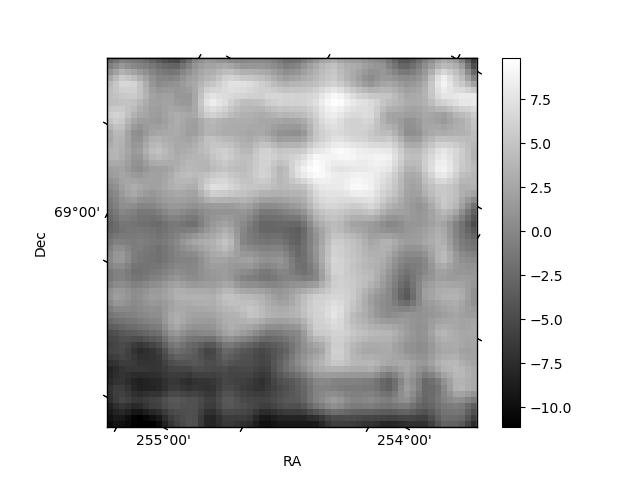
Histogram calculated using DETX and DETY for each event in the final _common_clean file
| Quadrant A | 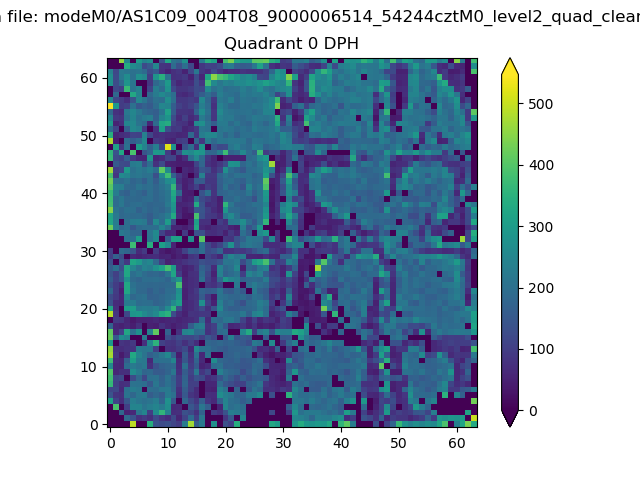 |
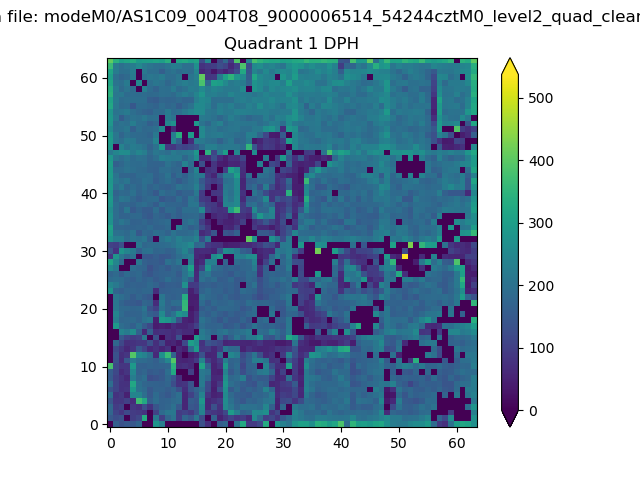 |
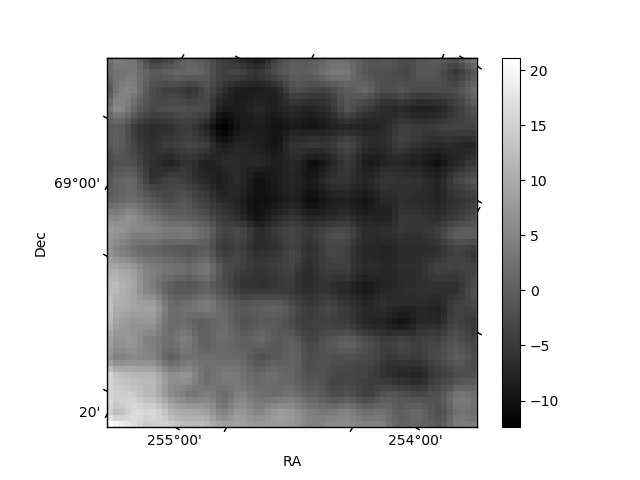
Quadrant B |
|---|---|---|---|
| Quadrant D | 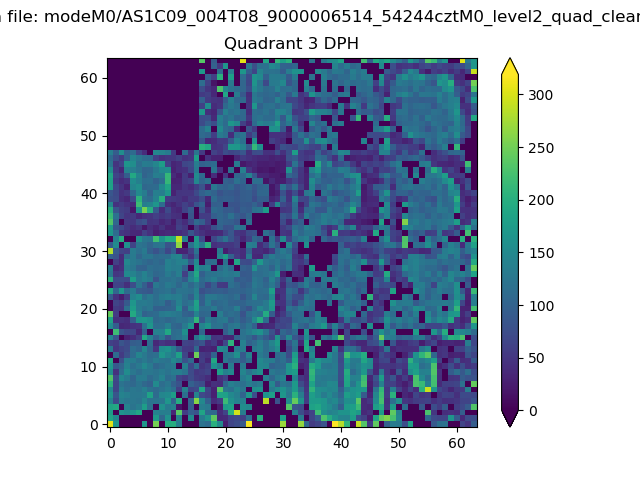 |
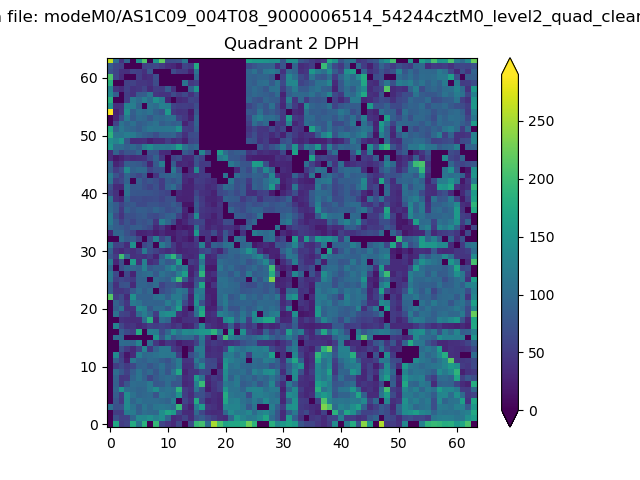 |
Quadrant C |
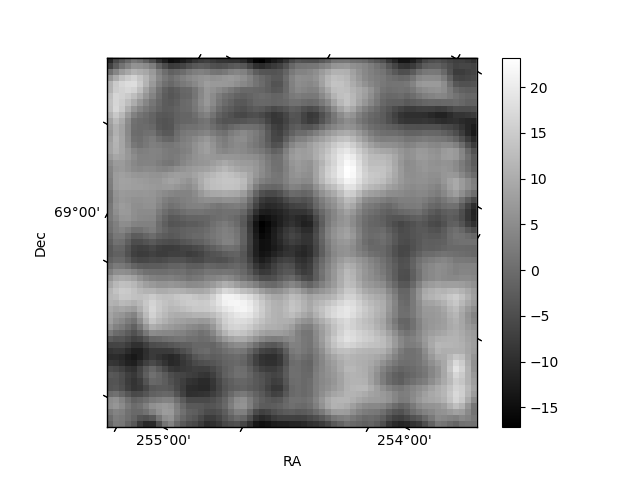
| Plot type | Count rate plots | Images |
|---|---|---|
| Comparison with Poisson distribution Blue bars denote a histogram of data divided into 1 sec bins. Red curve is a Poisson curve with rate = median count rate of data. |
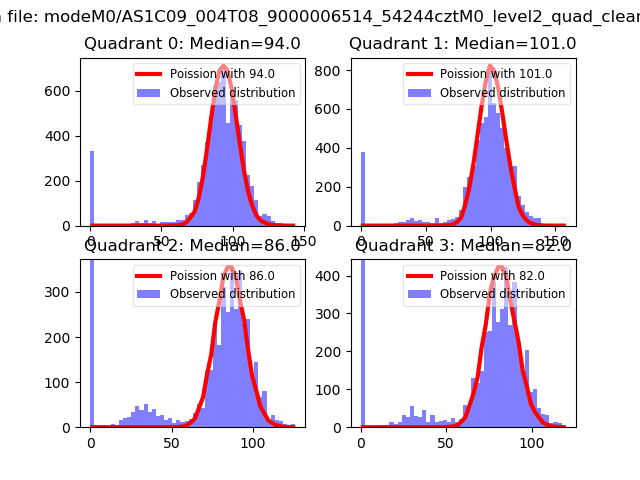 |
 |
| Quadrant-wise count rates Data is divided into 100 sec bins |
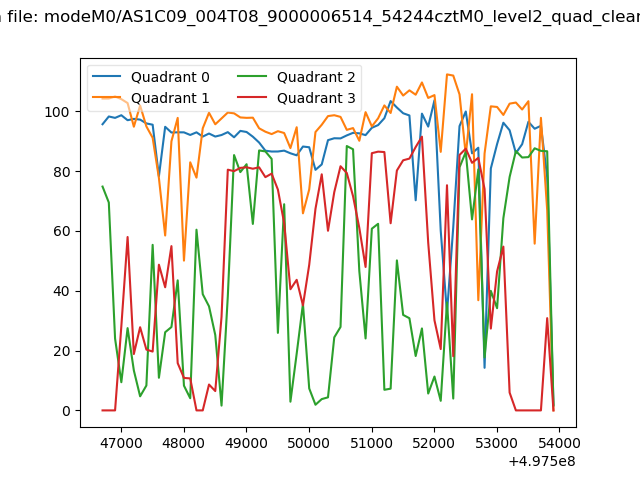 |
|
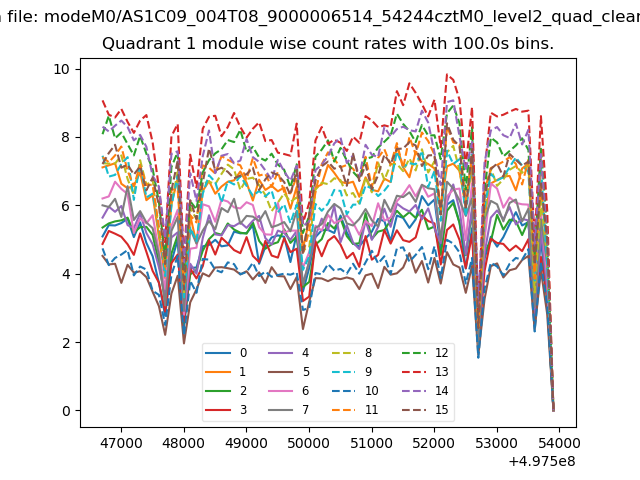
| Module-wise count rates for Quadrant A Data is divided into 100 sec bins |
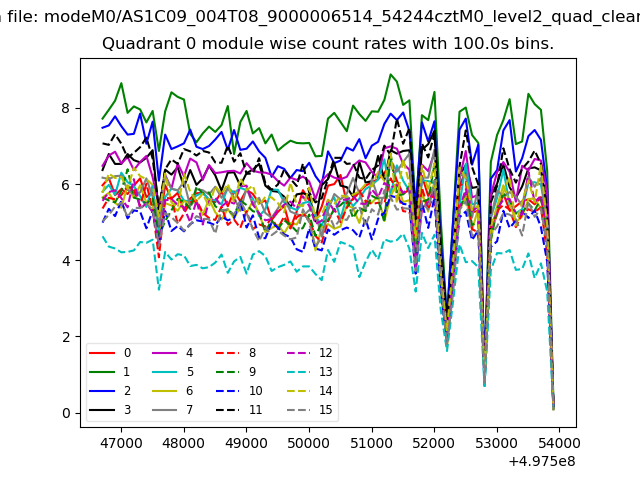 |
 |
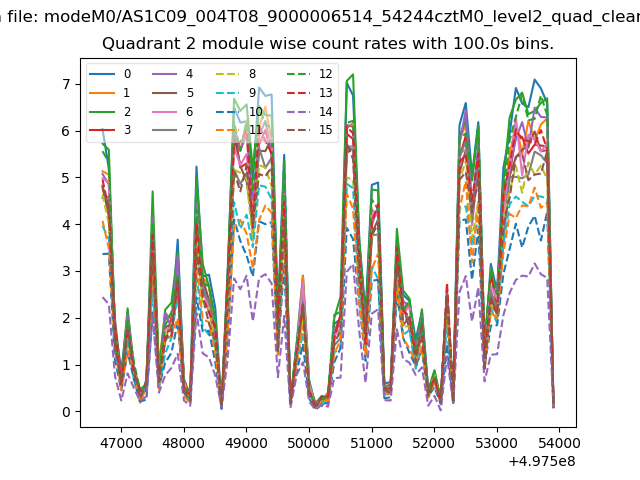
| Module-wise count rates for Quadrant B Data is divided into 100 sec bins |
 |
 |
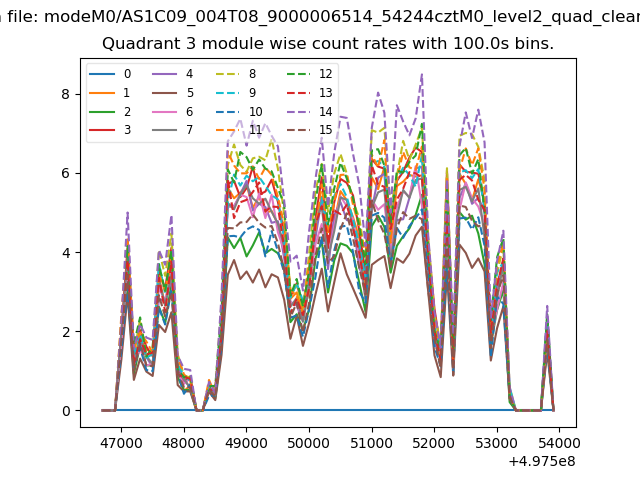
| Module-wise count rates for Quadrant C Data is divided into 100 sec bins |
 |
 |
| Module-wise count rates for Quadrant D Data is divided into 100 sec bins |
 |
 |
| Parameter | Plot |
|---|---|
| CZT HV Monitor | 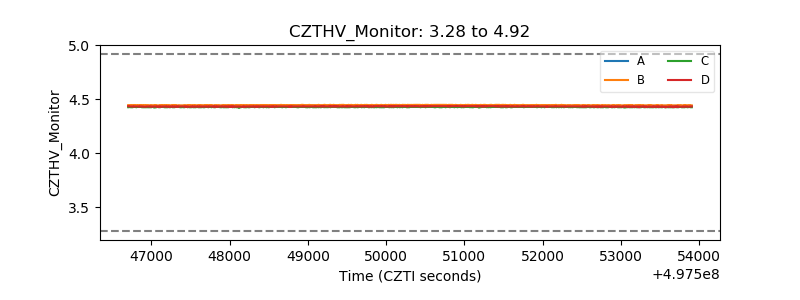 |
| D_VDD | 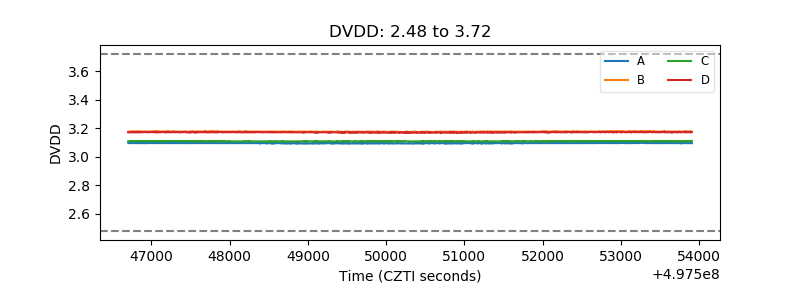 |
| Temperature 1 | 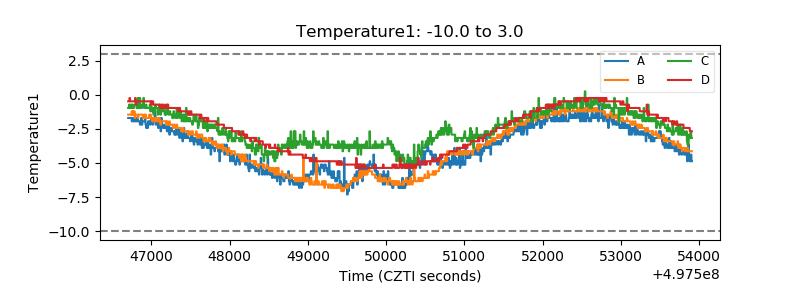 |
| Veto HV Monitor | 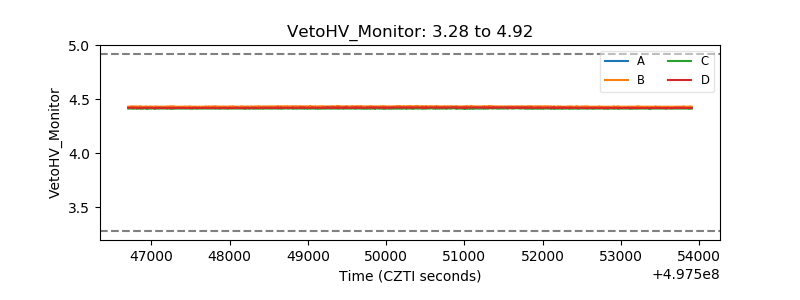 |
| Veto LLD | 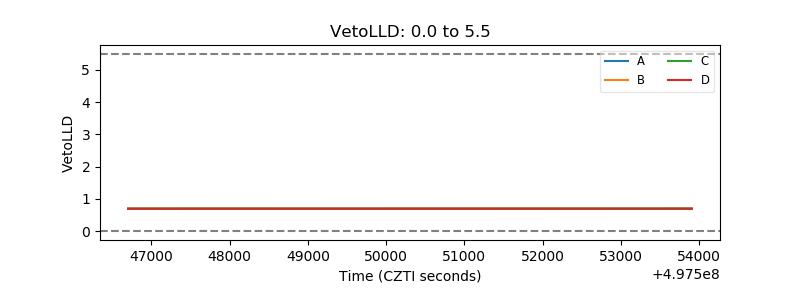 |
| Alpha Counter | 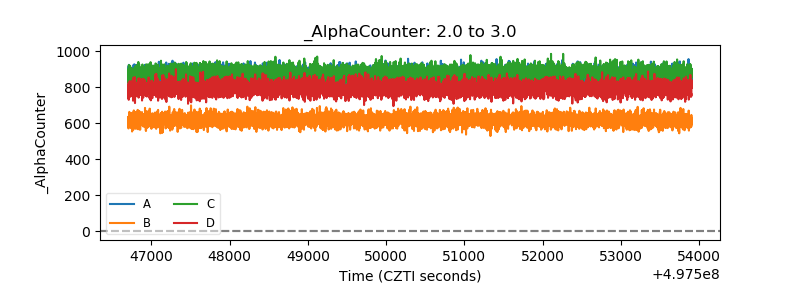 |
| _CPM_Rate | 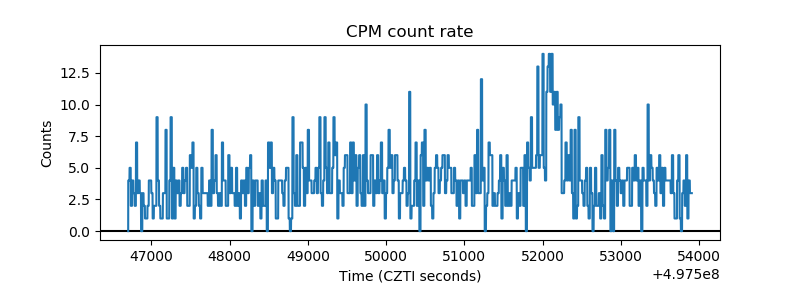 |
| CZT Counter | 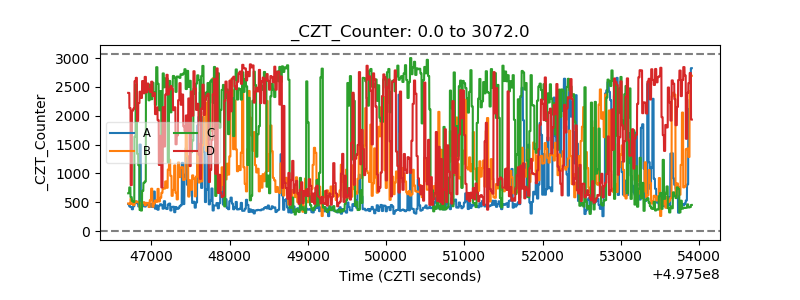 |
| +2.5 Volts monitor | 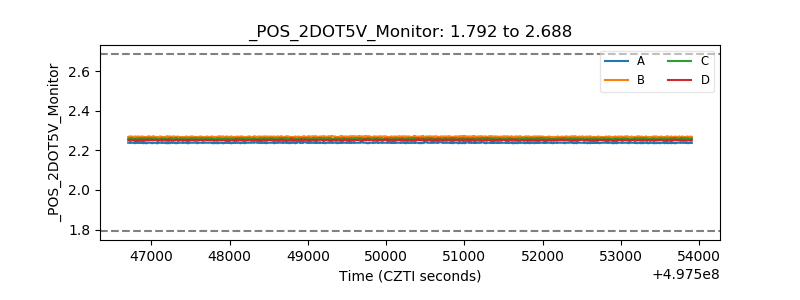 |
| +5 Volts monitor | 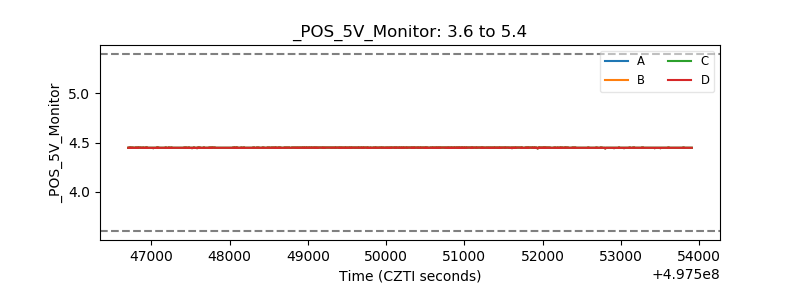 |
| _ROLL_ROT | 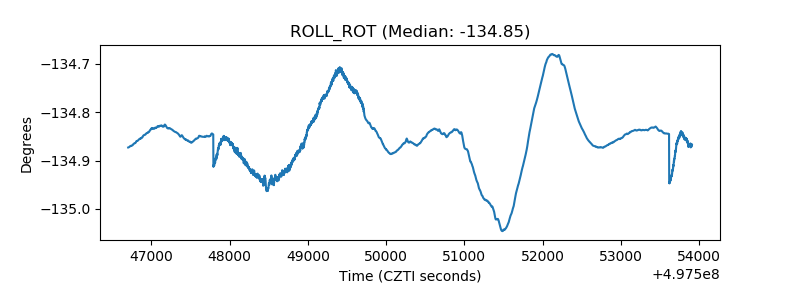 |
| _Roll_DEC | 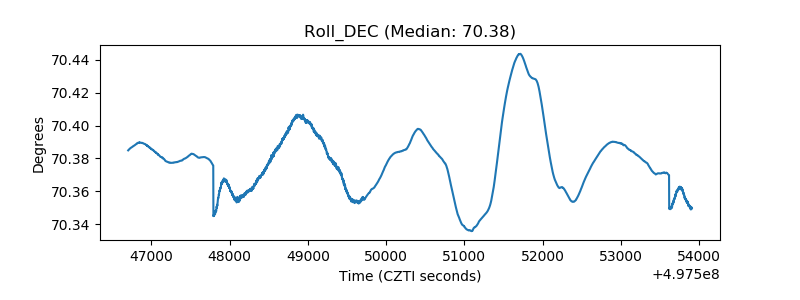 |
| _Roll_RA | 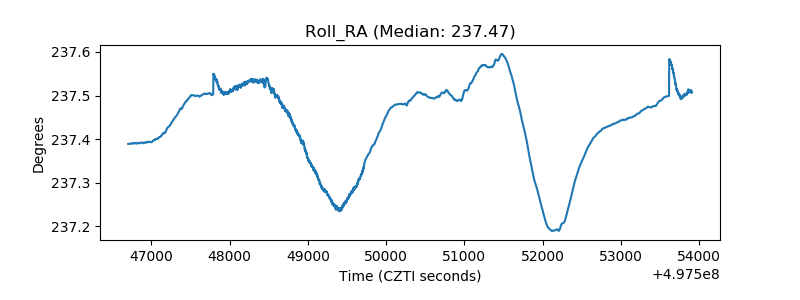 |
| Veto Counter | 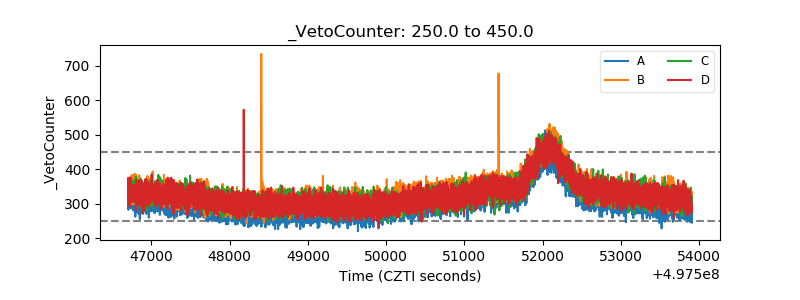 |