| Param | Original file | Final file |
|---|---|---|
| Filename | modeM0/AS1C09_004T08_9000006514_54245cztM0_level2.fits | modeM0/AS1C09_004T08_9000006514_54245cztM0_level2_quad_clean.evt |
| Size (bytes) | 847,540,800 | 91,946,880 |
| Size | 808.3 MB | 87.7 MB |
| Events in quadrant A | 5,902,512 | 638,342 |
| Events in quadrant B | 6,152,305 | 705,841 |
| Events in quadrant C | 6,103,960 | 588,946 |
| Events in quadrant D | 12,641,690 | 335,485 |
| Mode M0 | |||
|---|---|---|---|
| Quadrant | BADHDUFLAG | Total packets | Discarded packets |
| A | 0 | 22773 | 0 |
| B | 0 | 23441 | 0 |
| C | 0 | 23401 | 0 |
| D | 0 | 42661 | 0 |
| Mode SS | |||
|---|---|---|---|
| Quadrant | BADHDUFLAG | Total packets | Discarded packets |
| A | 0 | 148 | 0 |
| B | 0 | 148 | 0 |
| C | 0 | 148 | 0 |
| D | 0 | 148 | 0 |
| Quadrant | Total seconds | Saturated seconds | Saturation percentage |
|---|---|---|---|
| A | 7398 | 742 | 10.029738% |
| B | 7399 | 516 | 6.973915% |
| C | 7399 | 832 | 11.244763% |
| D | 7399 | 3614 | 48.844438% |
Noise dominated data is calculated using 1-second bins in cleaned event files. If a bin has >2000 counts, and if more than 50% of those come from <1% of pixels, then it is considered to be noise-dominated and hence unusable.
| Quadrant | # 1 sec bins | Bins with >0 counts | Bins with >2000 counts | High rate bins dominated by noise | Noise dominated (total time) | Noise dominated (detector-on time) | Marked lightcurve |
|---|---|---|---|---|---|---|---|
| A | 7398 | 7398 | 585 | 585 | 7.91% | 7.91% | 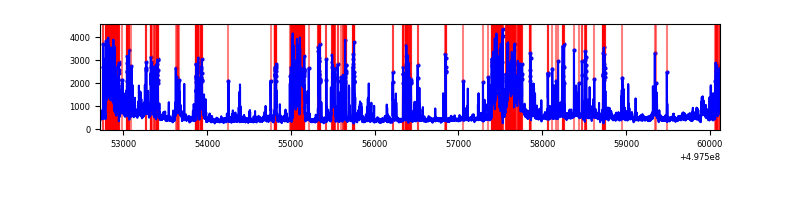 |
| B | 7399 | 7399 | 393 | 393 | 5.31% | 5.31% | 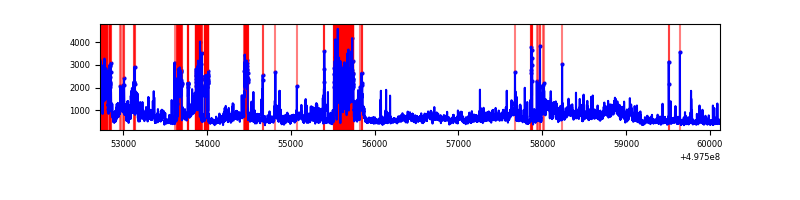 |
| C | 7399 | 7399 | 781 | 781 | 10.56% | 10.56% | 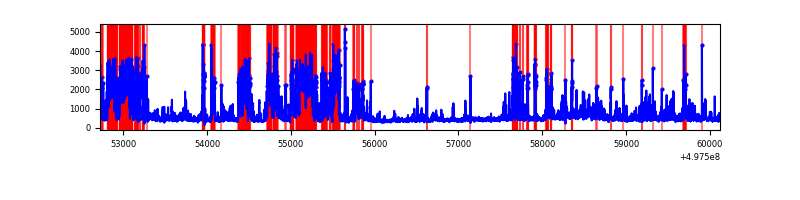 |
| D | 7399 | 7399 | 3149 | 3149 | 42.56% | 42.56% | 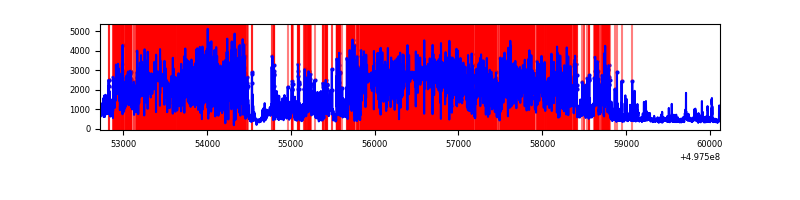 |
Top three noisy pixels from each quadrant. If the there are fewer than three noisy pixels in the level2.evt file, extra rows are filled as -1
| Pixel properties | Quadrant properties | ||||||
|---|---|---|---|---|---|---|---|
| Quadrant | DetID | PixID | Counts | Sigma | Mean | Median | Sigma |
| A | 7 | 29 | 1784056 | 9778.17 | 737 | 718 | 182.4 |
| A | 13 | 248 | 484374 | 2651.92 | 737 | 718 | 182.4 |
| A | 12 | 17 | 267329 | 1461.85 | 737 | 718 | 182.4 |
| B | 7 | 0 | 1154539 | 7320.32 | 747 | 723 | 157.6 |
| B | 5 | 172 | 1141181 | 7235.57 | 747 | 723 | 157.6 |
| B | 14 | 167 | 248288 | 1570.66 | 747 | 723 | 157.6 |
| C | 1 | 241 | 1784483 | 9096.39 | 715 | 705 | 196.1 |
| C | 15 | 198 | 394262 | 2006.95 | 715 | 705 | 196.1 |
| C | 15 | 189 | 287749 | 1463.78 | 715 | 705 | 196.1 |
| D | 8 | 176 | 8190644 | 52381.21 | 548 | 524 | 156.4 |
| D | 3 | 12 | 873892 | 5585.76 | 548 | 524 | 156.4 |
| D | 2 | 62 | 775161 | 4954.31 | 548 | 524 | 156.4 |
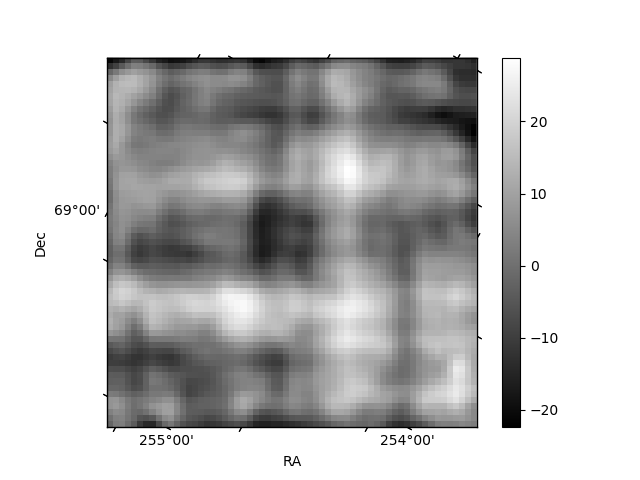
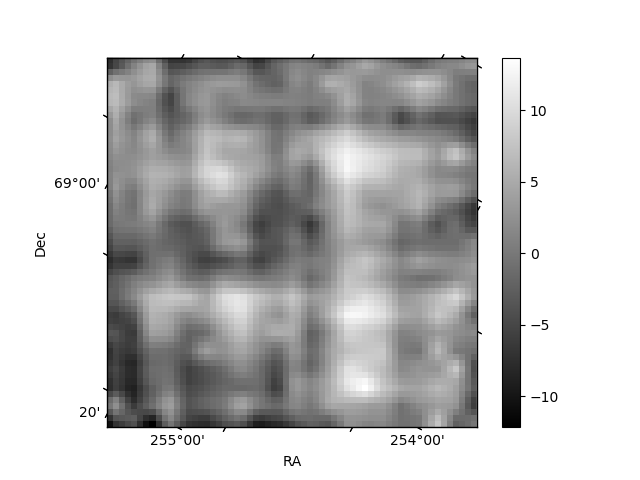
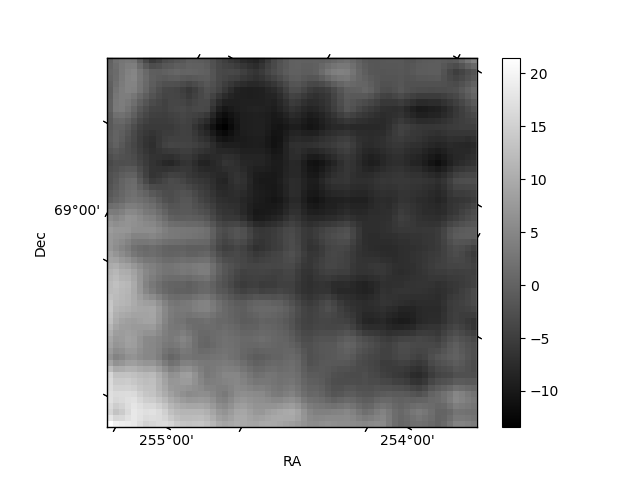
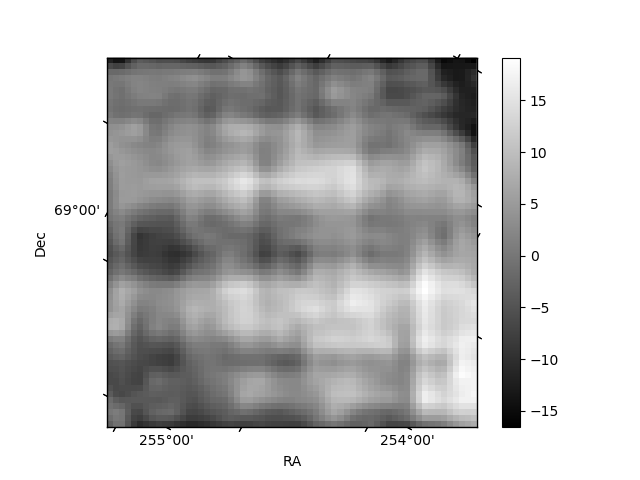
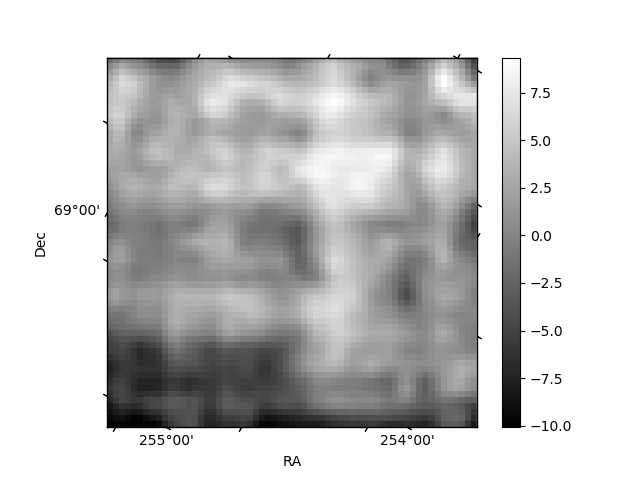
Histogram calculated using DETX and DETY for each event in the final _common_clean file
| Quadrant A | 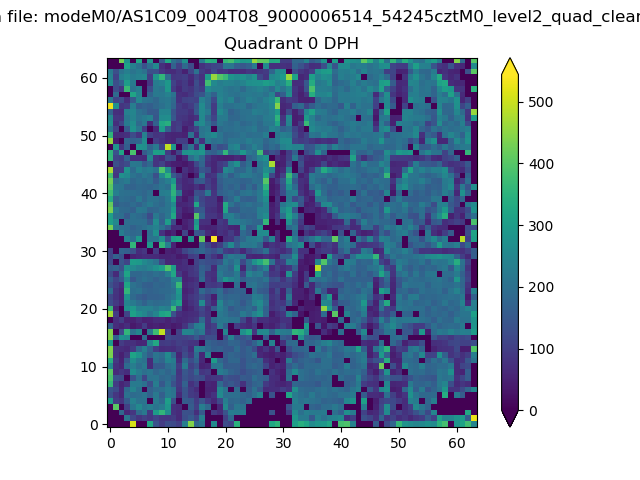 |
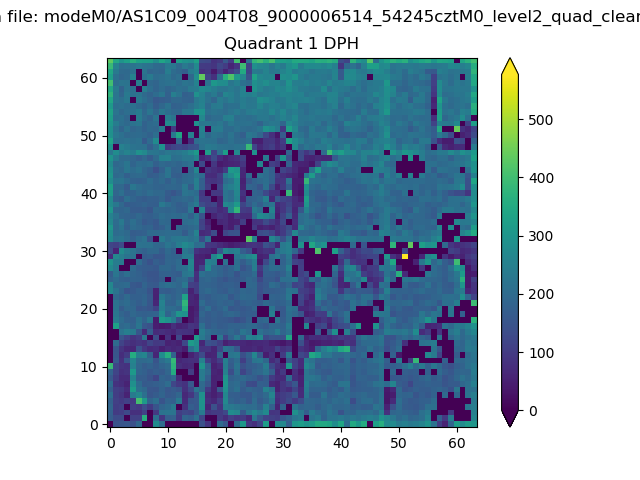 |
Quadrant B |
|---|---|---|---|
| Quadrant D | 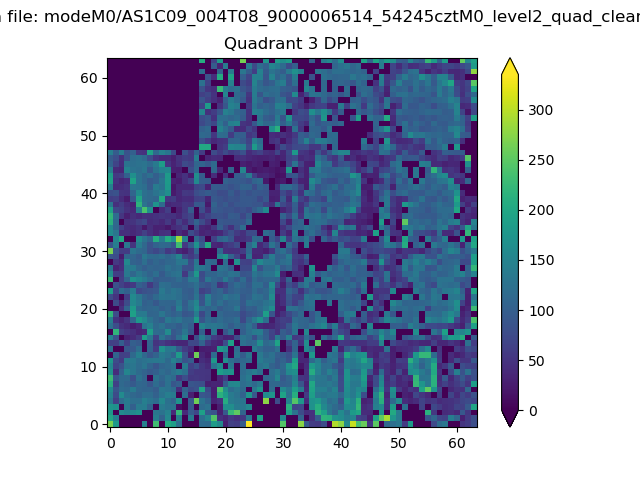 |
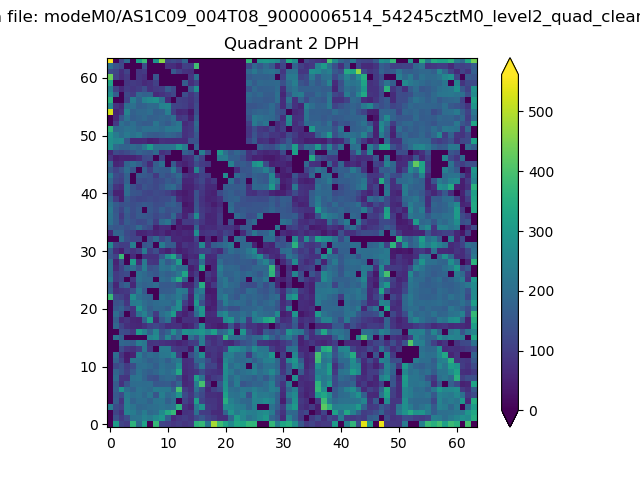 |
Quadrant C |
| Plot type | Count rate plots | Images |
|---|---|---|
| Comparison with Poisson distribution Blue bars denote a histogram of data divided into 1 sec bins. Red curve is a Poisson curve with rate = median count rate of data. |
 |
 |
| Quadrant-wise count rates Data is divided into 100 sec bins |
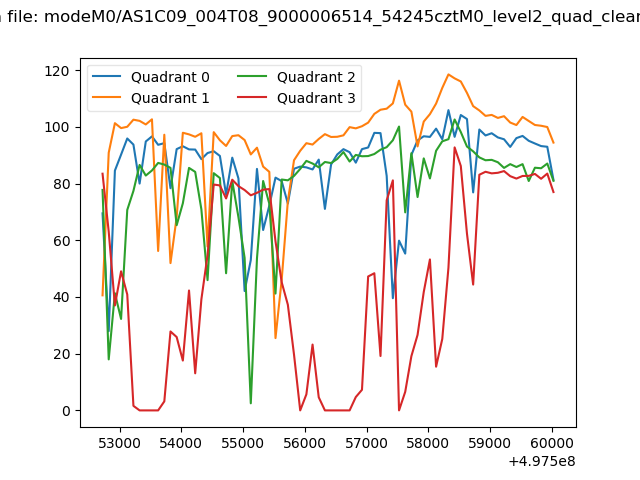 |
|
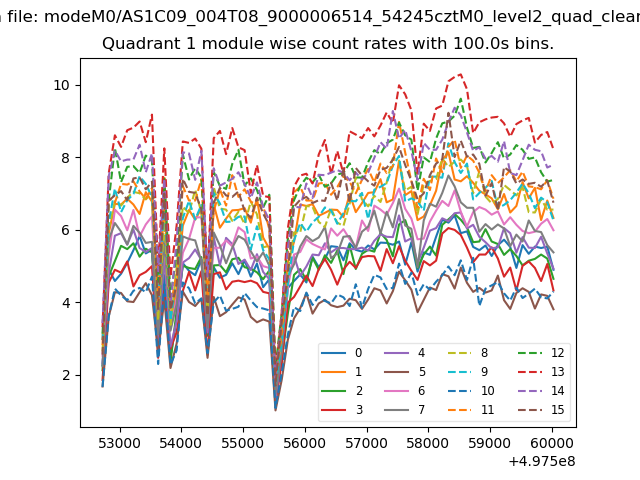
| Module-wise count rates for Quadrant A Data is divided into 100 sec bins |
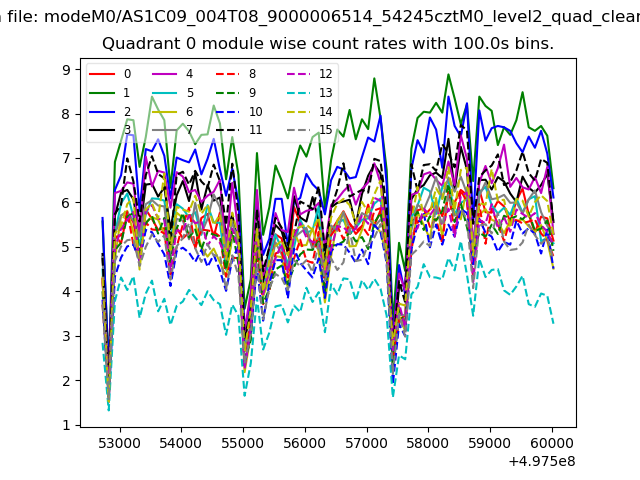 |
 |
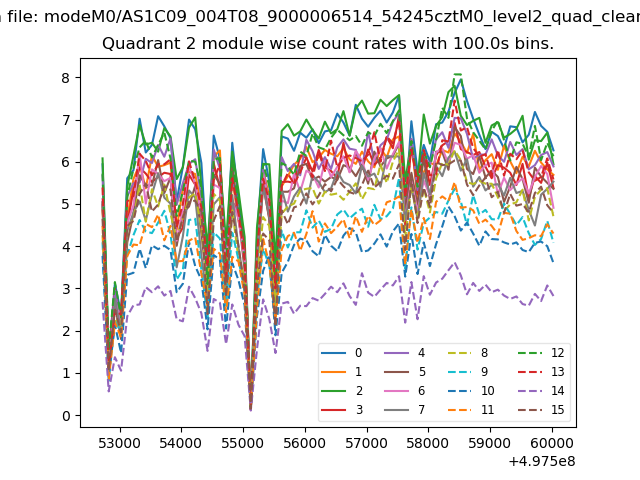
| Module-wise count rates for Quadrant B Data is divided into 100 sec bins |
 |
 |
| Module-wise count rates for Quadrant C Data is divided into 100 sec bins |
 |
 |
| Module-wise count rates for Quadrant D Data is divided into 100 sec bins |
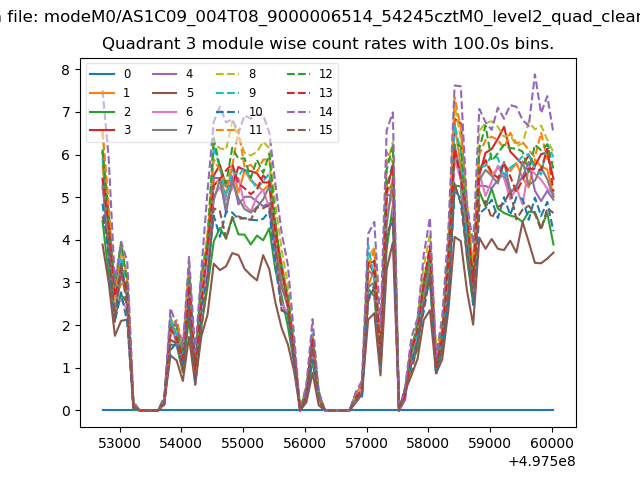 |
 |
| Parameter | Plot |
|---|---|
| CZT HV Monitor | 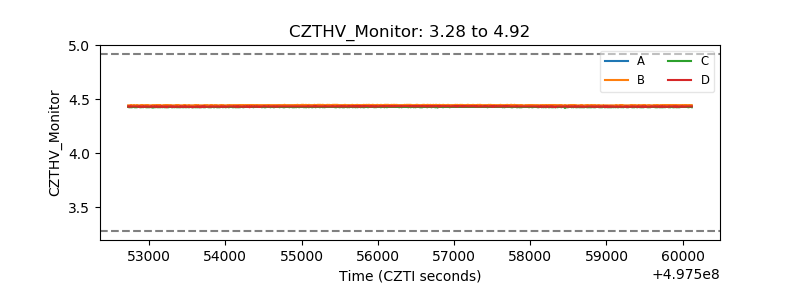 |
| D_VDD | 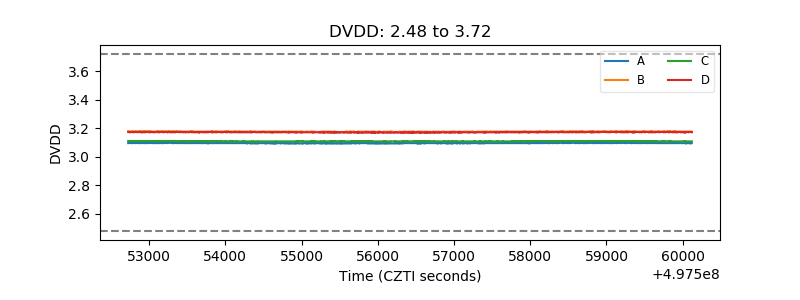 |
| Temperature 1 | 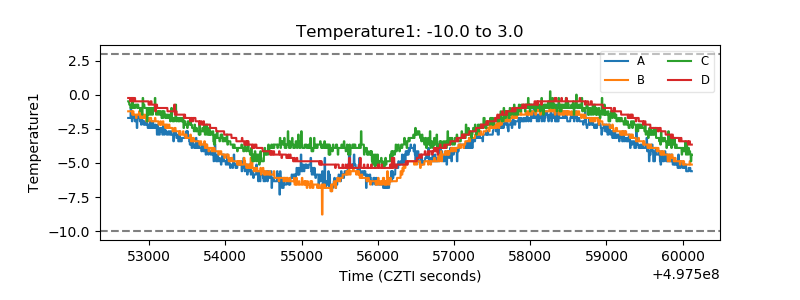 |
| Veto HV Monitor |  |
| Veto LLD | 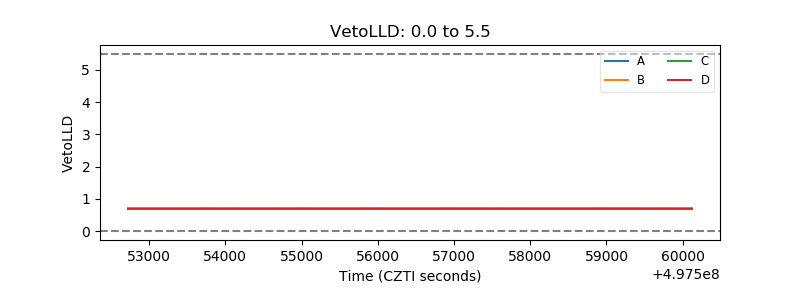 |
| Alpha Counter | 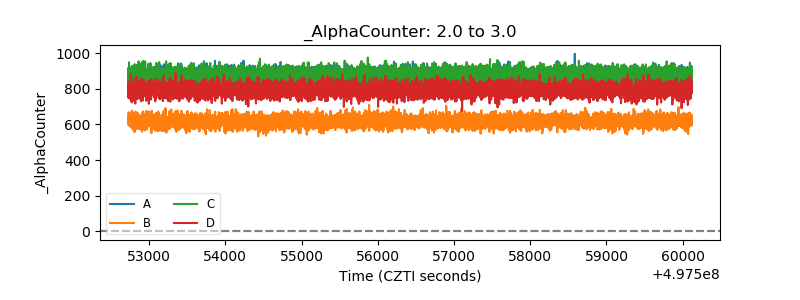 |
| _CPM_Rate |  |
| CZT Counter | 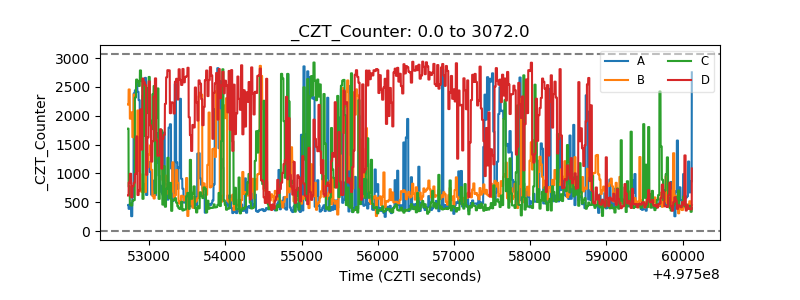 |
| +2.5 Volts monitor |  |
| +5 Volts monitor |  |
| _ROLL_ROT | 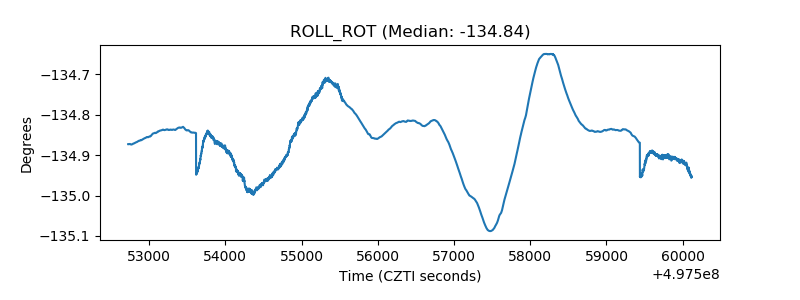 |
| _Roll_DEC | 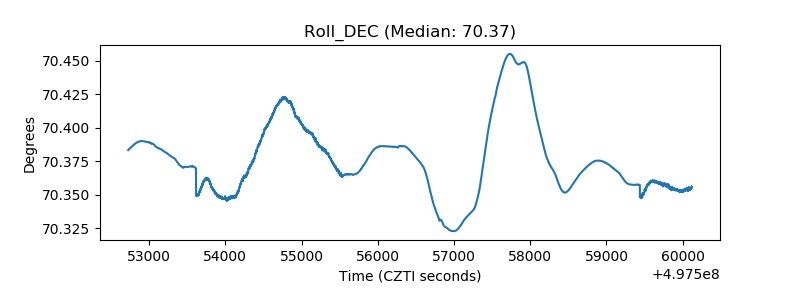 |
| _Roll_RA | 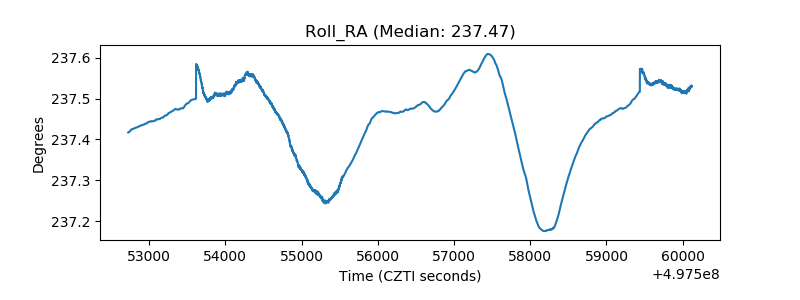 |
| Veto Counter | 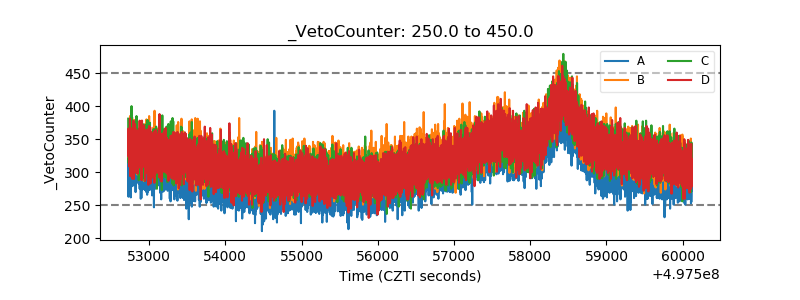 |