| Param | Original file | Final file |
|---|---|---|
| Filename | modeM0/AS1C09_004T08_9000006514_54246cztM0_level2.fits | modeM0/AS1C09_004T08_9000006514_54246cztM0_level2_quad_clean.evt |
| Size (bytes) | 845,173,440 | 106,505,280 |
| Size | 806.0 MB | 101.6 MB |
| Events in quadrant A | 9,314,542 | 625,955 |
| Events in quadrant B | 5,490,271 | 835,857 |
| Events in quadrant C | 4,626,294 | 730,720 |
| Events in quadrant D | 11,215,276 | 458,632 |
| Mode M0 | |||
|---|---|---|---|
| Quadrant | BADHDUFLAG | Total packets | Discarded packets |
| A | 0 | 33329 | 0 |
| B | 0 | 21883 | 0 |
| C | 0 | 19719 | 0 |
| D | 0 | 39099 | 0 |
| Mode SS | |||
|---|---|---|---|
| Quadrant | BADHDUFLAG | Total packets | Discarded packets |
| A | 0 | 164 | 0 |
| B | 0 | 164 | 0 |
| C | 0 | 164 | 0 |
| D | 0 | 164 | 0 |
| Quadrant | Total seconds | Saturated seconds | Saturation percentage |
|---|---|---|---|
| A | 8253 | 1870 | 22.658427% |
| B | 8253 | 217 | 2.629347% |
| C | 8254 | 157 | 1.902108% |
| D | 8254 | 2913 | 35.291980% |
Noise dominated data is calculated using 1-second bins in cleaned event files. If a bin has >2000 counts, and if more than 50% of those come from <1% of pixels, then it is considered to be noise-dominated and hence unusable.
| Quadrant | # 1 sec bins | Bins with >0 counts | Bins with >2000 counts | High rate bins dominated by noise | Noise dominated (total time) | Noise dominated (detector-on time) | Marked lightcurve |
|---|---|---|---|---|---|---|---|
| A | 8253 | 8253 | 1565 | 1565 | 18.96% | 18.96% | 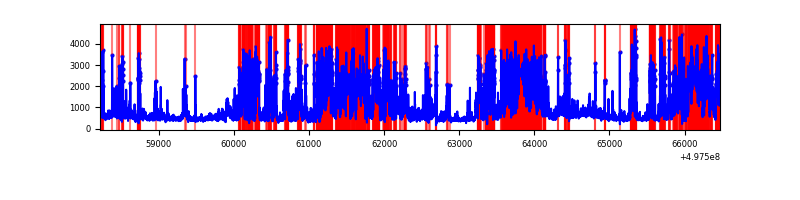 |
| B | 8253 | 8253 | 95 | 95 | 1.15% | 1.15% | 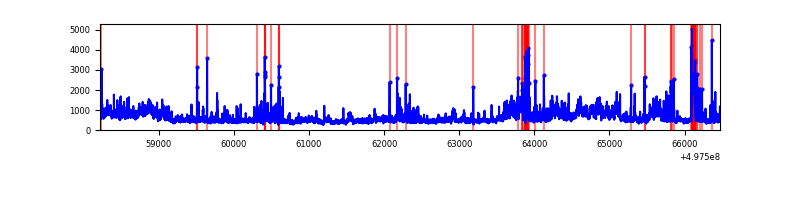 |
| C | 8254 | 8254 | 128 | 128 | 1.55% | 1.55% | 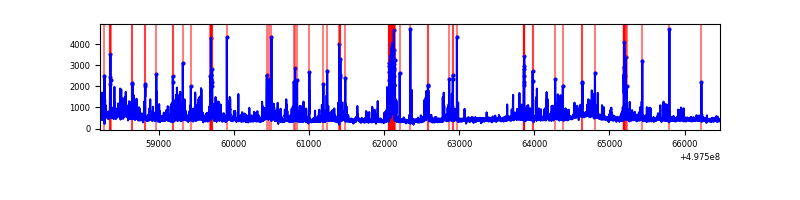 |
| D | 8254 | 8254 | 2515 | 2515 | 30.47% | 30.47% | 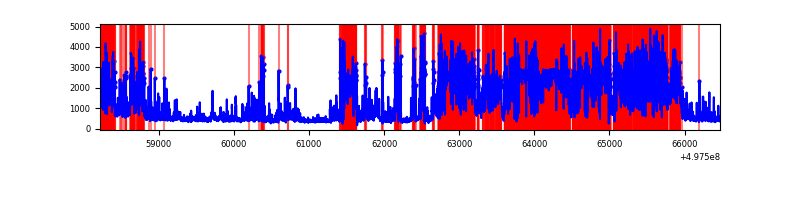 |
Top three noisy pixels from each quadrant. If the there are fewer than three noisy pixels in the level2.evt file, extra rows are filled as -1
| Pixel properties | Quadrant properties | ||||||
|---|---|---|---|---|---|---|---|
| Quadrant | DetID | PixID | Counts | Sigma | Mean | Median | Sigma |
| A | 7 | 29 | 4584822 | 23334.21 | 790 | 770 | 196.5 |
| A | 7 | 14 | 331140 | 1681.68 | 790 | 770 | 196.5 |
| A | 13 | 248 | 320593 | 1628.0 | 790 | 770 | 196.5 |
| B | 7 | 0 | 1268971 | 6847.46 | 867 | 835 | 185.2 |
| B | 4 | 81 | 159161 | 854.9 | 867 | 835 | 185.2 |
| B | 5 | 185 | 91830 | 491.34 | 867 | 835 | 185.2 |
| C | 14 | 254 | 372044 | 1592.96 | 855 | 846 | 233.0 |
| C | 15 | 189 | 278181 | 1190.16 | 855 | 846 | 233.0 |
| C | 12 | 250 | 225563 | 964.35 | 855 | 846 | 233.0 |
| D | 8 | 176 | 7119397 | 36685.91 | 672 | 641 | 194.0 |
| D | 3 | 12 | 590631 | 3040.46 | 672 | 641 | 194.0 |
| D | 2 | 153 | 318748 | 1639.34 | 672 | 641 | 194.0 |
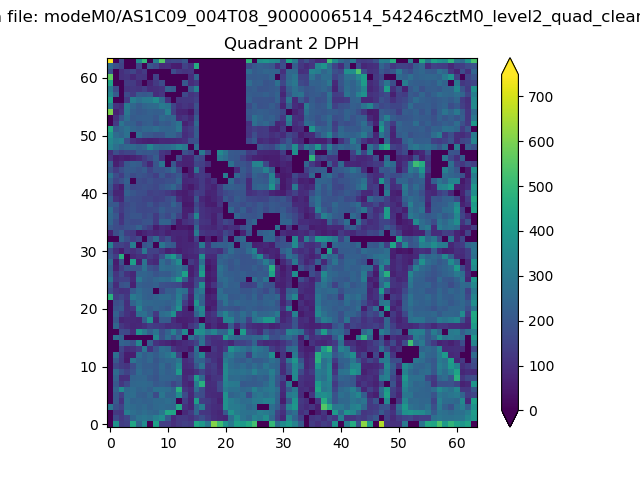
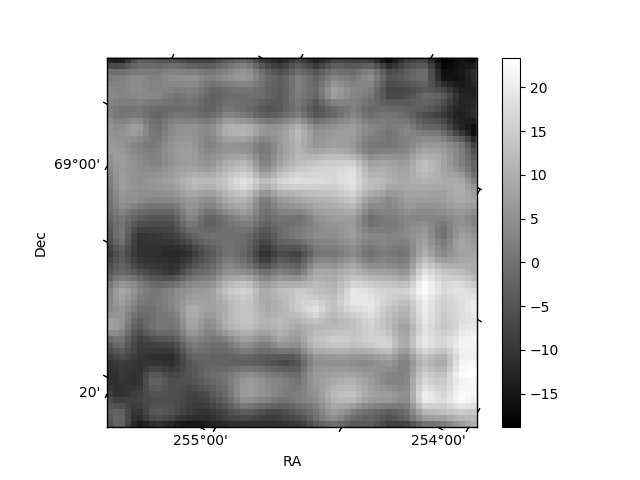
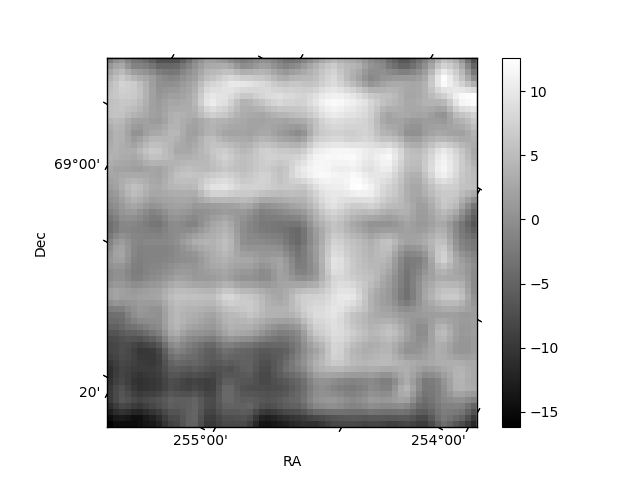
Histogram calculated using DETX and DETY for each event in the final _common_clean file
| Quadrant A |  |
 |
Quadrant B |
|---|---|---|---|
| Quadrant D | 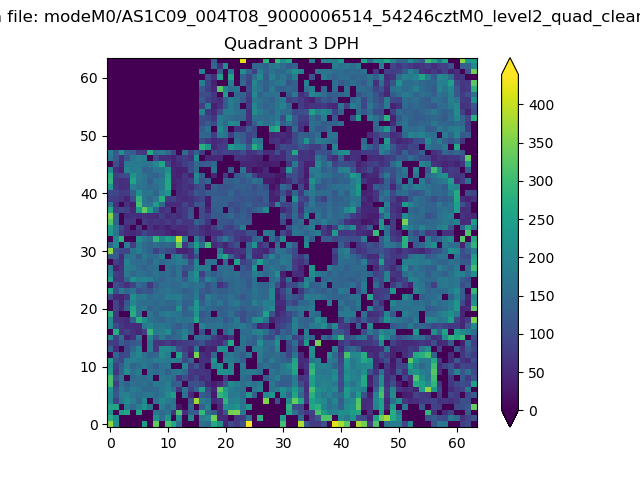 |
 |
Quadrant C |
| Plot type | Count rate plots | Images |
|---|---|---|
| Comparison with Poisson distribution Blue bars denote a histogram of data divided into 1 sec bins. Red curve is a Poisson curve with rate = median count rate of data. |
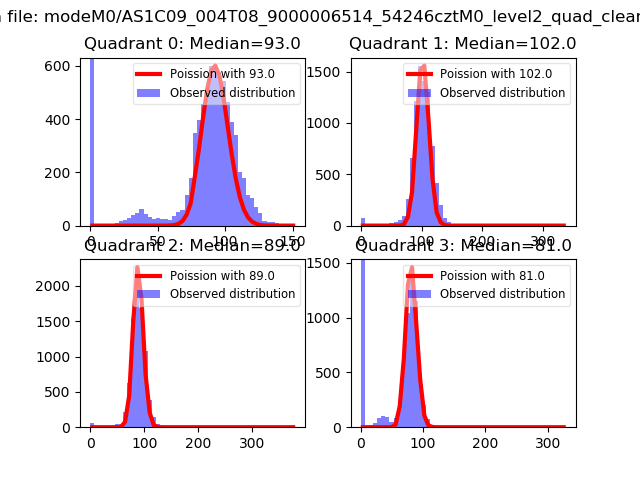 |
 |
| Quadrant-wise count rates Data is divided into 100 sec bins |
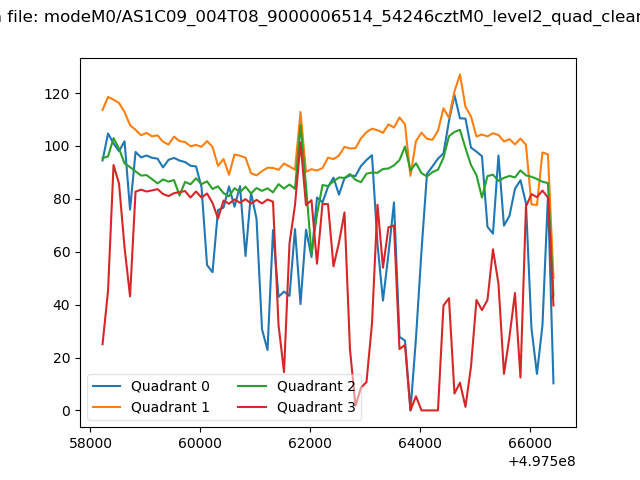 |
|
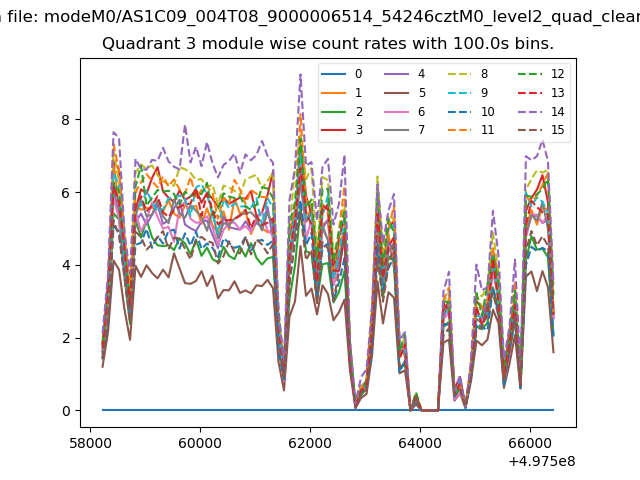
| Module-wise count rates for Quadrant A Data is divided into 100 sec bins |
 |
 |
| Module-wise count rates for Quadrant B Data is divided into 100 sec bins |
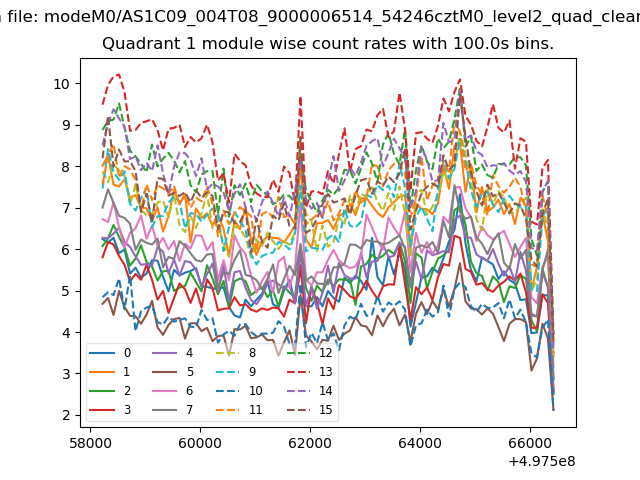 |
 |
| Module-wise count rates for Quadrant C Data is divided into 100 sec bins |
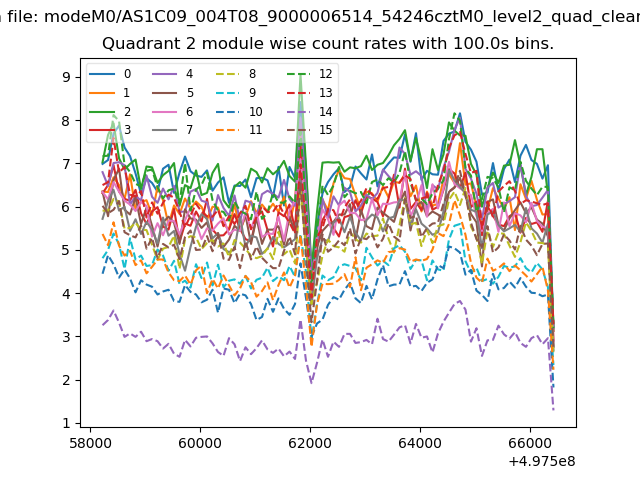 |
 |
| Module-wise count rates for Quadrant D Data is divided into 100 sec bins |
 |
 |
| Parameter | Plot |
|---|---|
| CZT HV Monitor | 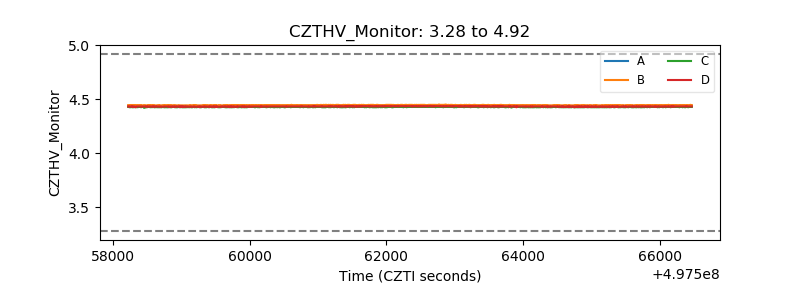 |
| D_VDD | 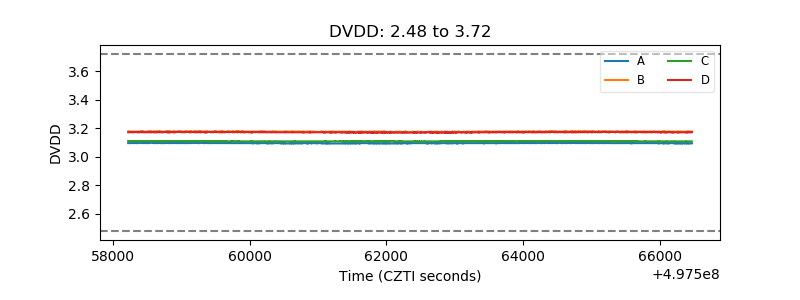 |
| Temperature 1 | 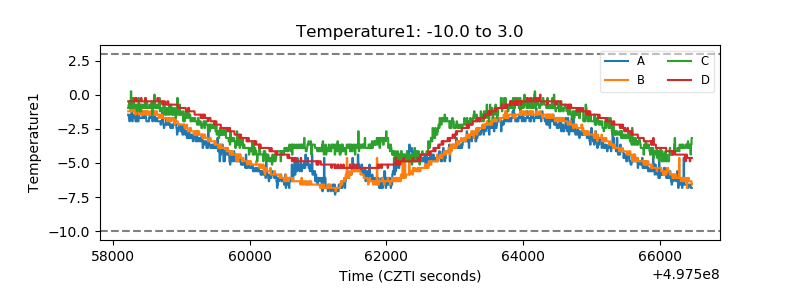 |
| Veto HV Monitor |  |
| Veto LLD | 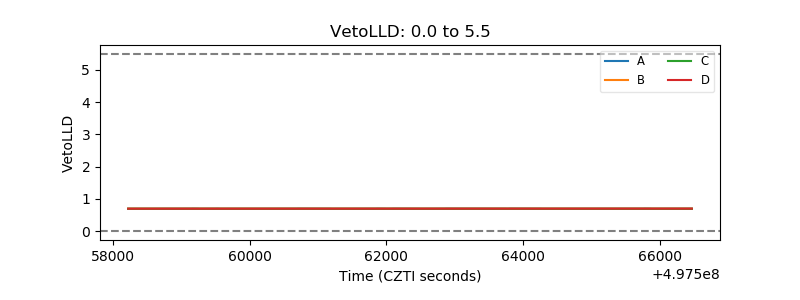 |
| Alpha Counter | 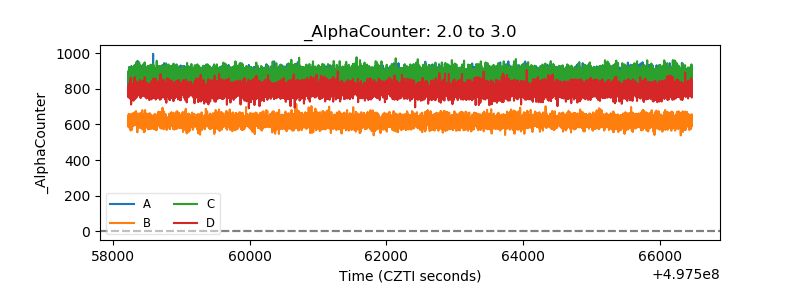 |
| _CPM_Rate | 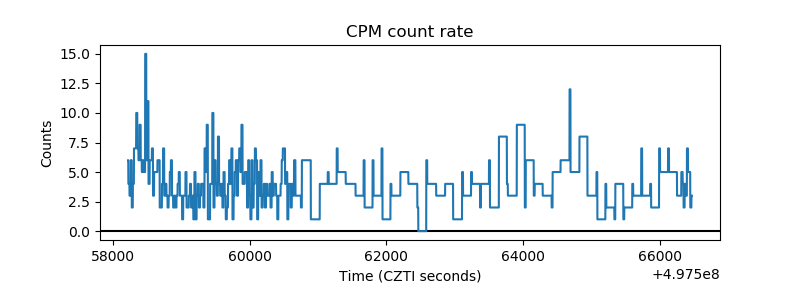 |
| CZT Counter | 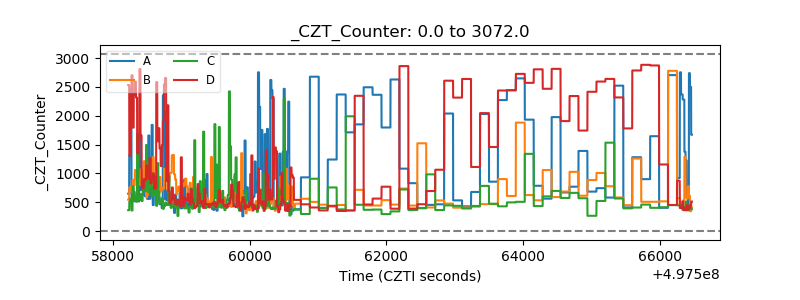 |
| +2.5 Volts monitor | 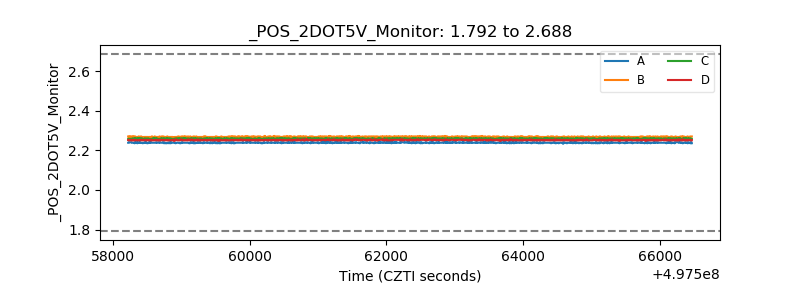 |
| +5 Volts monitor |  |
| _ROLL_ROT | 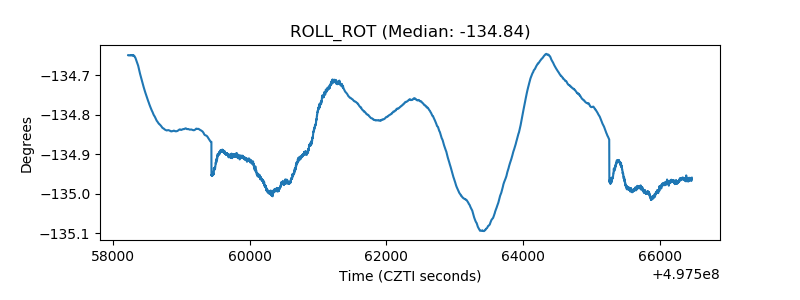 |
| _Roll_DEC | 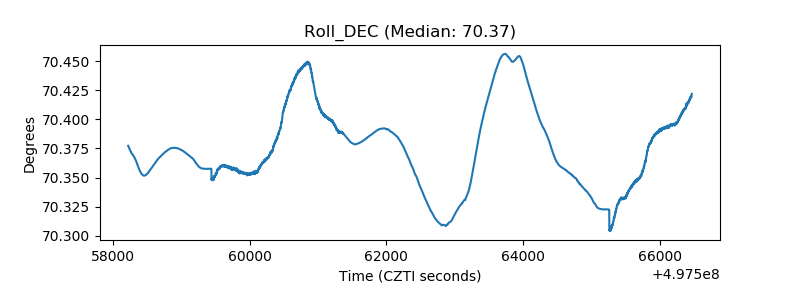 |
| _Roll_RA | 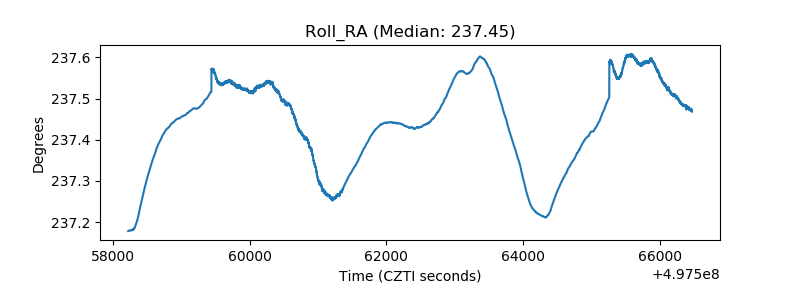 |
| Veto Counter | 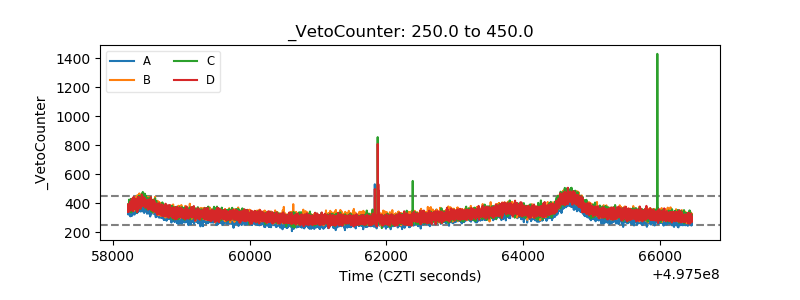 |