| Param | Original file | Final file |
|---|---|---|
| Filename | modeM0/AS1C09_004T08_9000006514_54249cztM0_level2.fits | modeM0/AS1C09_004T08_9000006514_54249cztM0_level2_quad_clean.evt |
| Size (bytes) | 2,118,072,960 | 225,564,480 |
| Size | 2.0 GB | 215.1 MB |
| Events in quadrant A | 21,988,947 | 1,293,475 |
| Events in quadrant B | 11,809,706 | 1,855,434 |
| Events in quadrant C | 13,964,165 | 1,445,364 |
| Events in quadrant D | 29,180,849 | 929,207 |
| Mode M0 | |||
|---|---|---|---|
| Quadrant | BADHDUFLAG | Total packets | Discarded packets |
| A | 0 | 78541 | 3 |
| B | 0 | 48106 | 3 |
| C | 0 | 55483 | 3 |
| D | 0 | 99774 | 3 |
| Mode M9 | |||
|---|---|---|---|
| Quadrant | BADHDUFLAG | Total packets | Discarded packets |
| A | 0 | 14 | 0 |
| B | 0 | 14 | 0 |
| C | 0 | 14 | 0 |
| D | 0 | 14 | 0 |
| Mode SS | |||
|---|---|---|---|
| Quadrant | BADHDUFLAG | Total packets | Discarded packets |
| A | 0 | 386 | 0 |
| B | 0 | 386 | 0 |
| C | 0 | 386 | 0 |
| D | 0 | 386 | 0 |
| Quadrant | Total seconds | Saturated seconds | Saturation percentage |
|---|---|---|---|
| A | 18931 | 4862 | 25.682743% |
| B | 18932 | 434 | 2.292415% |
| C | 18932 | 2147 | 11.340587% |
| D | 18932 | 7767 | 41.025776% |
Noise dominated data is calculated using 1-second bins in cleaned event files. If a bin has >2000 counts, and if more than 50% of those come from <1% of pixels, then it is considered to be noise-dominated and hence unusable.
| Quadrant | # 1 sec bins | Bins with >0 counts | Bins with >2000 counts | High rate bins dominated by noise | Noise dominated (total time) | Noise dominated (detector-on time) | Marked lightcurve |
|---|---|---|---|---|---|---|---|
| A | 20391 | 18934 | 3915 | 3915 | 19.20% | 20.68% | 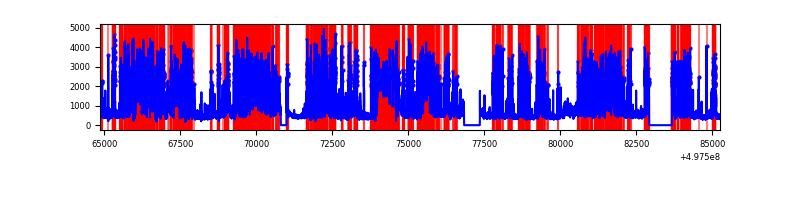 |
| B | 20392 | 18935 | 134 | 134 | 0.66% | 0.71% | 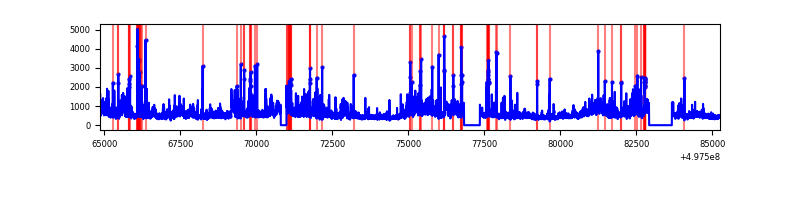 |
| C | 20392 | 18933 | 1872 | 1872 | 9.18% | 9.89% | 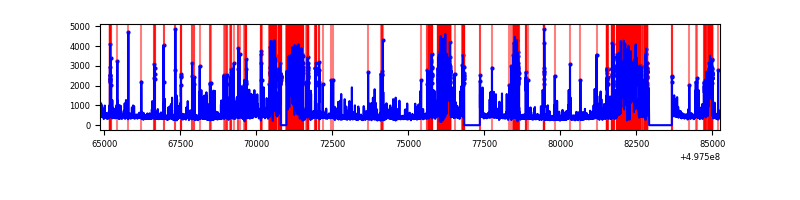 |
| D | 20392 | 18935 | 6893 | 6893 | 33.80% | 36.40% | 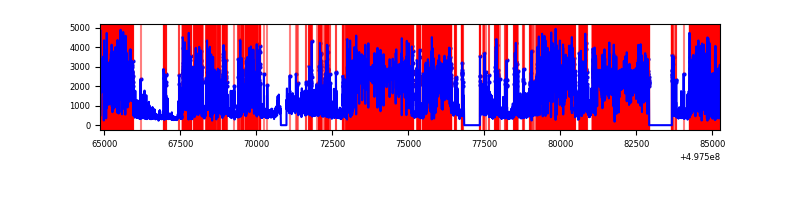 |
Top three noisy pixels from each quadrant. If the there are fewer than three noisy pixels in the level2.evt file, extra rows are filled as -1
| Pixel properties | Quadrant properties | ||||||
|---|---|---|---|---|---|---|---|
| Quadrant | DetID | PixID | Counts | Sigma | Mean | Median | Sigma |
| A | 7 | 29 | 9494019 | 22349.27 | 1725 | 1679 | 424.7 |
| A | 15 | 174 | 2243097 | 5277.31 | 1725 | 1679 | 424.7 |
| A | 12 | 17 | 1557954 | 3664.18 | 1725 | 1679 | 424.7 |
| B | 7 | 0 | 2703747 | 6491.28 | 1959 | 1889 | 416.2 |
| B | 5 | 172 | 357630 | 854.68 | 1959 | 1889 | 416.2 |
| B | 0 | 213 | 207610 | 494.25 | 1959 | 1889 | 416.2 |
| C | 1 | 241 | 4463490 | 9080.93 | 1795 | 1778 | 491.3 |
| C | 14 | 254 | 827462 | 1680.52 | 1795 | 1778 | 491.3 |
| C | 1 | 29 | 644901 | 1308.95 | 1795 | 1778 | 491.3 |
| D | 8 | 176 | 18777055 | 45191.23 | 1466 | 1400 | 415.5 |
| D | 3 | 12 | 2819147 | 6782.05 | 1466 | 1400 | 415.5 |
| D | 13 | 170 | 304696 | 730.0 | 1466 | 1400 | 415.5 |
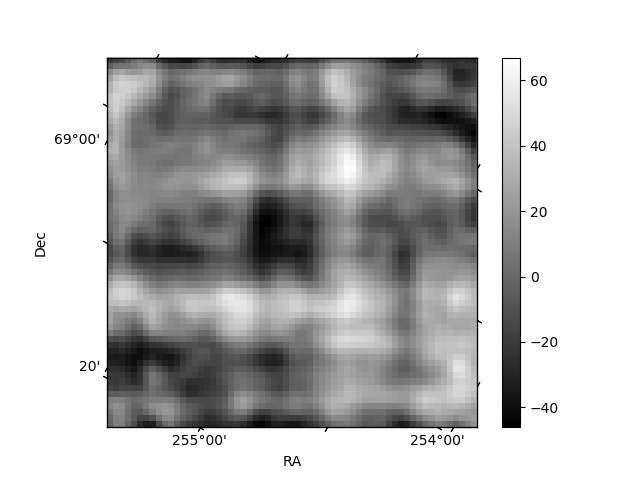
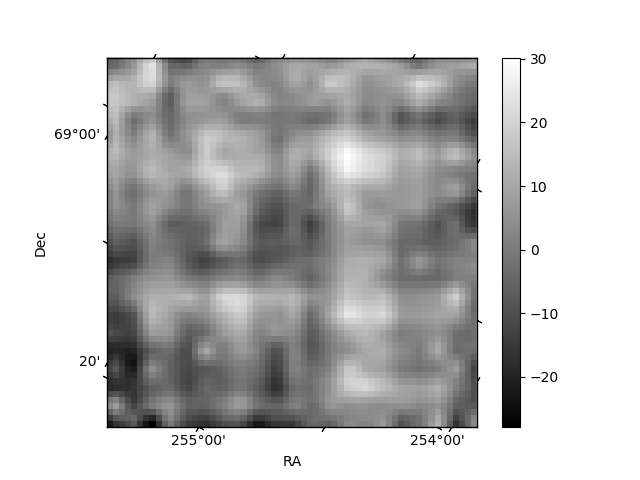
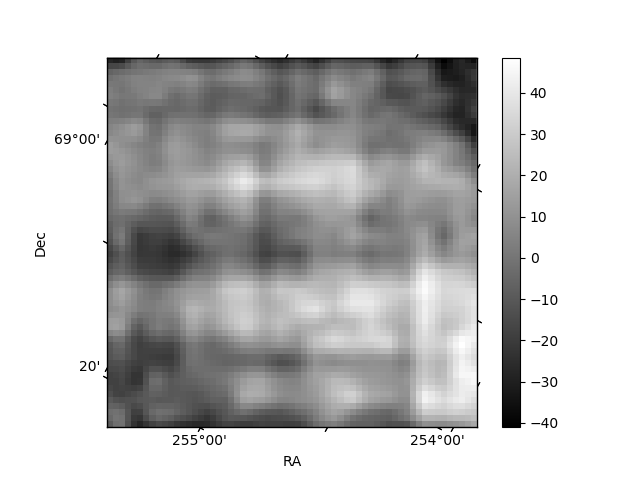
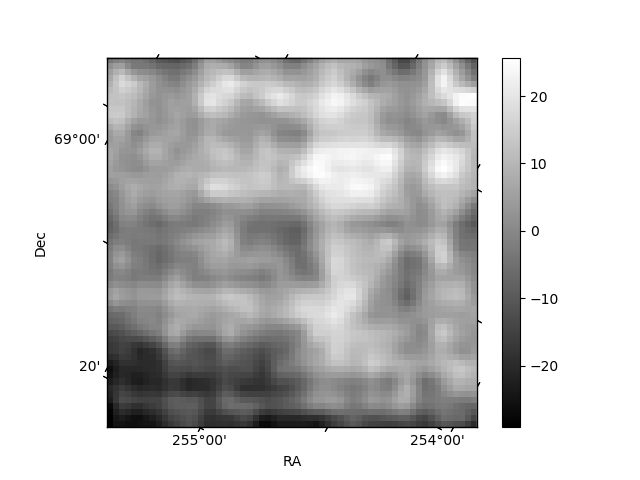
Histogram calculated using DETX and DETY for each event in the final _common_clean file
| Quadrant A | 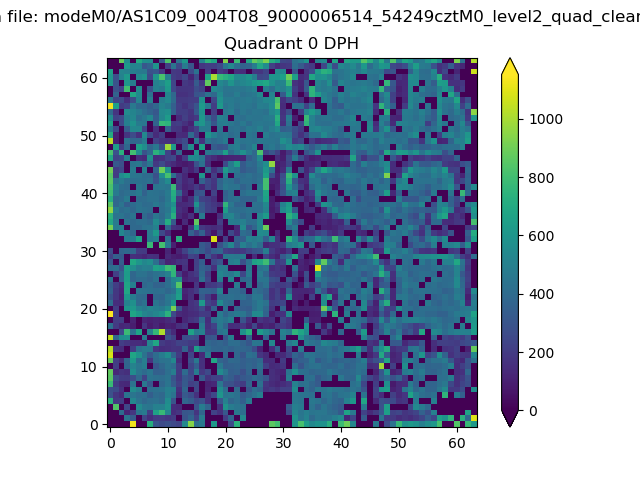 |
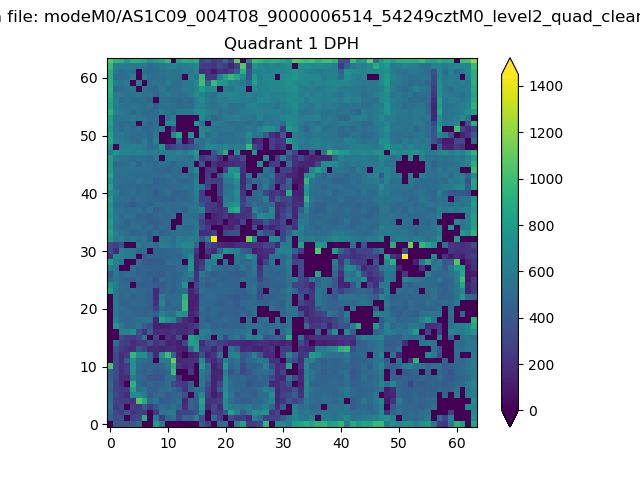 |
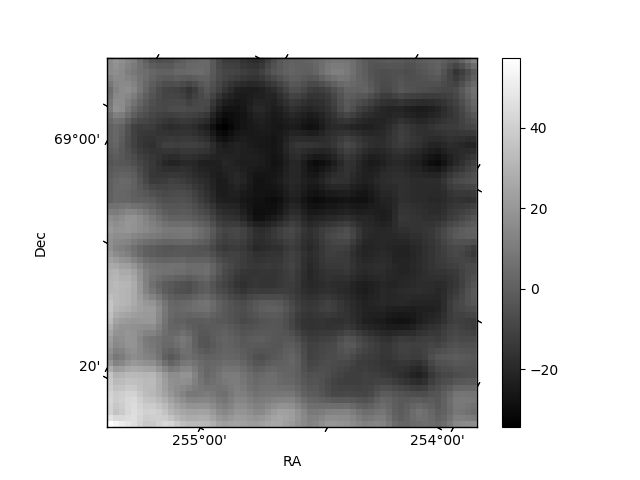
Quadrant B |
|---|---|---|---|
| Quadrant D | 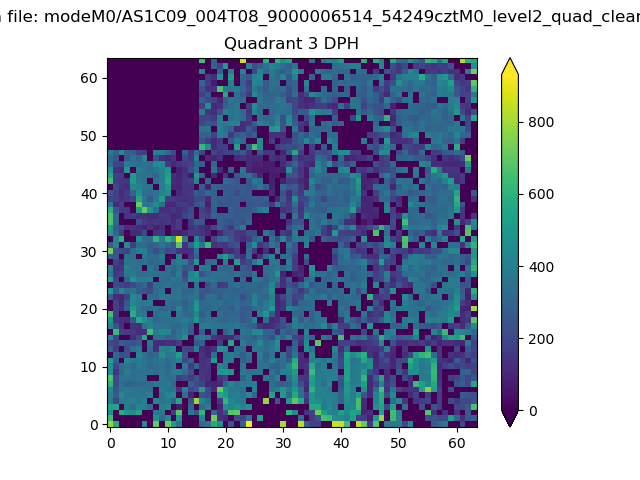 |
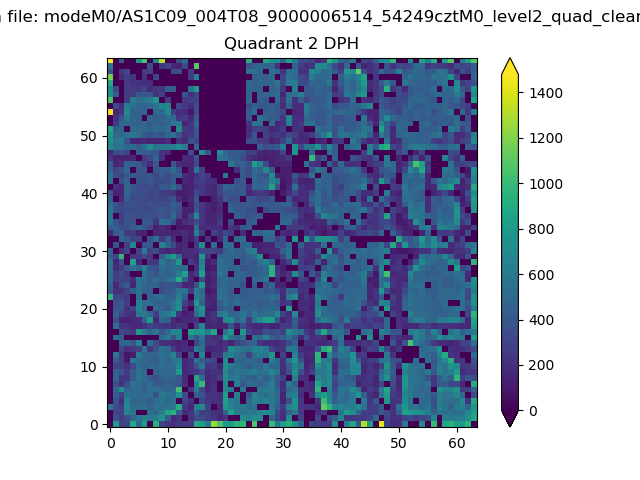 |
Quadrant C |
| Plot type | Count rate plots | Images |
|---|---|---|
| Comparison with Poisson distribution Blue bars denote a histogram of data divided into 1 sec bins. Red curve is a Poisson curve with rate = median count rate of data. |
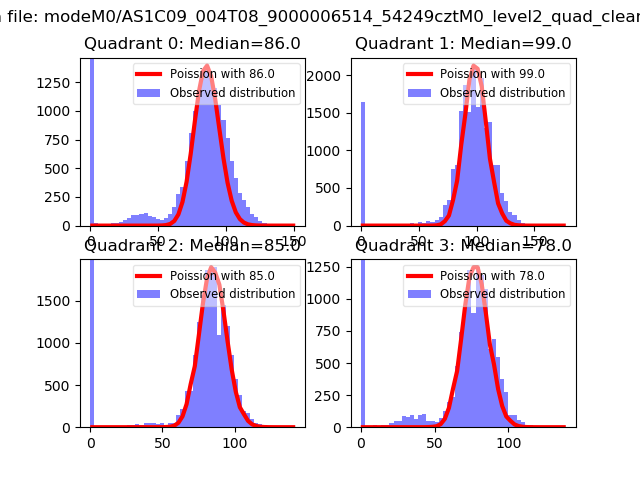 |
 |
| Quadrant-wise count rates Data is divided into 100 sec bins |
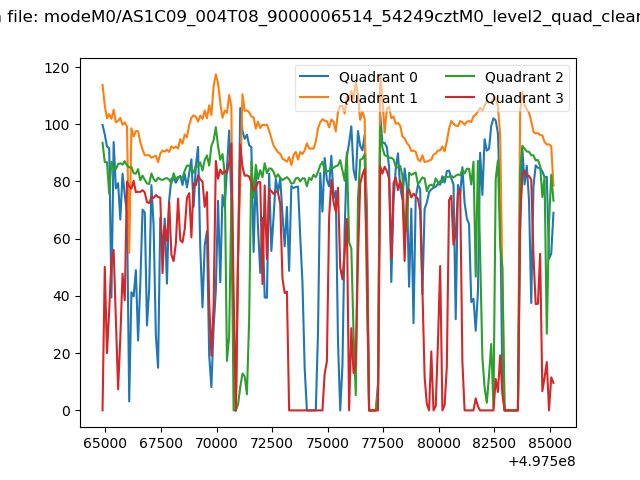 |
|
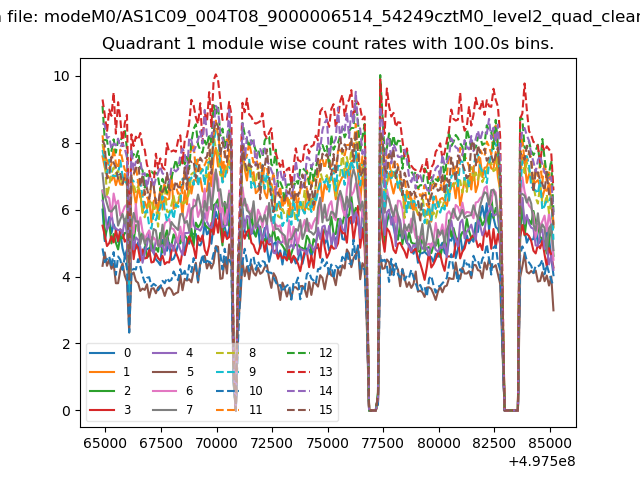
| Module-wise count rates for Quadrant A Data is divided into 100 sec bins |
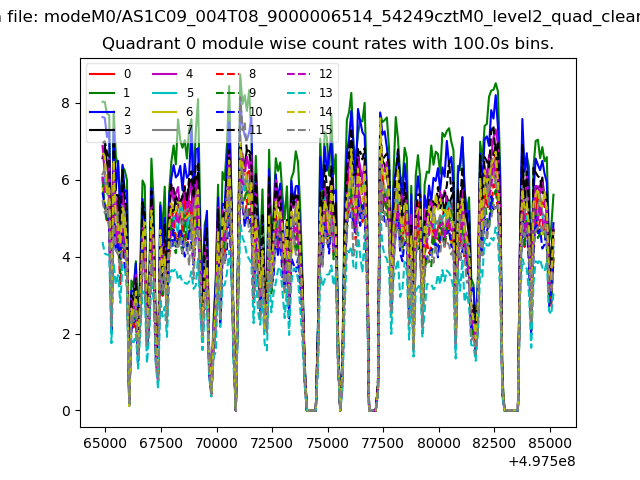 |
 |
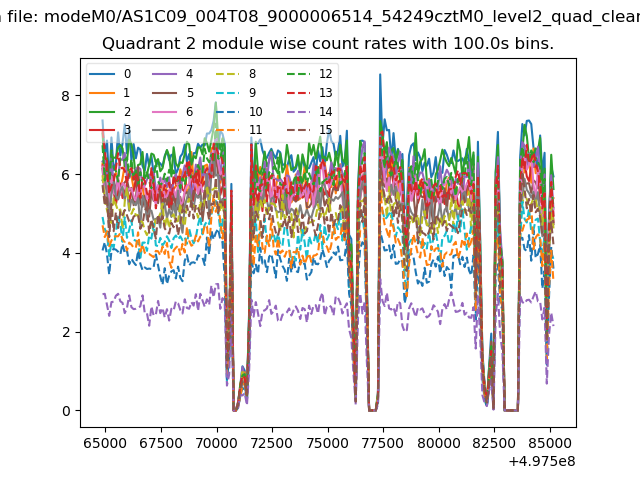
| Module-wise count rates for Quadrant B Data is divided into 100 sec bins |
 |
 |
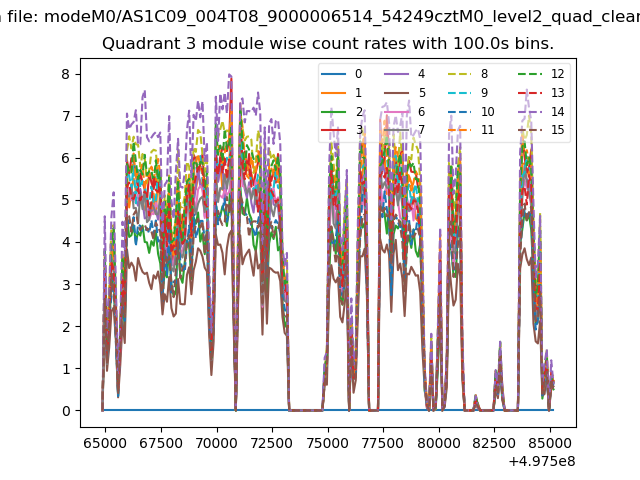
| Module-wise count rates for Quadrant C Data is divided into 100 sec bins |
 |
 |
| Module-wise count rates for Quadrant D Data is divided into 100 sec bins |
 |
 |
| Parameter | Plot |
|---|---|
| CZT HV Monitor | 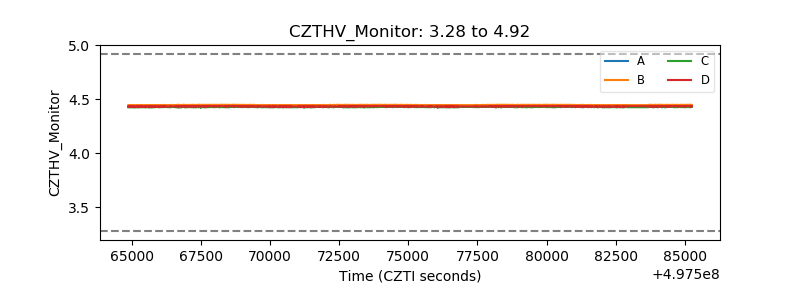 |
| D_VDD | 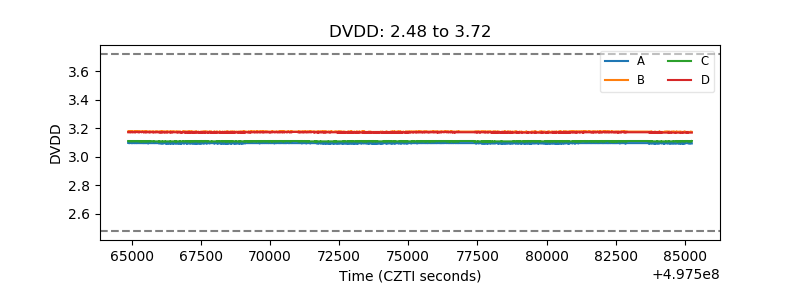 |
| Temperature 1 | 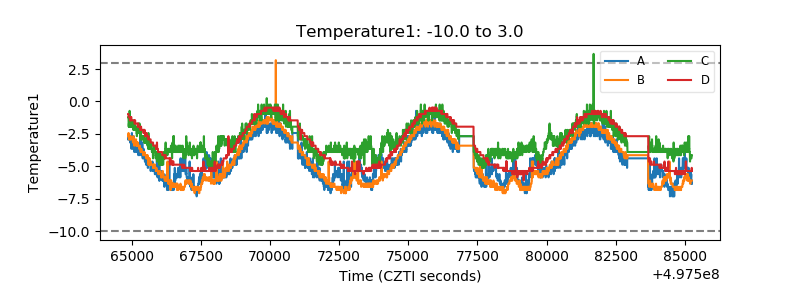 |
| Veto HV Monitor | 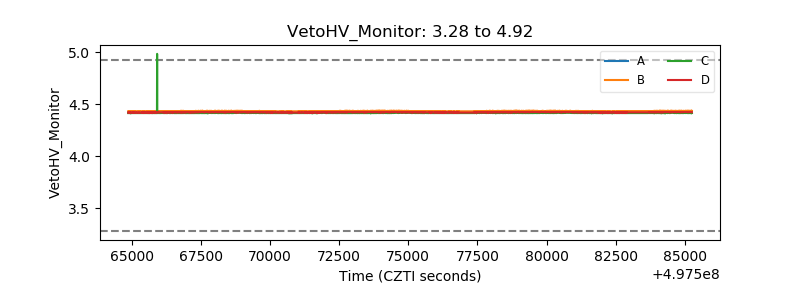 |
| Veto LLD | 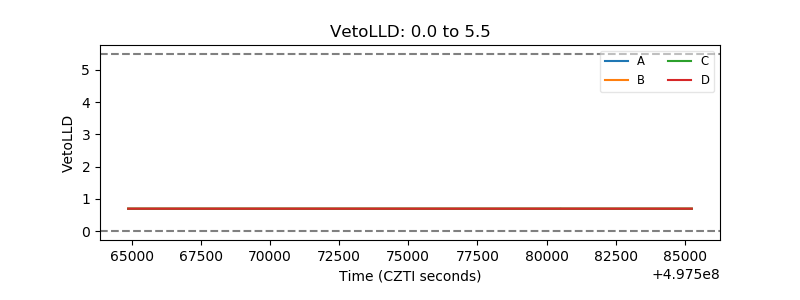 |
| Alpha Counter | 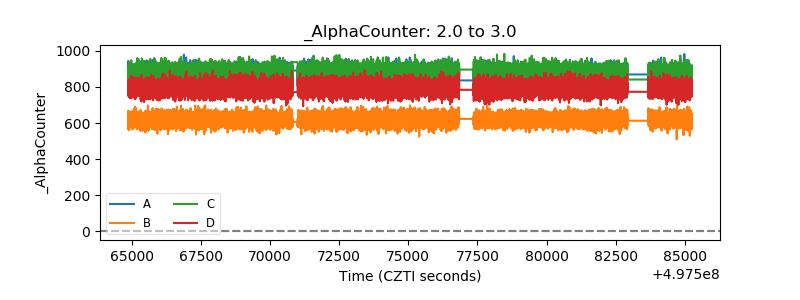 |
| _CPM_Rate | 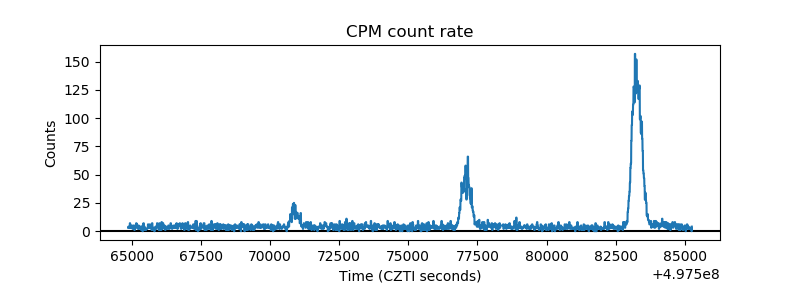 |
| CZT Counter | 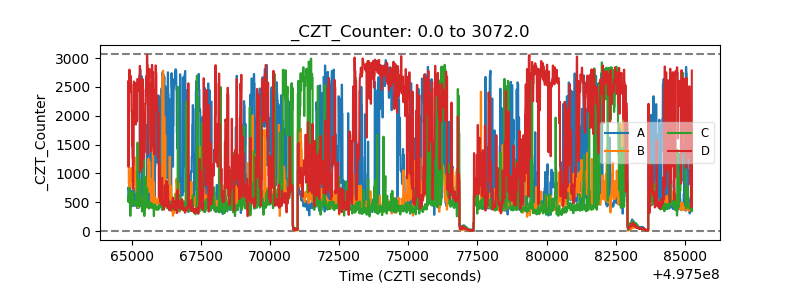 |
| +2.5 Volts monitor |  |
| +5 Volts monitor |  |
| _ROLL_ROT | 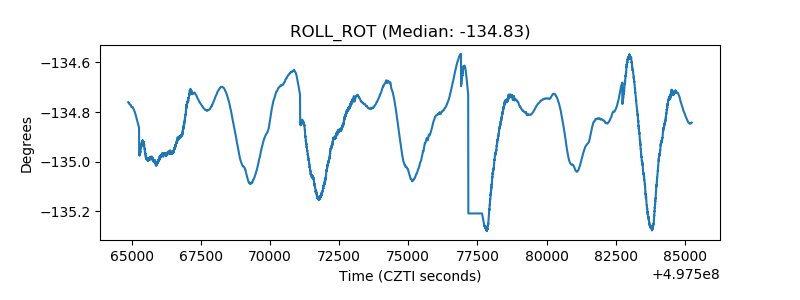 |
| _Roll_DEC | 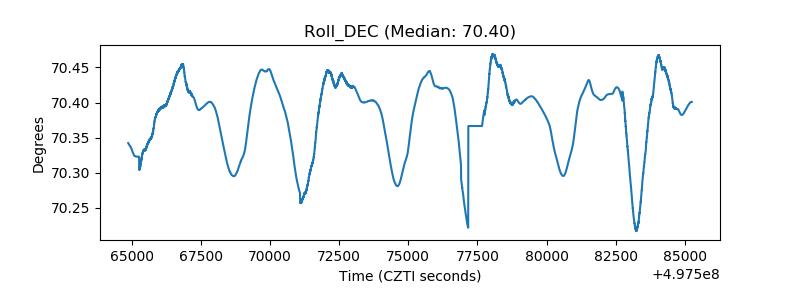 |
| _Roll_RA | 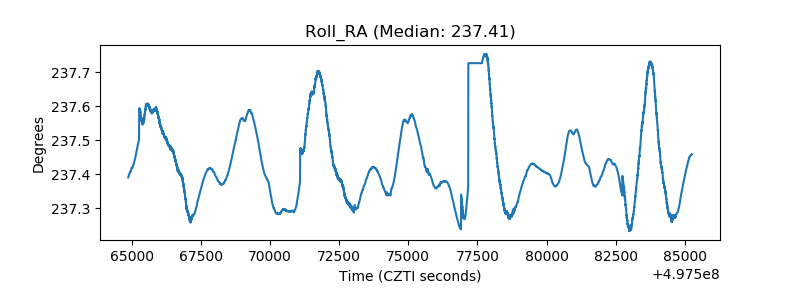 |
| Veto Counter | 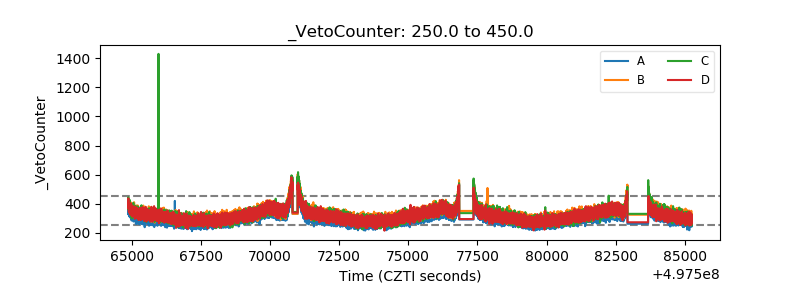 |