| Param | Original file | Final file |
|---|---|---|
| Filename | modeM0/AS1C09_004T08_9000006514_54250cztM0_level2.fits | modeM0/AS1C09_004T08_9000006514_54250cztM0_level2_quad_clean.evt |
| Size (bytes) | 751,694,400 | 70,758,720 |
| Size | 716.9 MB | 67.5 MB |
| Events in quadrant A | 6,796,163 | 454,352 |
| Events in quadrant B | 3,275,848 | 627,891 |
| Events in quadrant C | 4,870,835 | 504,226 |
| Events in quadrant D | 12,387,923 | 112,187 |
| Mode M0 | |||
|---|---|---|---|
| Quadrant | BADHDUFLAG | Total packets | Discarded packets |
| A | 0 | 24637 | 1 |
| B | 0 | 14129 | 1 |
| C | 0 | 19331 | 1 |
| D | 0 | 41181 | 1 |
| Mode M9 | |||
|---|---|---|---|
| Quadrant | BADHDUFLAG | Total packets | Discarded packets |
| A | 0 | 9 | 0 |
| B | 0 | 9 | 0 |
| C | 0 | 9 | 0 |
| D | 0 | 9 | 0 |
| Mode SS | |||
|---|---|---|---|
| Quadrant | BADHDUFLAG | Total packets | Discarded packets |
| A | 0 | 130 | 0 |
| B | 0 | 130 | 0 |
| C | 0 | 128 | 0 |
| D | 0 | 128 | 0 |
| Quadrant | Total seconds | Saturated seconds | Saturation percentage |
|---|---|---|---|
| A | 6355 | 1593 | 25.066876% |
| B | 6356 | 108 | 1.699182% |
| C | 6355 | 754 | 11.864673% |
| D | 6355 | 5181 | 81.526357% |
Noise dominated data is calculated using 1-second bins in cleaned event files. If a bin has >2000 counts, and if more than 50% of those come from <1% of pixels, then it is considered to be noise-dominated and hence unusable.
| Quadrant | # 1 sec bins | Bins with >0 counts | Bins with >2000 counts | High rate bins dominated by noise | Noise dominated (total time) | Noise dominated (detector-on time) | Marked lightcurve |
|---|---|---|---|---|---|---|---|
| A | 7220 | 6356 | 1266 | 1266 | 17.53% | 19.92% | 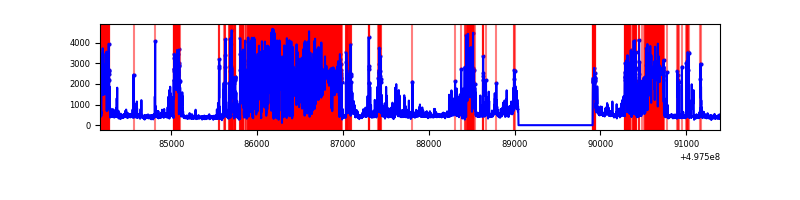 |
| B | 7221 | 6357 | 49 | 49 | 0.68% | 0.77% | 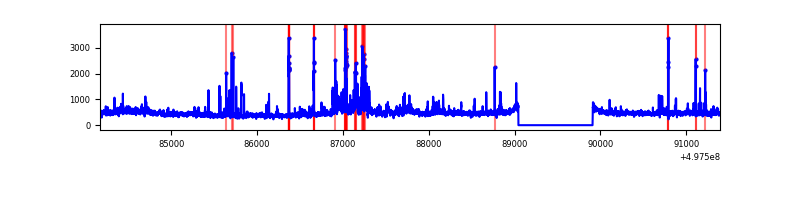 |
| C | 7220 | 6356 | 644 | 644 | 8.92% | 10.13% | 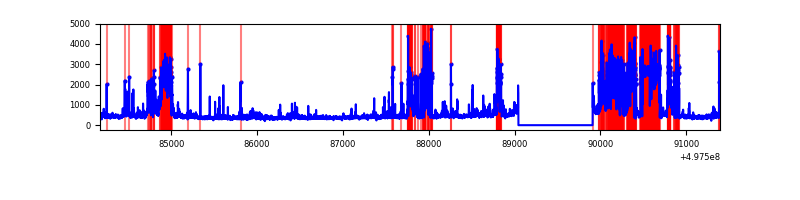 |
| D | 7219 | 6354 | 3414 | 3414 | 47.29% | 53.73% | 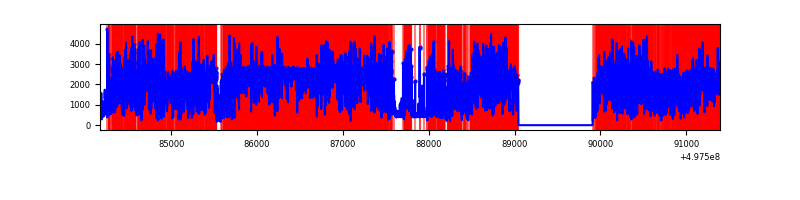 |
Top three noisy pixels from each quadrant. If the there are fewer than three noisy pixels in the level2.evt file, extra rows are filled as -1
| Pixel properties | Quadrant properties | ||||||
|---|---|---|---|---|---|---|---|
| Quadrant | DetID | PixID | Counts | Sigma | Mean | Median | Sigma |
| A | 7 | 29 | 4272420 | 31075.66 | 563 | 549 | 137.5 |
| A | 15 | 174 | 92464 | 668.63 | 563 | 549 | 137.5 |
| A | 13 | 248 | 84897 | 613.59 | 563 | 549 | 137.5 |
| B | 7 | 0 | 207430 | 1453.54 | 656 | 632 | 142.3 |
| B | 8 | 234 | 204297 | 1431.52 | 656 | 632 | 142.3 |
| B | 0 | 213 | 108707 | 759.64 | 656 | 632 | 142.3 |
| C | 1 | 241 | 1587746 | 9514.35 | 607 | 602 | 166.8 |
| C | 1 | 29 | 452609 | 2709.62 | 607 | 602 | 166.8 |
| C | 12 | 2 | 249317 | 1490.96 | 607 | 602 | 166.8 |
| D | 8 | 176 | 10790301 | 150182.4 | 245 | 233 | 71.8 |
| D | 12 | 3 | 388420 | 5403.01 | 245 | 233 | 71.8 |
| D | 10 | 181 | 51434 | 712.65 | 245 | 233 | 71.8 |
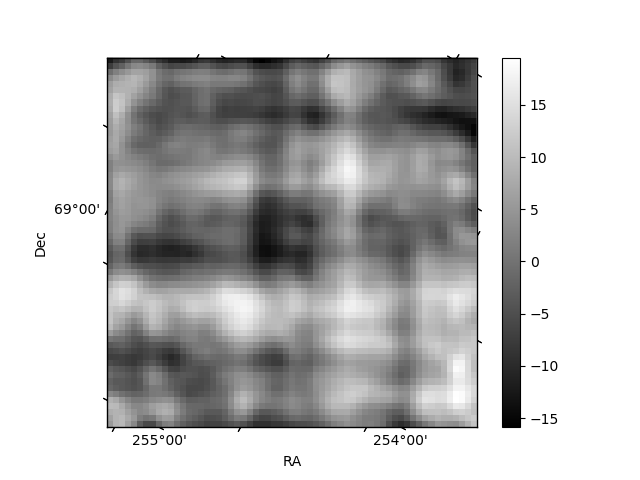
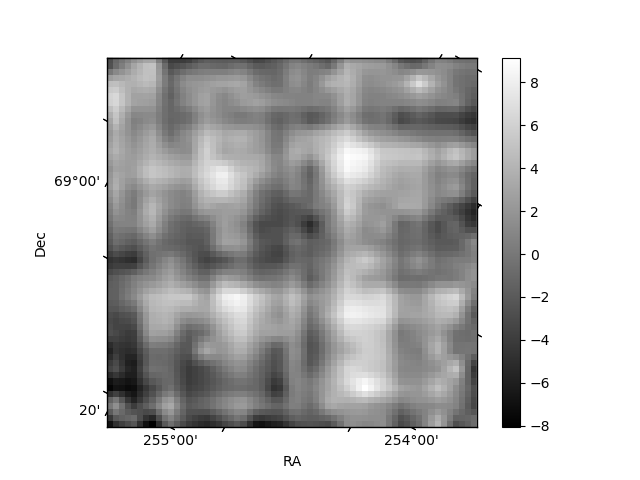
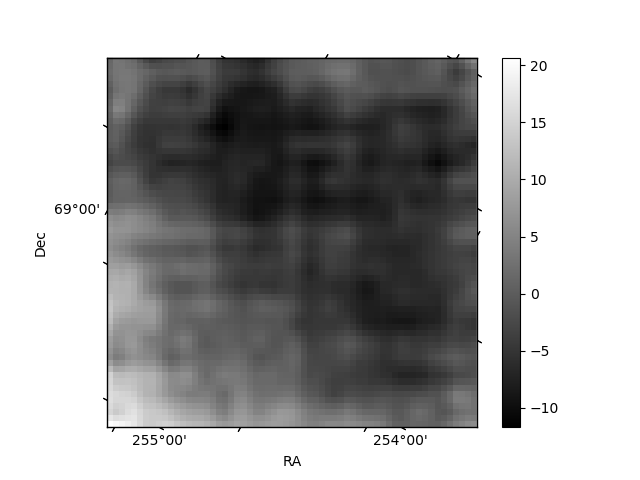
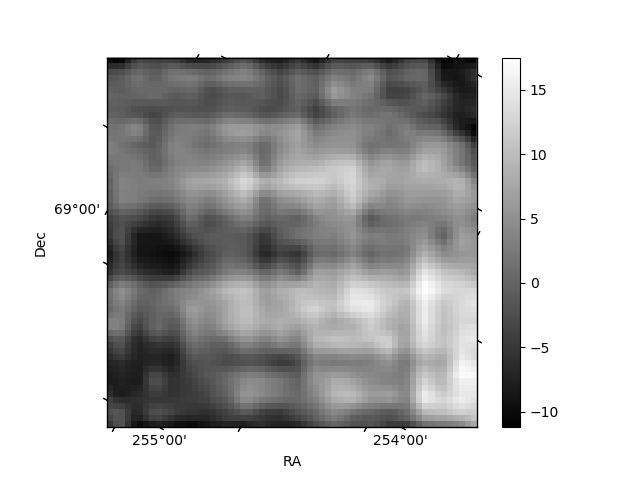
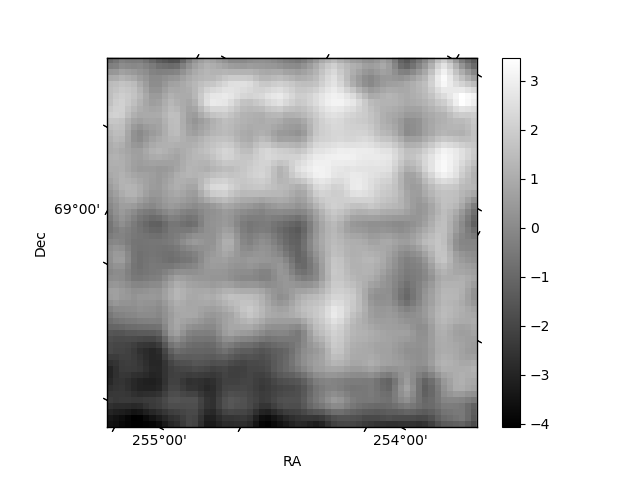
Histogram calculated using DETX and DETY for each event in the final _common_clean file
| Quadrant A | 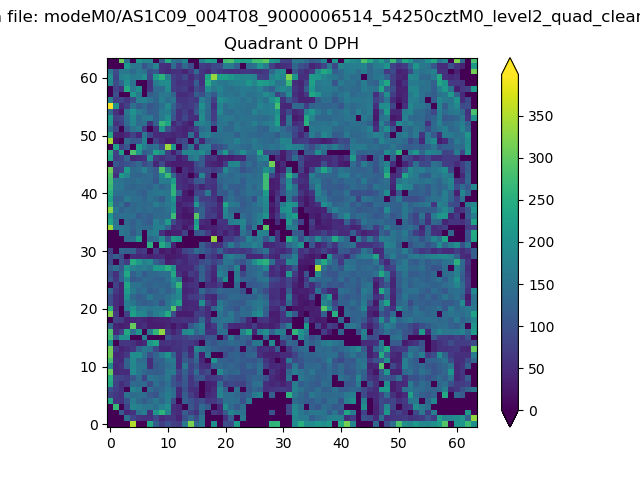 |
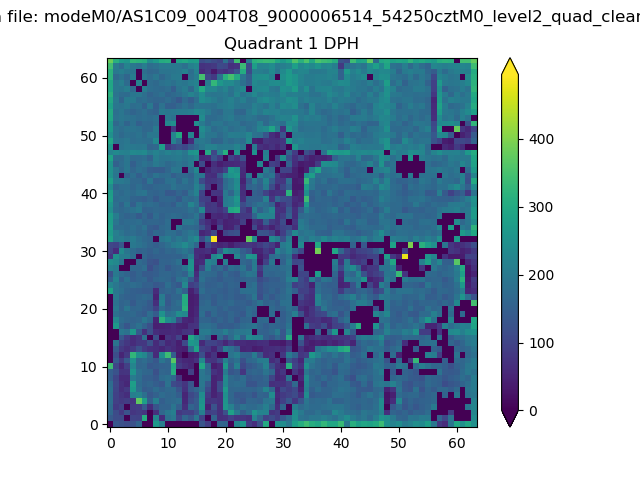 |
Quadrant B |
|---|---|---|---|
| Quadrant D | 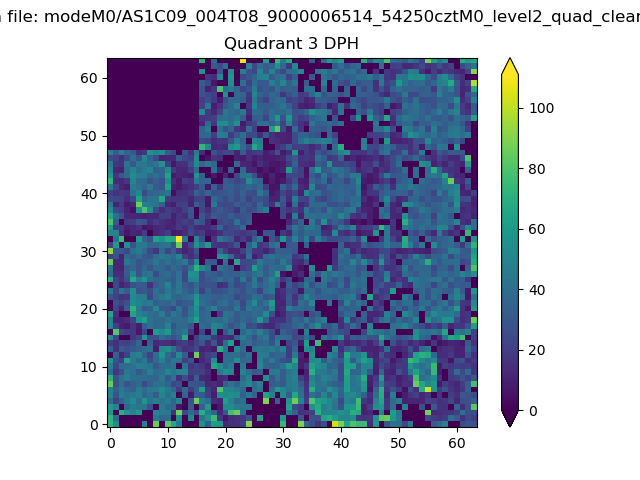 |
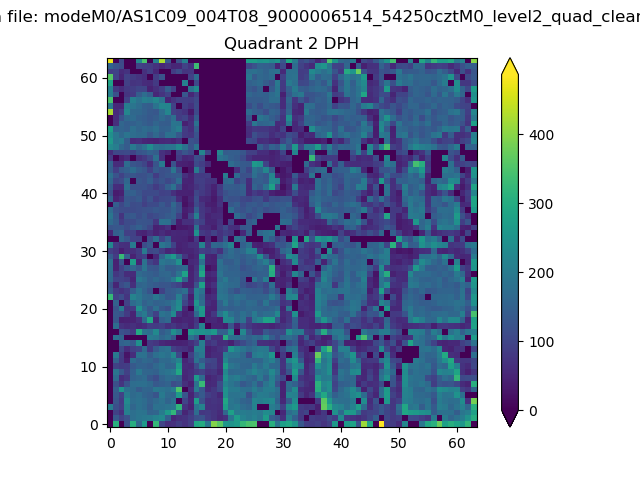 |
Quadrant C |
| Plot type | Count rate plots | Images |
|---|---|---|
| Comparison with Poisson distribution Blue bars denote a histogram of data divided into 1 sec bins. Red curve is a Poisson curve with rate = median count rate of data. |
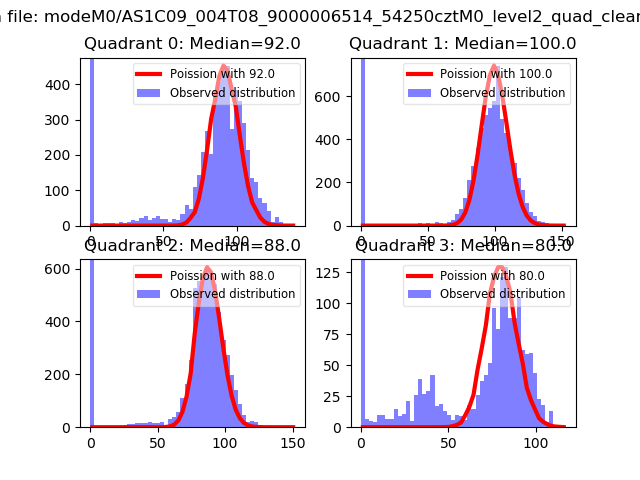 |
 |
| Quadrant-wise count rates Data is divided into 100 sec bins |
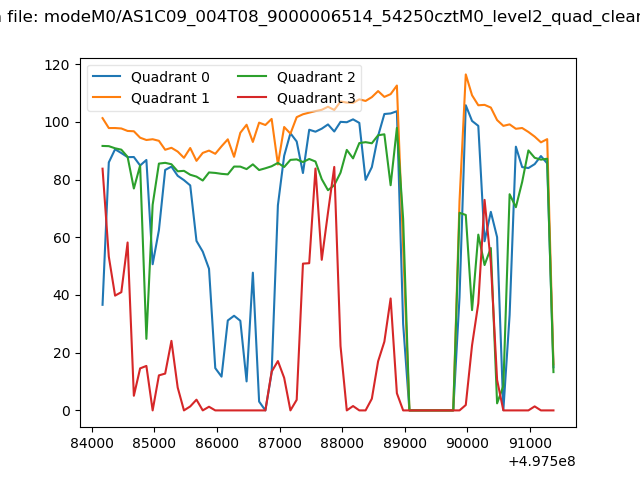 |
|
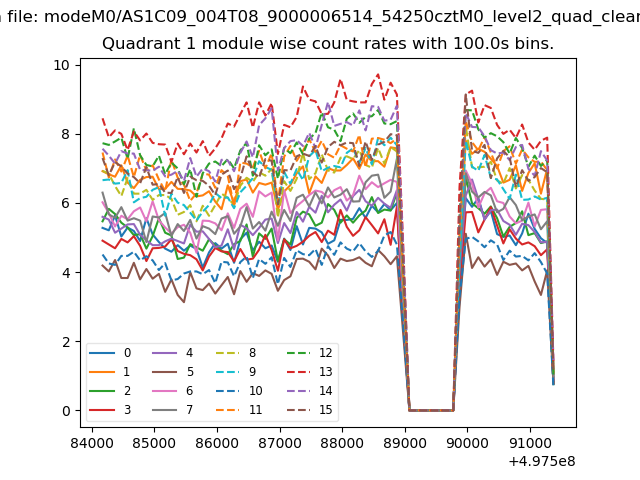
| Module-wise count rates for Quadrant A Data is divided into 100 sec bins |
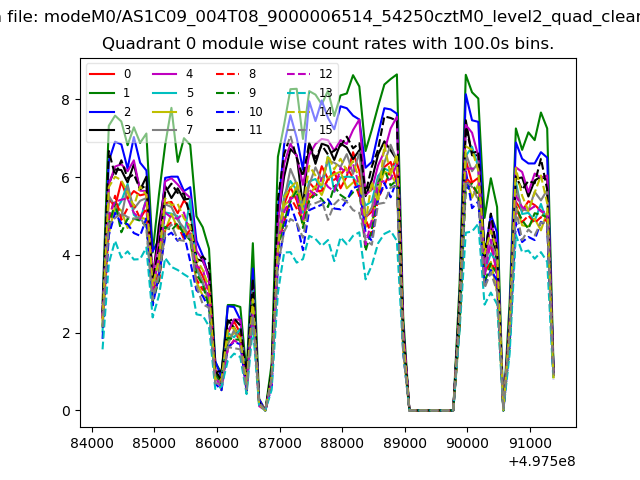 |
 |
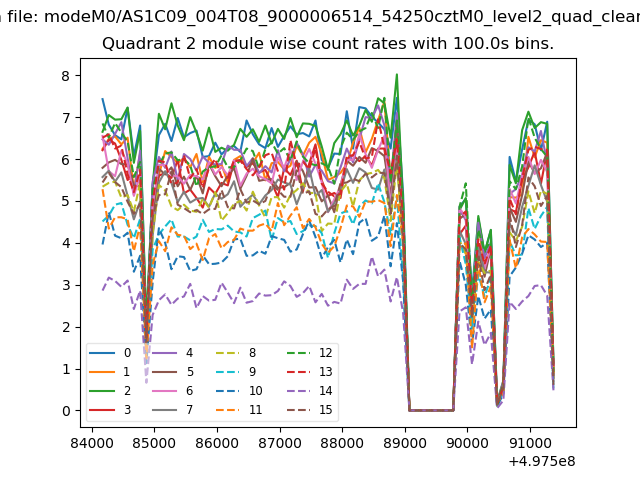
| Module-wise count rates for Quadrant B Data is divided into 100 sec bins |
 |
 |
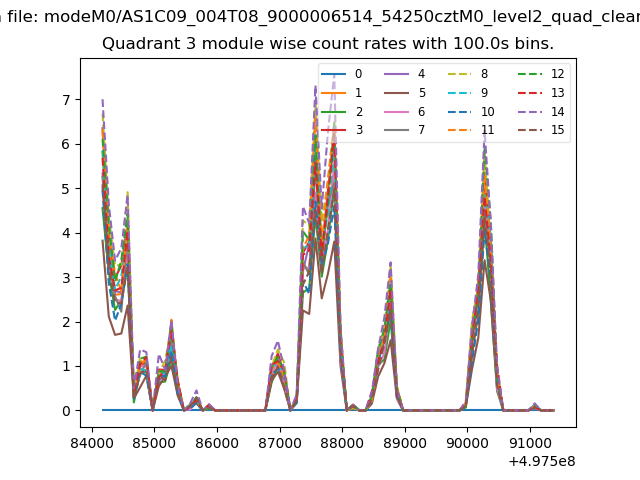
| Module-wise count rates for Quadrant C Data is divided into 100 sec bins |
 |
 |
| Module-wise count rates for Quadrant D Data is divided into 100 sec bins |
 |
 |
| Parameter | Plot |
|---|---|
| CZT HV Monitor | 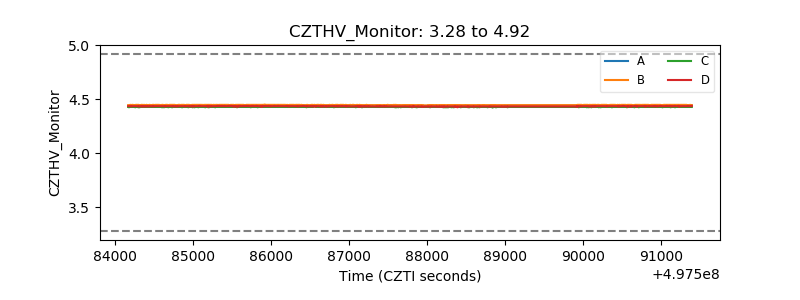 |
| D_VDD | 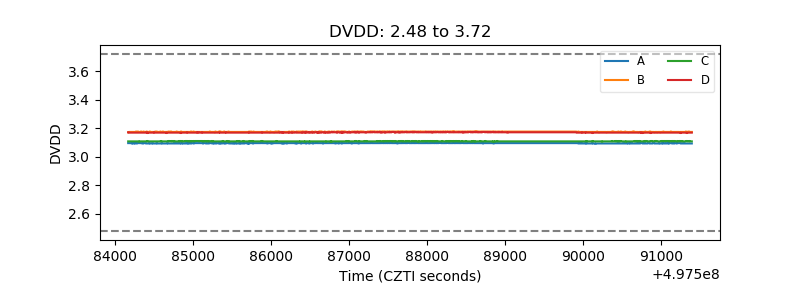 |
| Temperature 1 | 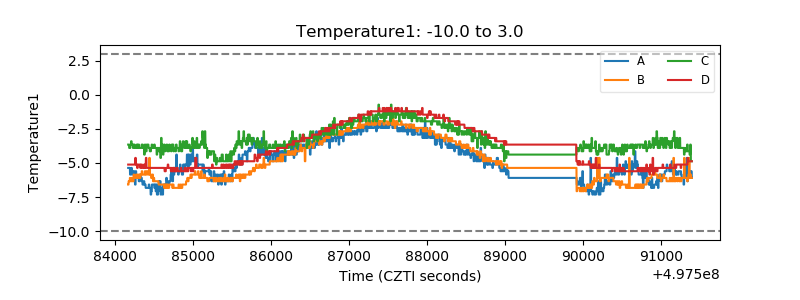 |
| Veto HV Monitor | 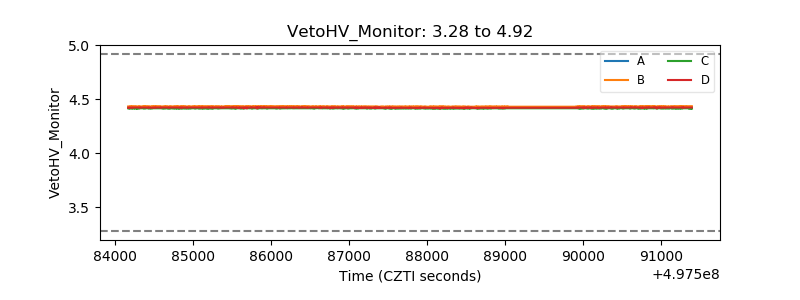 |
| Veto LLD | 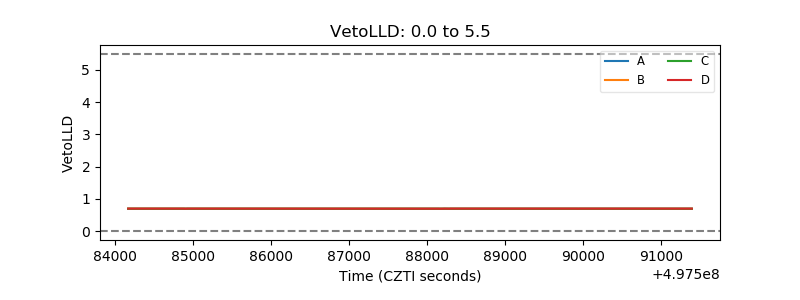 |
| Alpha Counter | 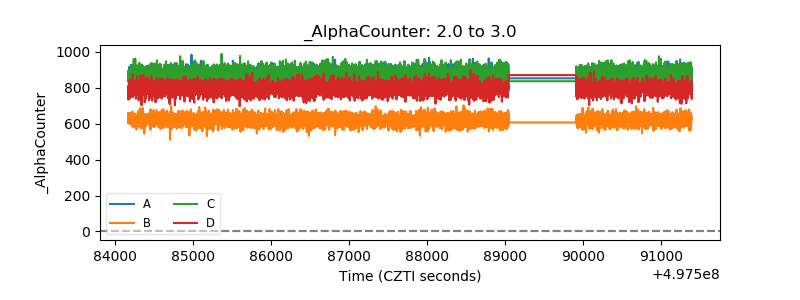 |
| _CPM_Rate | 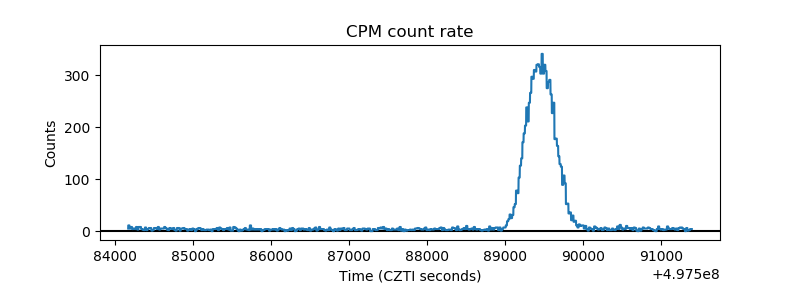 |
| CZT Counter | 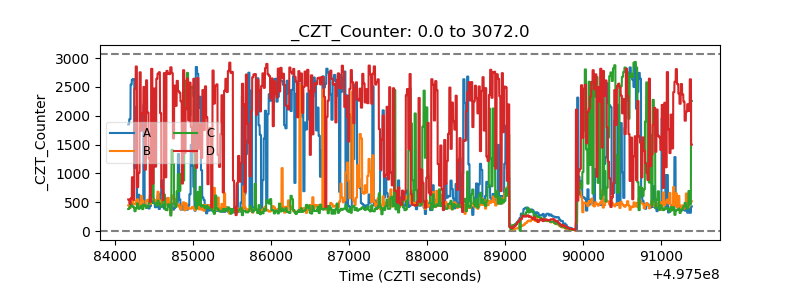 |
| +2.5 Volts monitor | 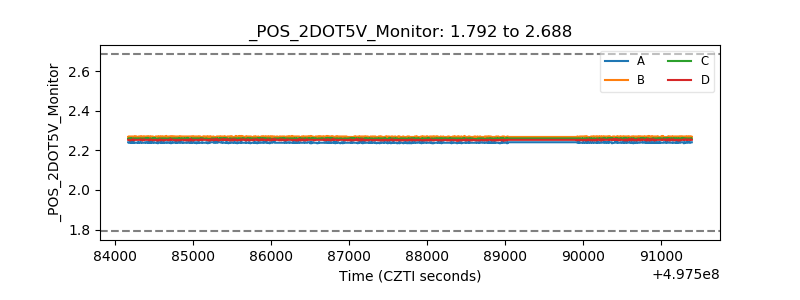 |
| +5 Volts monitor | 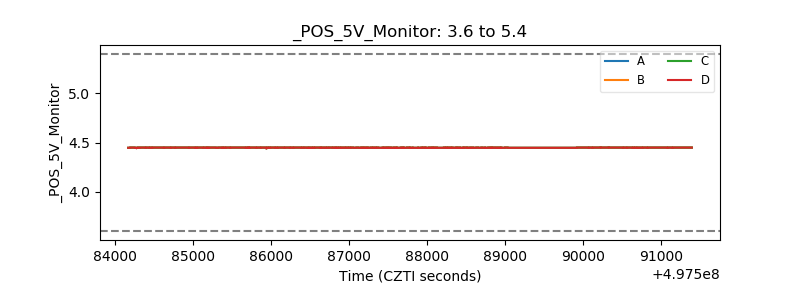 |
| _ROLL_ROT | 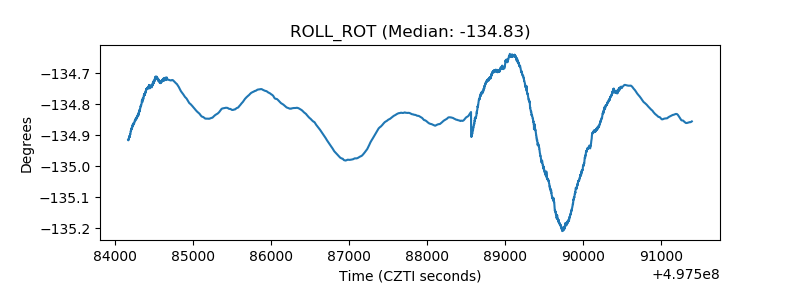 |
| _Roll_DEC | 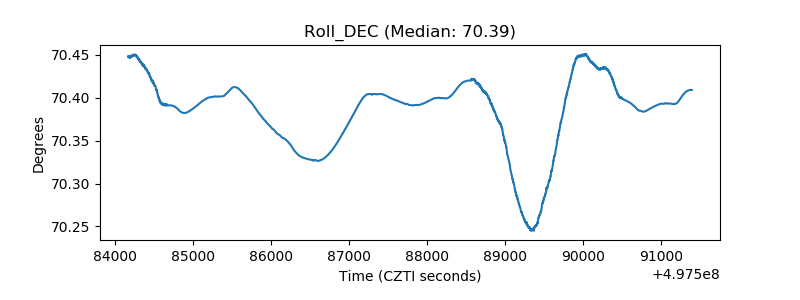 |
| _Roll_RA | 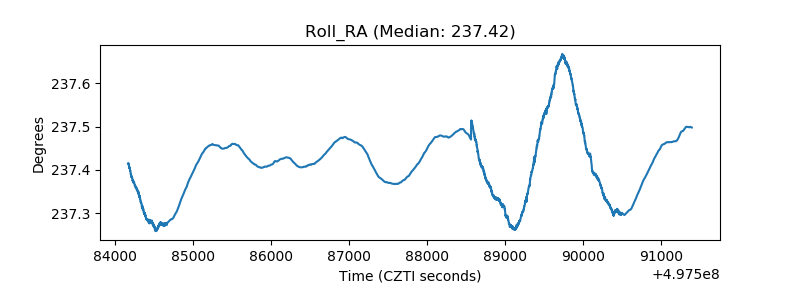 |
| Veto Counter | 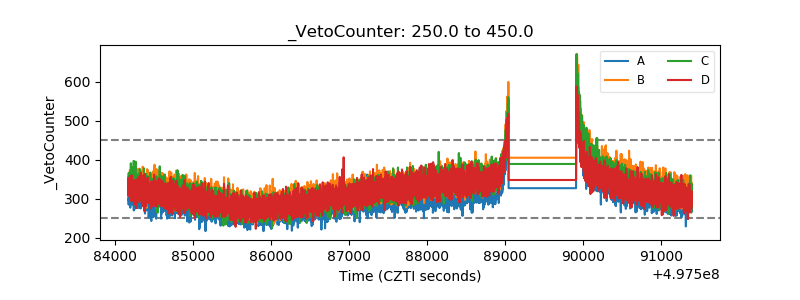 |