| Param | Original file | Final file |
|---|---|---|
| Filename | modeM0/AS1C09_004T08_9000006514_54254cztM0_level2.fits | modeM0/AS1C09_004T08_9000006514_54254cztM0_level2_quad_clean.evt |
| Size (bytes) | 540,901,440 | 91,874,880 |
| Size | 515.8 MB | 87.6 MB |
| Events in quadrant A | 5,370,170 | 578,436 |
| Events in quadrant B | 3,327,013 | 688,581 |
| Events in quadrant C | 4,833,345 | 557,622 |
| Events in quadrant D | 5,996,632 | 512,113 |
| Mode M0 | |||
|---|---|---|---|
| Quadrant | BADHDUFLAG | Total packets | Discarded packets |
| A | 0 | 20256 | 1 |
| B | 0 | 14237 | 2 |
| C | 0 | 18824 | 1 |
| D | 0 | 22074 | 1 |
| Mode M9 | |||
|---|---|---|---|
| Quadrant | BADHDUFLAG | Total packets | Discarded packets |
| A | 0 | 11 | 0 |
| B | 0 | 11 | 0 |
| C | 0 | 11 | 0 |
| D | 0 | 11 | 0 |
| Mode SS | |||
|---|---|---|---|
| Quadrant | BADHDUFLAG | Total packets | Discarded packets |
| A | 0 | 130 | 0 |
| B | 0 | 130 | 0 |
| C | 0 | 130 | 0 |
| D | 0 | 130 | 0 |
| Quadrant | Total seconds | Saturated seconds | Saturation percentage |
|---|---|---|---|
| A | 6381 | 791 | 12.396176% |
| B | 6380 | 157 | 2.460815% |
| C | 6380 | 543 | 8.510972% |
| D | 6381 | 714 | 11.189469% |
Noise dominated data is calculated using 1-second bins in cleaned event files. If a bin has >2000 counts, and if more than 50% of those come from <1% of pixels, then it is considered to be noise-dominated and hence unusable.
| Quadrant | # 1 sec bins | Bins with >0 counts | Bins with >2000 counts | High rate bins dominated by noise | Noise dominated (total time) | Noise dominated (detector-on time) | Marked lightcurve |
|---|---|---|---|---|---|---|---|
| A | 7521 | 6382 | 619 | 619 | 8.23% | 9.70% | 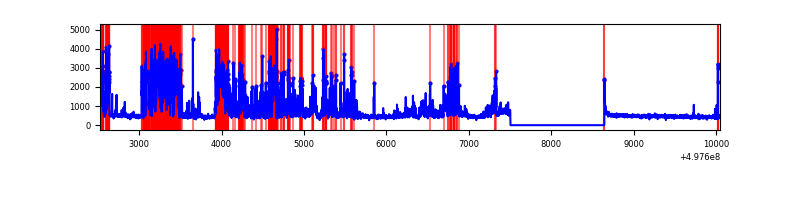 |
| B | 7520 | 6381 | 22 | 22 | 0.29% | 0.34% | 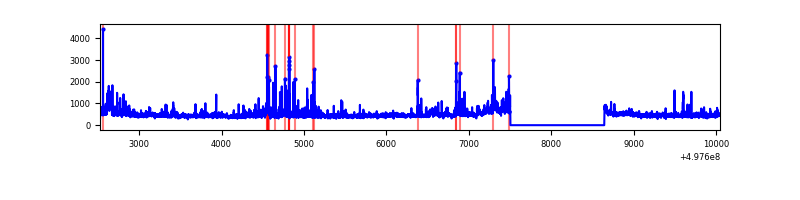 |
| C | 7520 | 6381 | 451 | 451 | 6.00% | 7.07% | 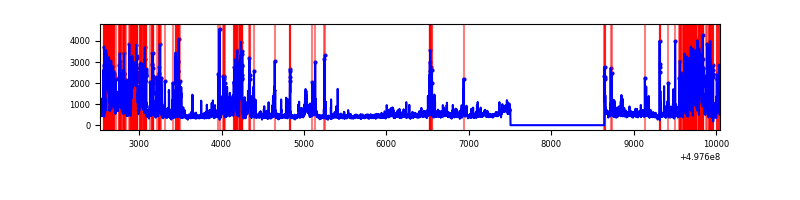 |
| D | 7520 | 6381 | 768 | 768 | 10.21% | 12.04% | 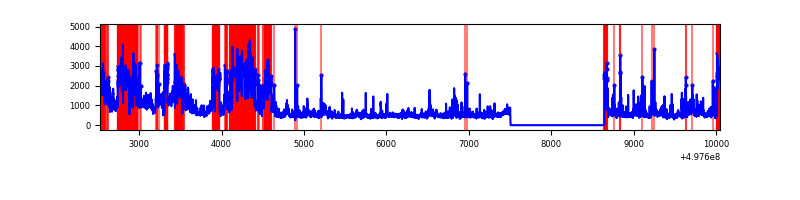 |
Top three noisy pixels from each quadrant. If the there are fewer than three noisy pixels in the level2.evt file, extra rows are filled as -1
| Pixel properties | Quadrant properties | ||||||
|---|---|---|---|---|---|---|---|
| Quadrant | DetID | PixID | Counts | Sigma | Mean | Median | Sigma |
| A | 7 | 29 | 1861629 | 11328.39 | 658 | 639 | 164.3 |
| A | 13 | 248 | 428550 | 2604.82 | 658 | 639 | 164.3 |
| A | 15 | 174 | 274898 | 1669.5 | 658 | 639 | 164.3 |
| B | 0 | 213 | 216105 | 1466.47 | 682 | 657 | 146.9 |
| B | 7 | 0 | 93330 | 630.79 | 682 | 657 | 146.9 |
| B | 5 | 236 | 87289 | 589.67 | 682 | 657 | 146.9 |
| C | 1 | 29 | 1864138 | 10598.83 | 638 | 631 | 175.8 |
| C | 14 | 254 | 133789 | 757.35 | 638 | 631 | 175.8 |
| C | 12 | 249 | 80433 | 453.88 | 638 | 631 | 175.8 |
| D | 8 | 176 | 2975865 | 16452.18 | 637 | 608 | 180.8 |
| D | 12 | 3 | 143847 | 792.06 | 637 | 608 | 180.8 |
| D | 10 | 181 | 107946 | 593.54 | 637 | 608 | 180.8 |
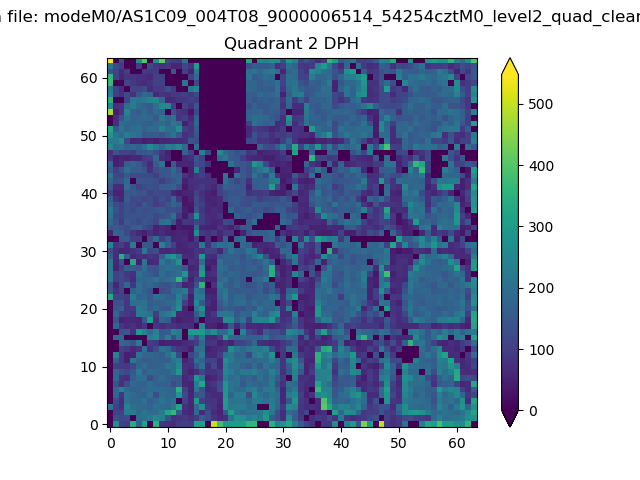
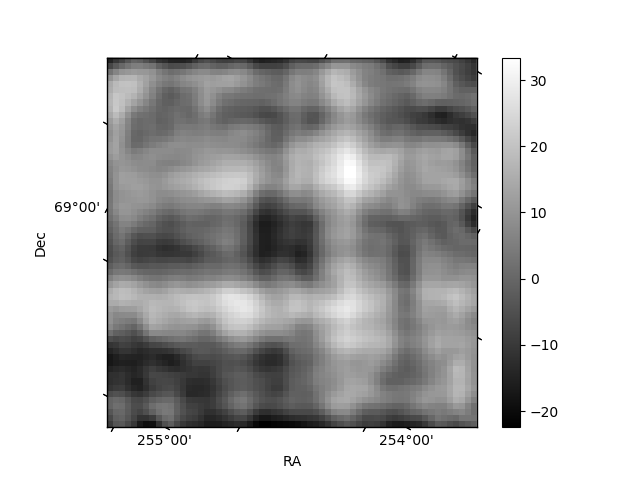
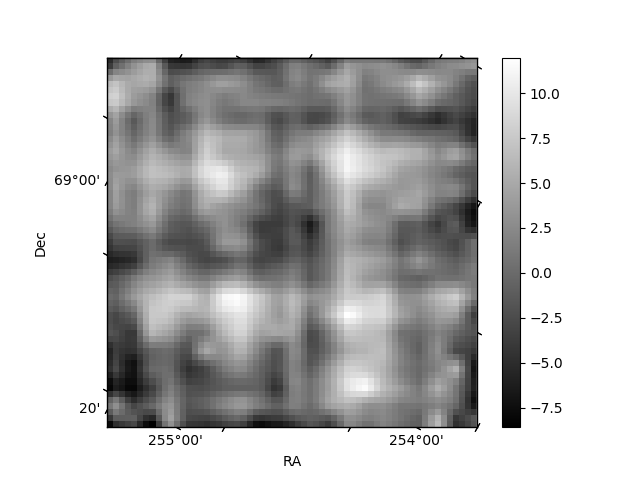
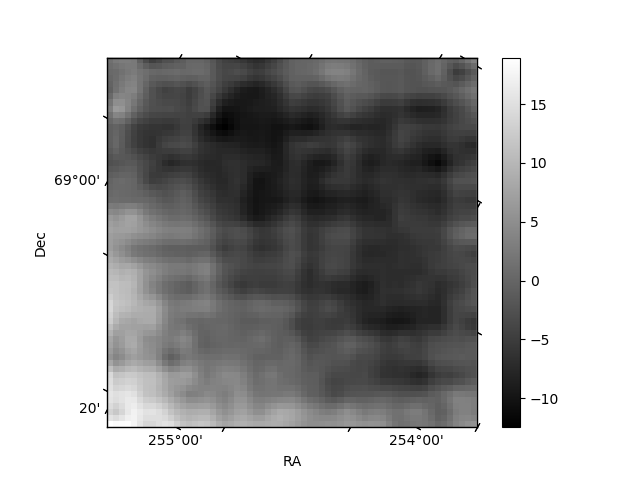
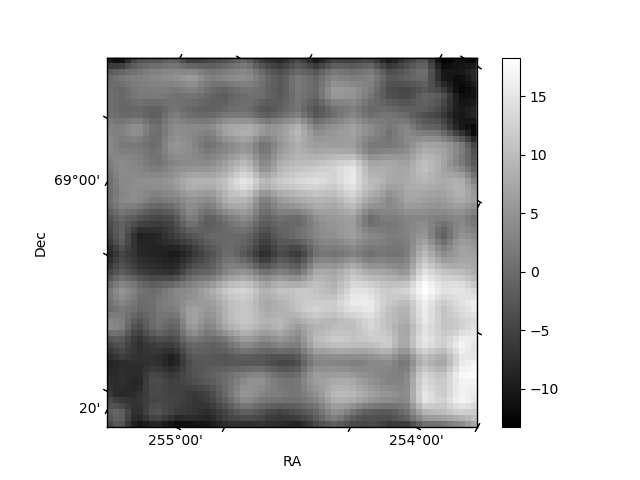
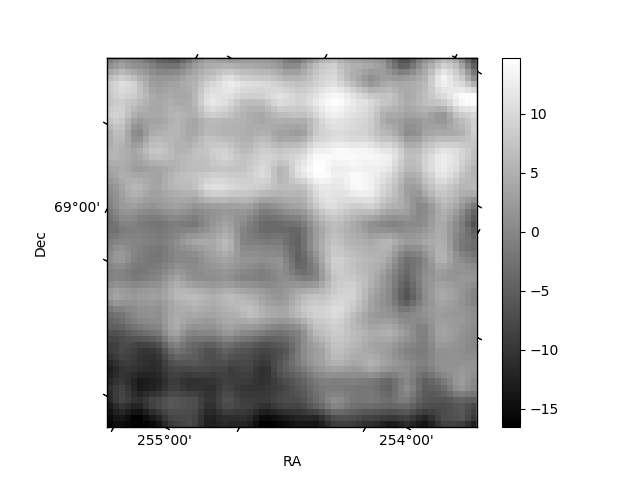
Histogram calculated using DETX and DETY for each event in the final _common_clean file
| Quadrant A | 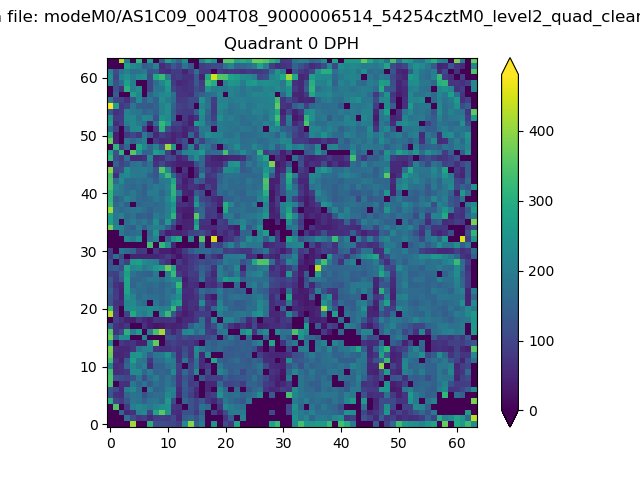 |
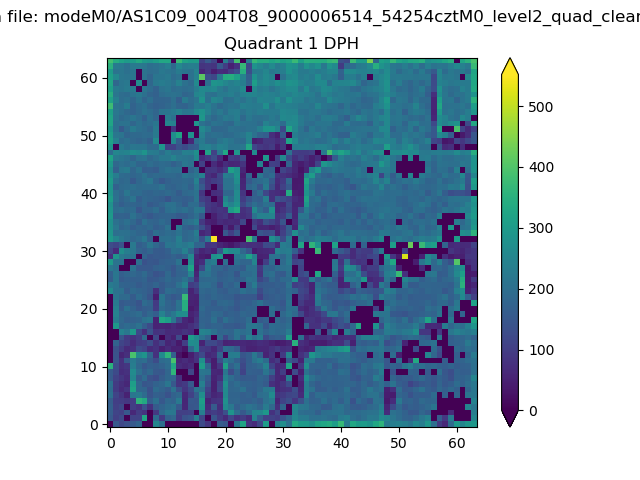 |
Quadrant B |
|---|---|---|---|
| Quadrant D | 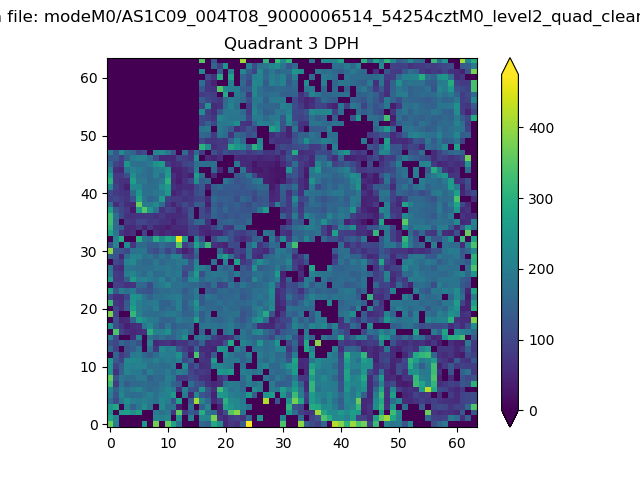 |
 |
Quadrant C |
| Plot type | Count rate plots | Images |
|---|---|---|
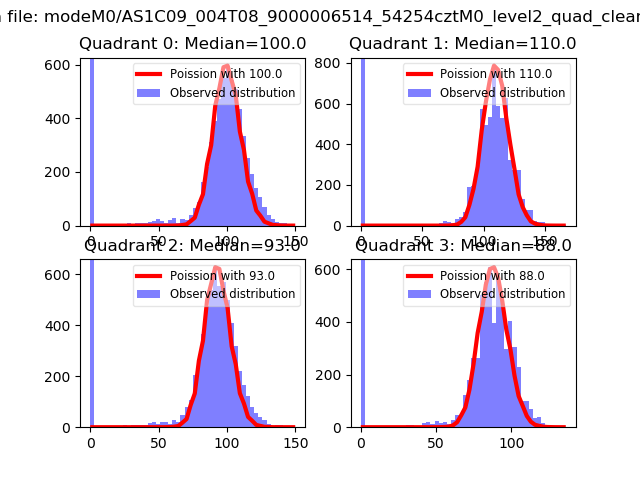
| Comparison with Poisson distribution Blue bars denote a histogram of data divided into 1 sec bins. Red curve is a Poisson curve with rate = median count rate of data. |
 |
 |
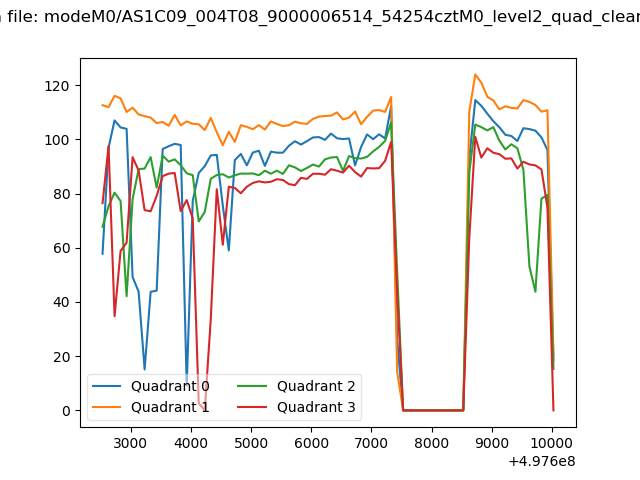
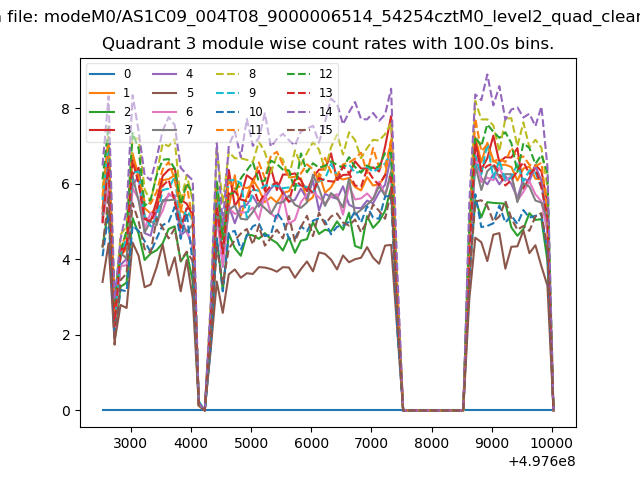
| Quadrant-wise count rates Data is divided into 100 sec bins |
 |
|
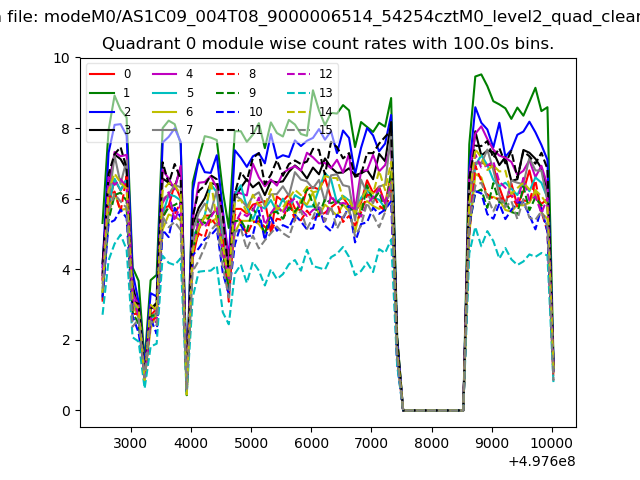
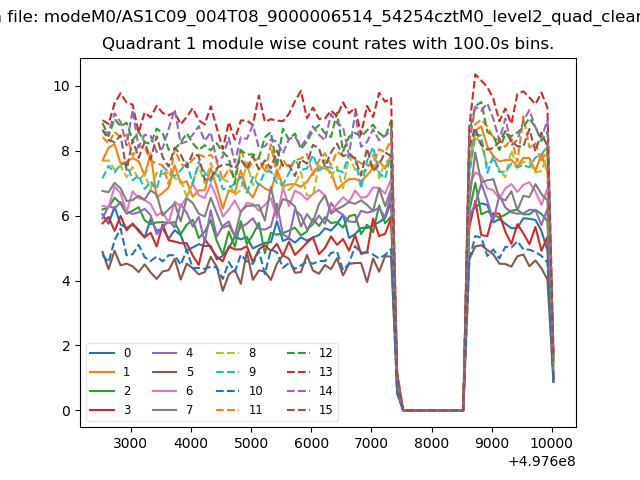
| Module-wise count rates for Quadrant A Data is divided into 100 sec bins |
 |
 |
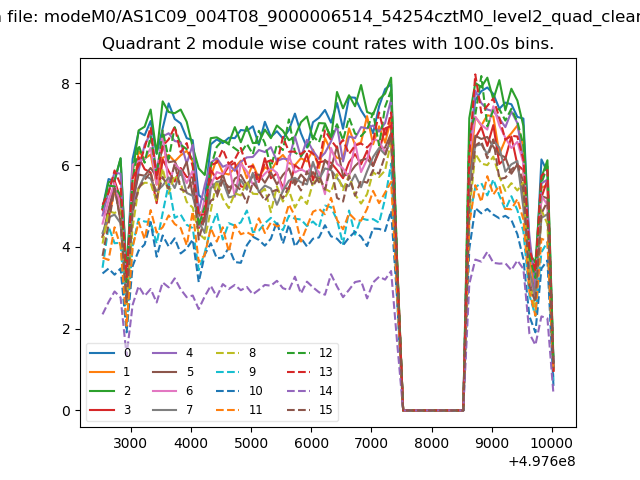
| Module-wise count rates for Quadrant B Data is divided into 100 sec bins |
 |
 |
| Module-wise count rates for Quadrant C Data is divided into 100 sec bins |
 |
 |
| Module-wise count rates for Quadrant D Data is divided into 100 sec bins |
 |
 |
| Parameter | Plot |
|---|---|
| CZT HV Monitor | 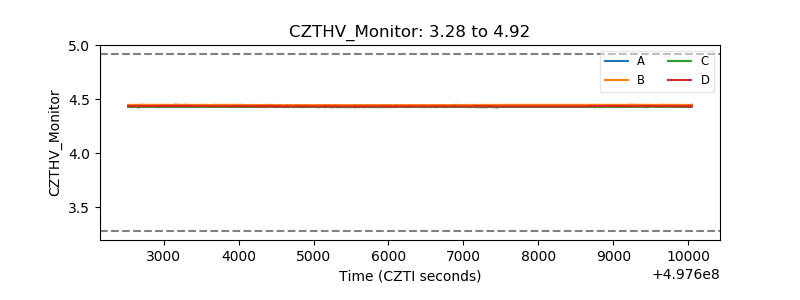 |
| D_VDD | 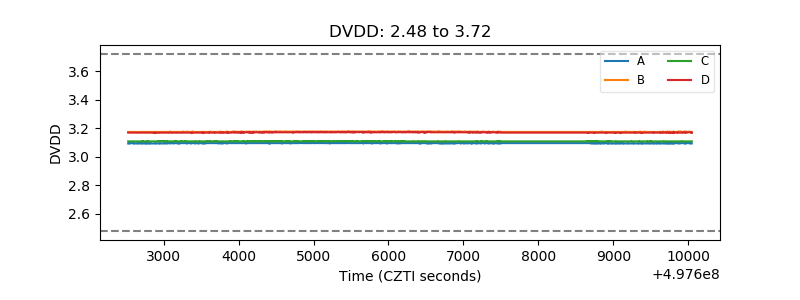 |
| Temperature 1 | 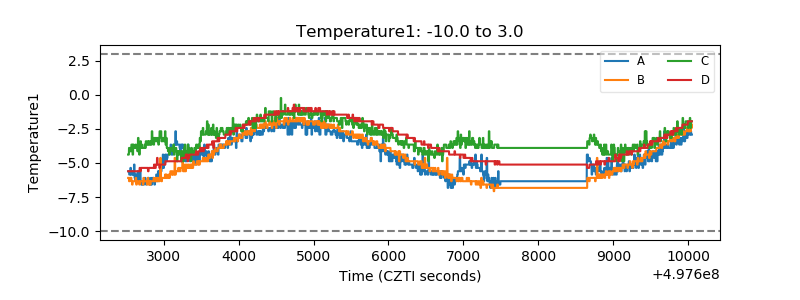 |
| Veto HV Monitor | 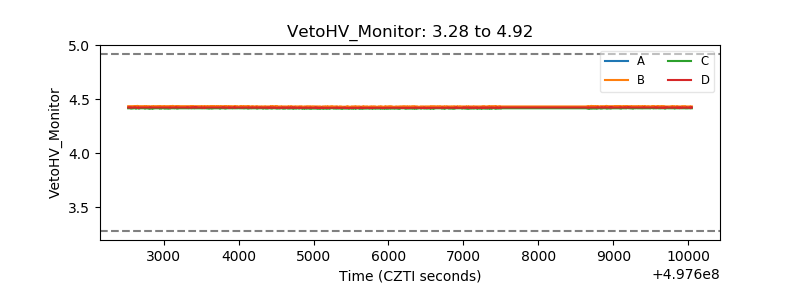 |
| Veto LLD | 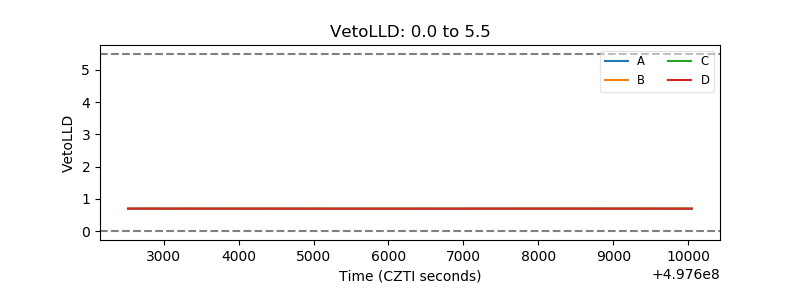 |
| Alpha Counter | 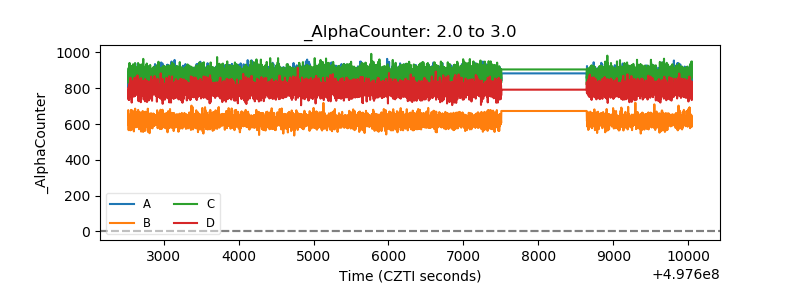 |
| _CPM_Rate | 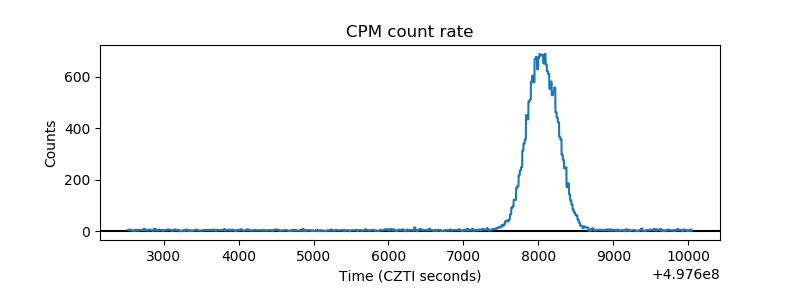 |
| CZT Counter |  |
| +2.5 Volts monitor |  |
| +5 Volts monitor |  |
| _ROLL_ROT | 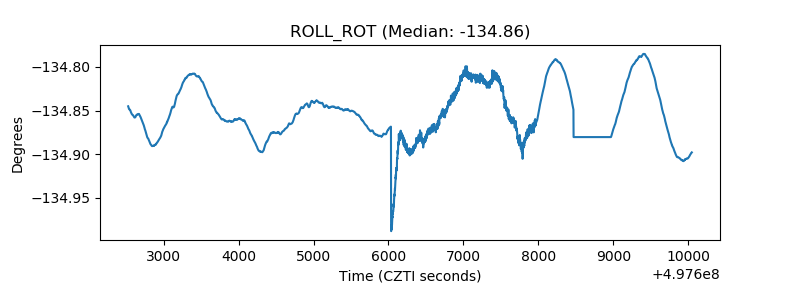 |
| _Roll_DEC | 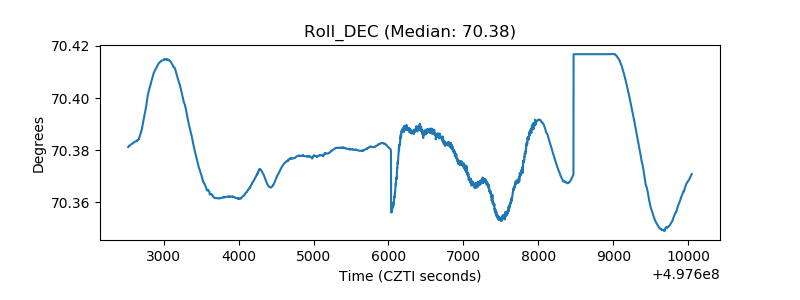 |
| _Roll_RA | 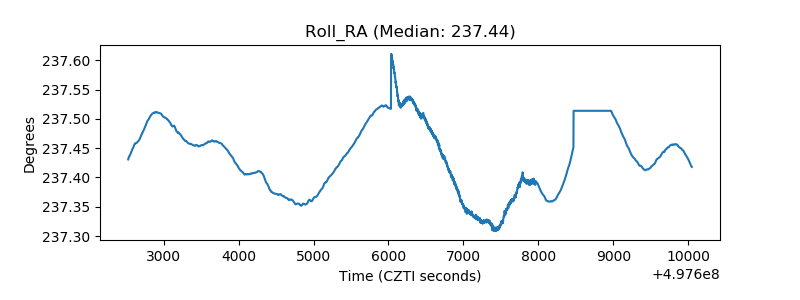 |
| Veto Counter | 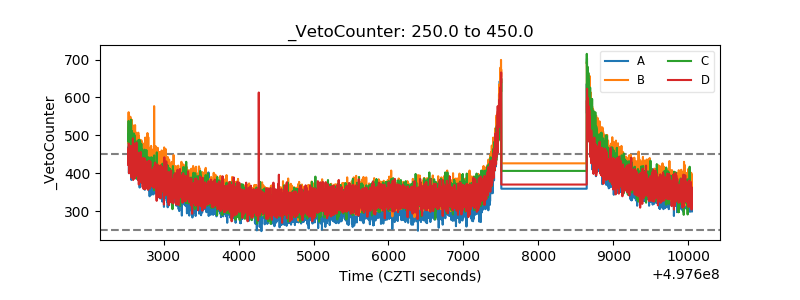 |