| Param | Original file | Final file |
|---|---|---|
| Filename | modeM0/AS1C09_004T08_9000006514_54255cztM0_level2.fits | modeM0/AS1C09_004T08_9000006514_54255cztM0_level2_quad_clean.evt |
| Size (bytes) | 616,098,240 | 84,208,320 |
| Size | 587.6 MB | 80.3 MB |
| Events in quadrant A | 4,971,702 | 565,104 |
| Events in quadrant B | 3,102,478 | 670,221 |
| Events in quadrant C | 5,499,493 | 517,303 |
| Events in quadrant D | 8,753,317 | 366,075 |
| Mode M0 | |||
|---|---|---|---|
| Quadrant | BADHDUFLAG | Total packets | Discarded packets |
| A | 0 | 18996 | 2 |
| B | 0 | 13455 | 2 |
| C | 0 | 20700 | 2 |
| D | 0 | 30233 | 2 |
| Mode M9 | |||
|---|---|---|---|
| Quadrant | BADHDUFLAG | Total packets | Discarded packets |
| A | 0 | 11 | 0 |
| B | 0 | 11 | 0 |
| C | 0 | 11 | 0 |
| D | 0 | 11 | 0 |
| Mode SS | |||
|---|---|---|---|
| Quadrant | BADHDUFLAG | Total packets | Discarded packets |
| A | 0 | 126 | 0 |
| B | 0 | 126 | 0 |
| C | 0 | 126 | 0 |
| D | 0 | 126 | 0 |
| Quadrant | Total seconds | Saturated seconds | Saturation percentage |
|---|---|---|---|
| A | 6171 | 742 | 12.023983% |
| B | 6172 | 94 | 1.523007% |
| C | 6172 | 744 | 12.054439% |
| D | 6172 | 2156 | 34.931951% |
Noise dominated data is calculated using 1-second bins in cleaned event files. If a bin has >2000 counts, and if more than 50% of those come from <1% of pixels, then it is considered to be noise-dominated and hence unusable.
| Quadrant | # 1 sec bins | Bins with >0 counts | Bins with >2000 counts | High rate bins dominated by noise | Noise dominated (total time) | Noise dominated (detector-on time) | Marked lightcurve |
|---|---|---|---|---|---|---|---|
| A | 7291 | 6173 | 578 | 578 | 7.93% | 9.36% | 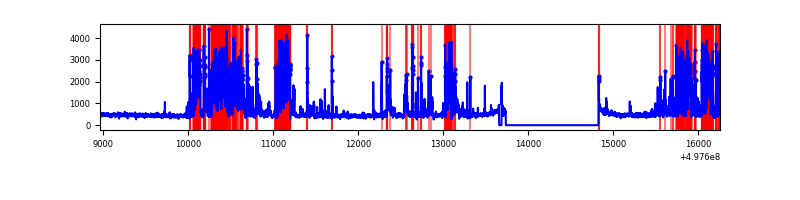 |
| B | 7292 | 6174 | 16 | 16 | 0.22% | 0.26% | 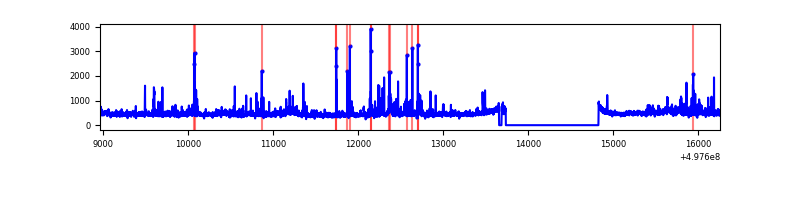 |
| C | 7292 | 6173 | 622 | 622 | 8.53% | 10.08% | 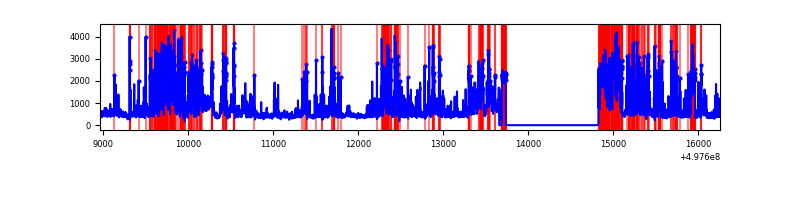 |
| D | 7291 | 6173 | 1965 | 1965 | 26.95% | 31.83% | 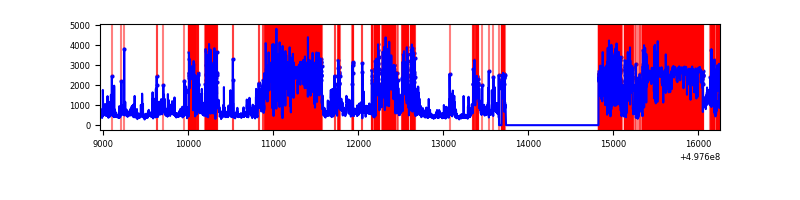 |
Top three noisy pixels from each quadrant. If the there are fewer than three noisy pixels in the level2.evt file, extra rows are filled as -1
| Pixel properties | Quadrant properties | ||||||
|---|---|---|---|---|---|---|---|
| Quadrant | DetID | PixID | Counts | Sigma | Mean | Median | Sigma |
| A | 7 | 29 | 1391848 | 8856.45 | 634 | 620 | 157.1 |
| A | 12 | 17 | 705850 | 4489.44 | 634 | 620 | 157.1 |
| A | 12 | 194 | 92896 | 587.42 | 634 | 620 | 157.1 |
| B | 7 | 0 | 144835 | 1032.59 | 656 | 635 | 139.6 |
| B | 0 | 213 | 126649 | 902.36 | 656 | 635 | 139.6 |
| B | 8 | 234 | 47703 | 337.05 | 656 | 635 | 139.6 |
| C | 1 | 29 | 2565116 | 15475.33 | 601 | 596 | 165.7 |
| C | 15 | 198 | 153920 | 925.22 | 601 | 596 | 165.7 |
| C | 12 | 2 | 112732 | 676.67 | 601 | 596 | 165.7 |
| D | 8 | 176 | 5930031 | 40854.11 | 504 | 481 | 145.1 |
| D | 12 | 2 | 200304 | 1376.76 | 504 | 481 | 145.1 |
| D | 10 | 181 | 127859 | 877.62 | 504 | 481 | 145.1 |
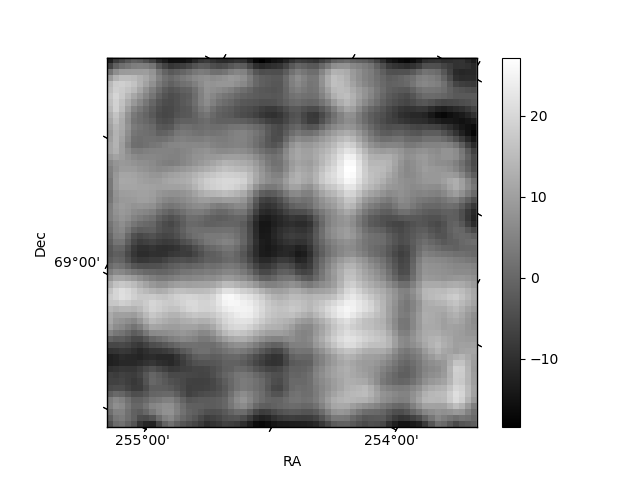
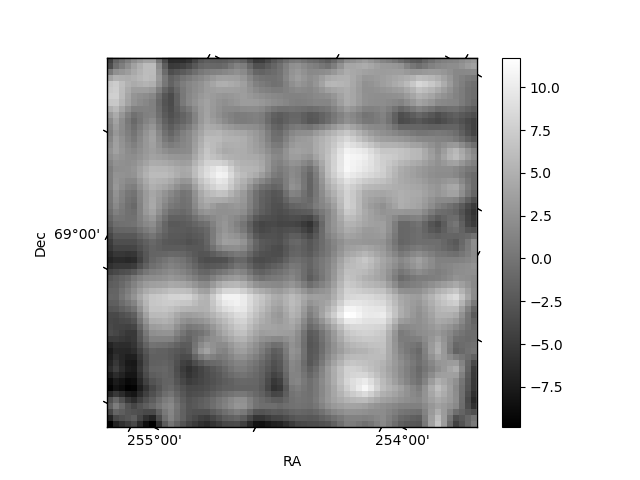
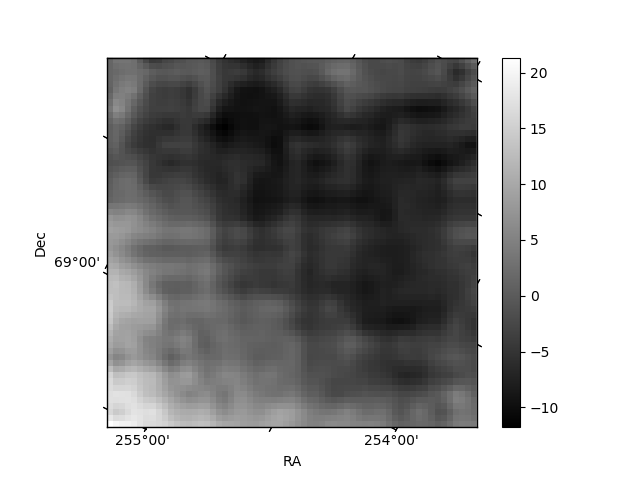
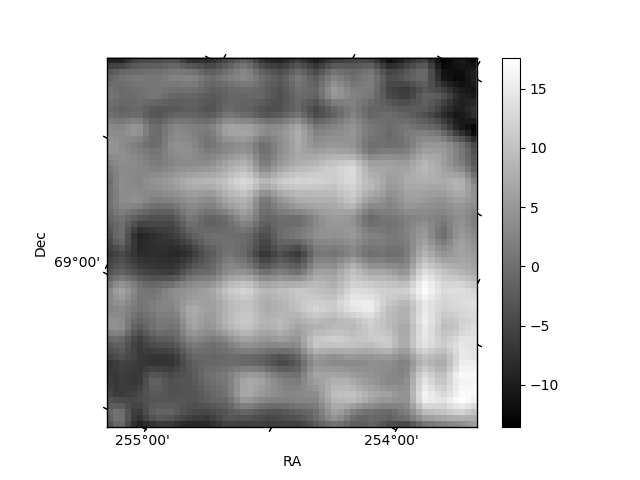
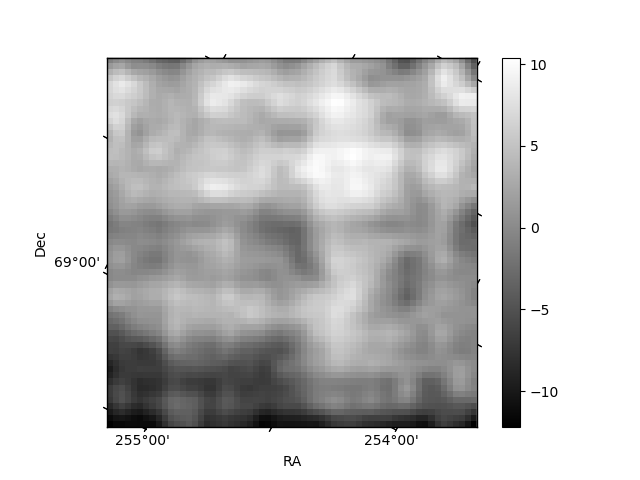
Histogram calculated using DETX and DETY for each event in the final _common_clean file
| Quadrant A | 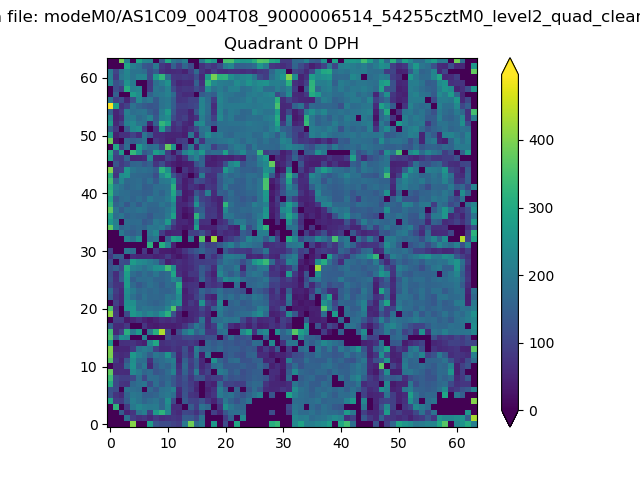 |
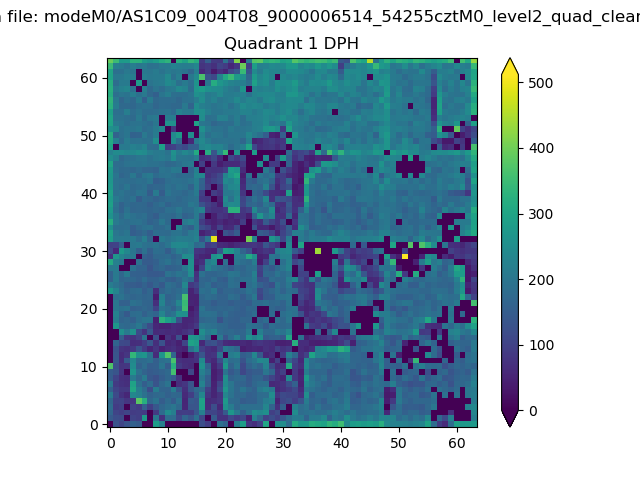 |
Quadrant B |
|---|---|---|---|
| Quadrant D | 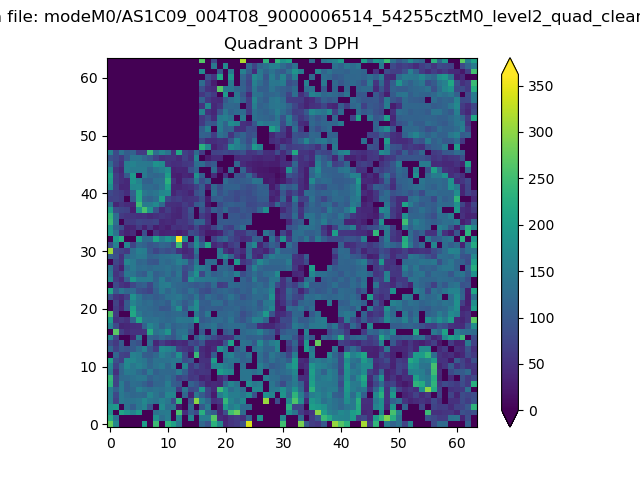 |
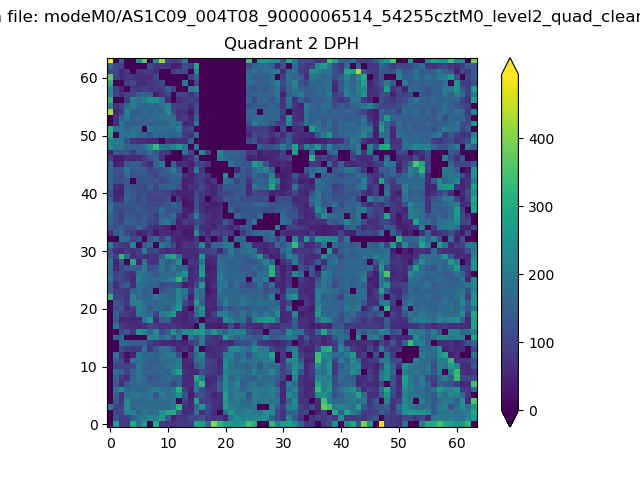 |
Quadrant C |
| Plot type | Count rate plots | Images |
|---|---|---|
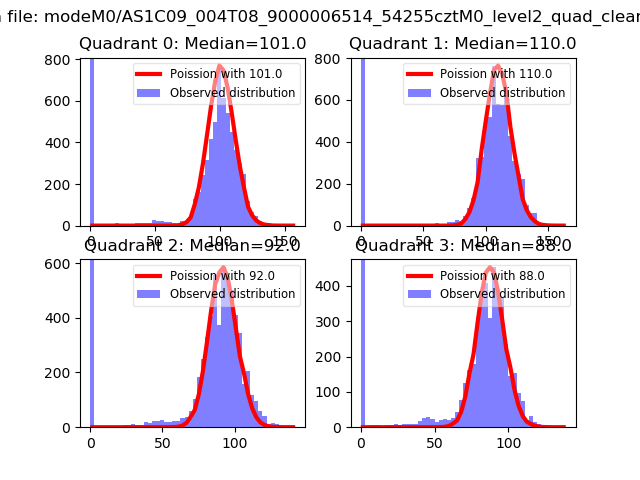
| Comparison with Poisson distribution Blue bars denote a histogram of data divided into 1 sec bins. Red curve is a Poisson curve with rate = median count rate of data. |
 |
 |
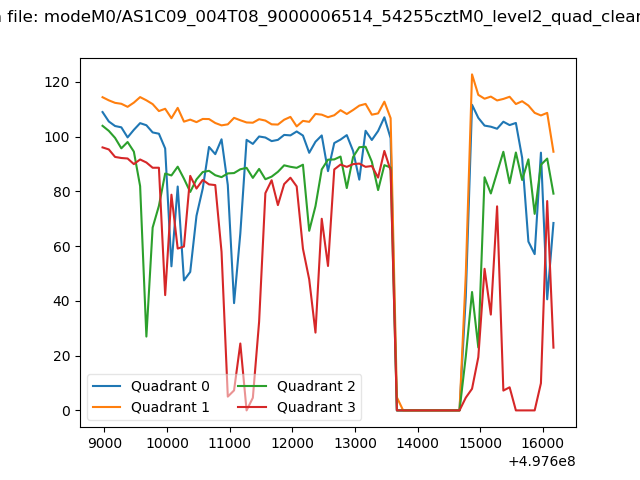
| Quadrant-wise count rates Data is divided into 100 sec bins |
 |
|
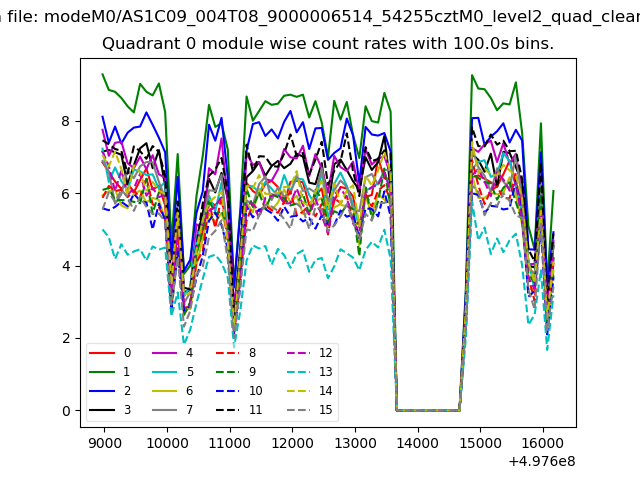
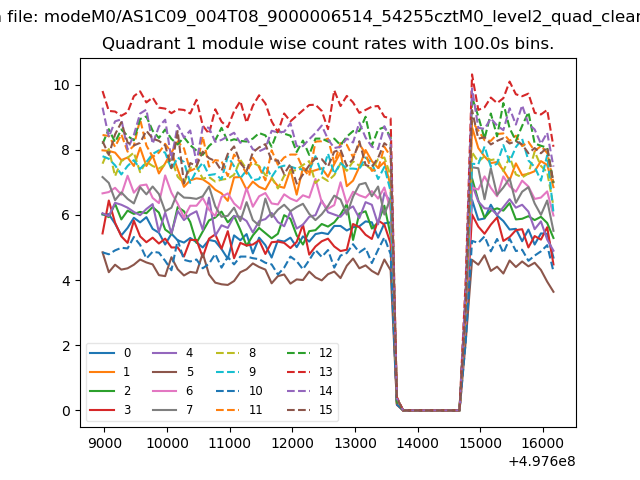
| Module-wise count rates for Quadrant A Data is divided into 100 sec bins |
 |
 |
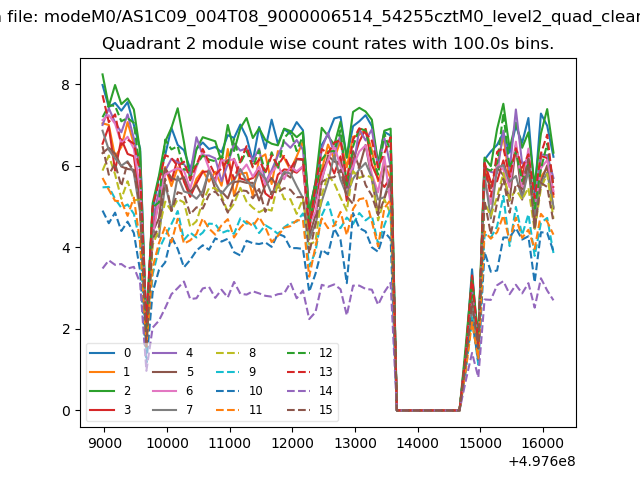
| Module-wise count rates for Quadrant B Data is divided into 100 sec bins |
 |
 |
| Module-wise count rates for Quadrant C Data is divided into 100 sec bins |
 |
 |
| Module-wise count rates for Quadrant D Data is divided into 100 sec bins |
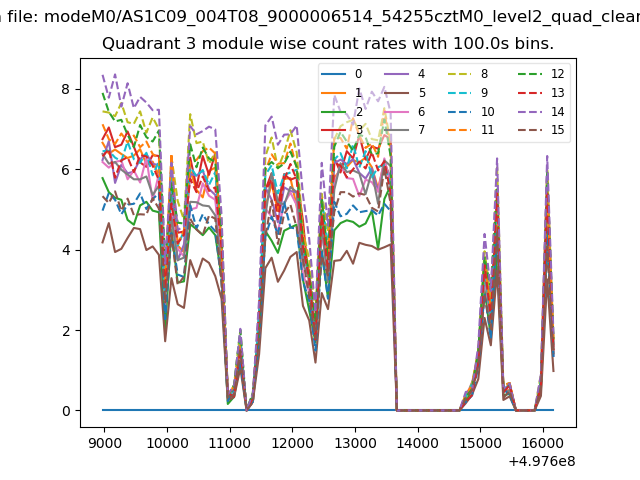 |
 |
| Parameter | Plot |
|---|---|
| CZT HV Monitor | 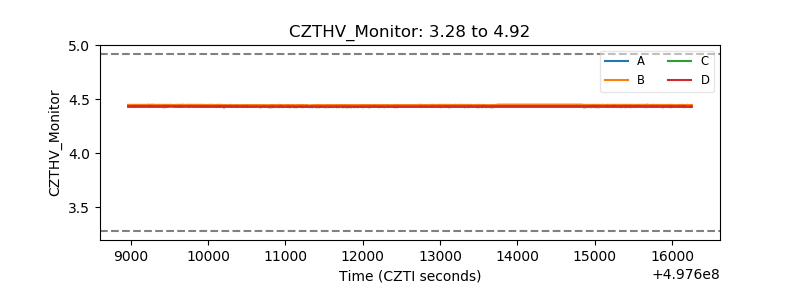 |
| D_VDD | 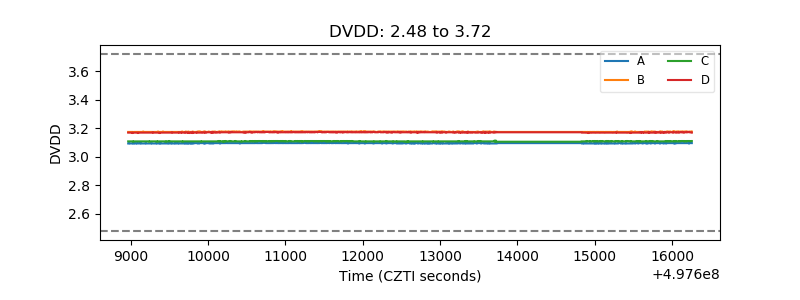 |
| Temperature 1 | 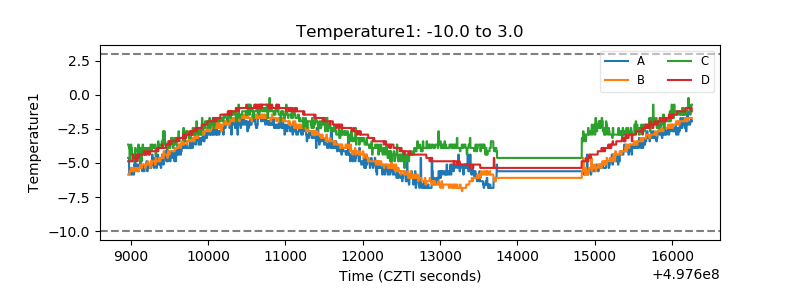 |
| Veto HV Monitor | 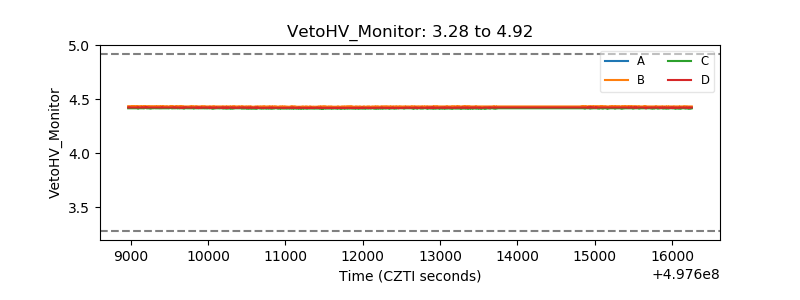 |
| Veto LLD | 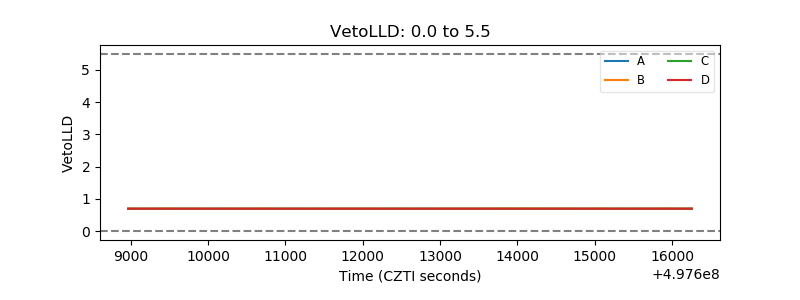 |
| Alpha Counter | 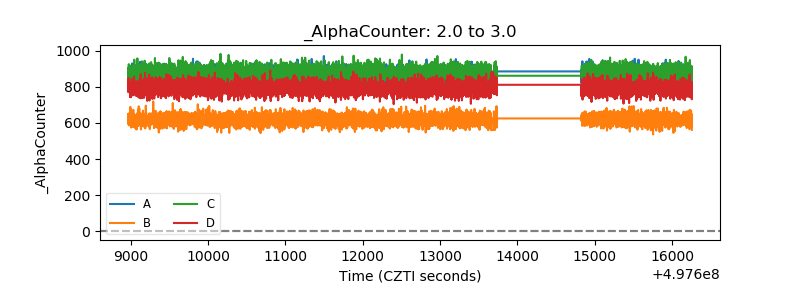 |
| _CPM_Rate | 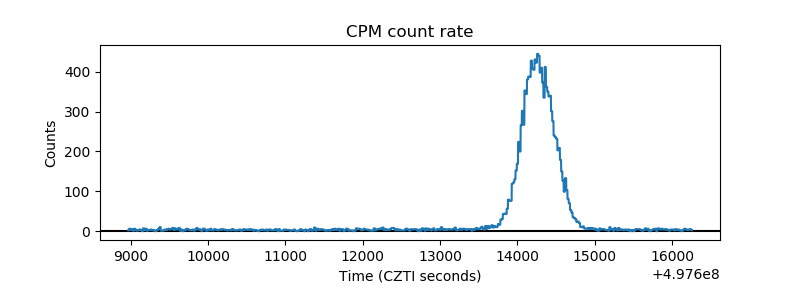 |
| CZT Counter | 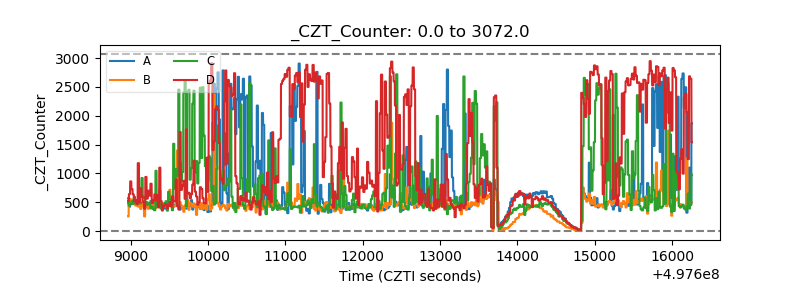 |
| +2.5 Volts monitor |  |
| +5 Volts monitor | 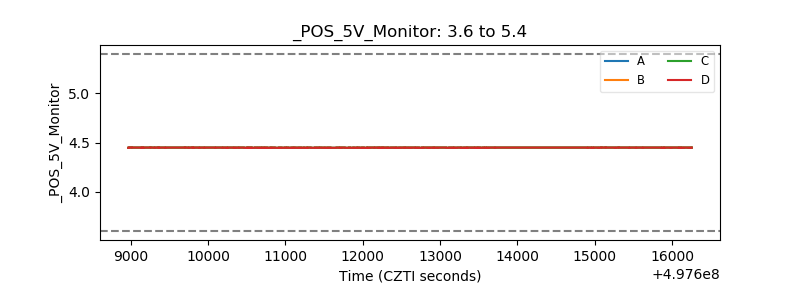 |
| _ROLL_ROT | 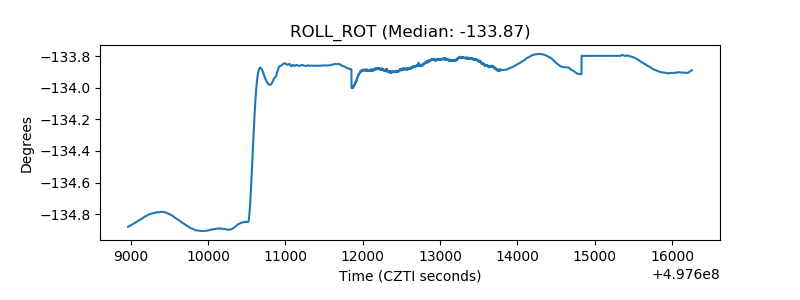 |
| _Roll_DEC | 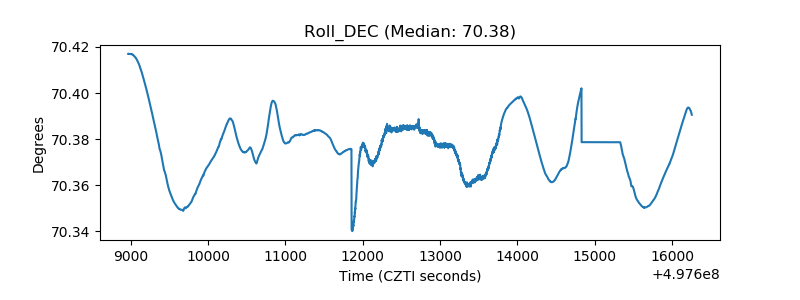 |
| _Roll_RA | 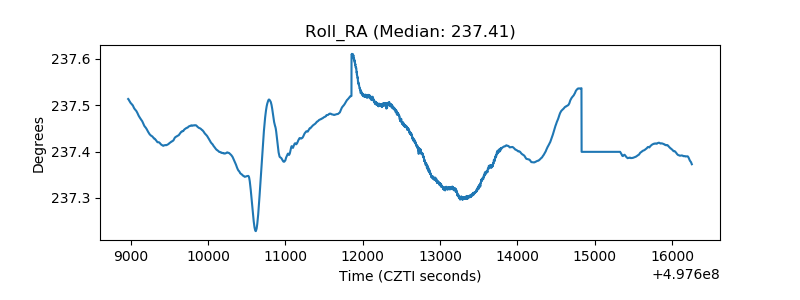 |
| Veto Counter | 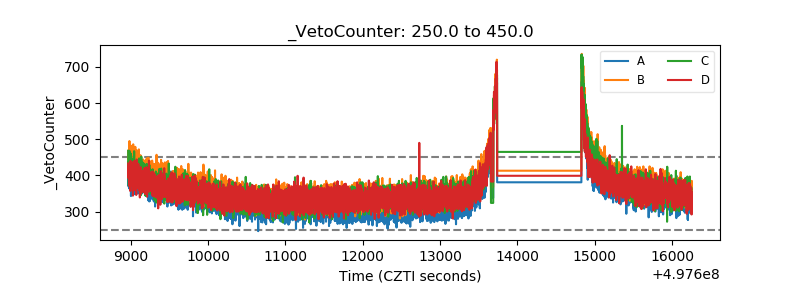 |