| Param | Original file | Final file |
|---|---|---|
| Filename | modeM0/AS1C09_004T08_9000006514_54256cztM0_level2.fits | modeM0/AS1C09_004T08_9000006514_54256cztM0_level2_quad_clean.evt |
| Size (bytes) | 722,715,840 | 77,258,880 |
| Size | 689.2 MB | 73.7 MB |
| Events in quadrant A | 5,422,630 | 533,343 |
| Events in quadrant B | 3,335,415 | 658,052 |
| Events in quadrant C | 4,835,448 | 530,022 |
| Events in quadrant D | 12,678,195 | 185,170 |
| Mode M0 | |||
|---|---|---|---|
| Quadrant | BADHDUFLAG | Total packets | Discarded packets |
| A | 0 | 20493 | 1 |
| B | 0 | 14135 | 1 |
| C | 0 | 18812 | 1 |
| D | 0 | 41955 | 1 |
| Mode M9 | |||
|---|---|---|---|
| Quadrant | BADHDUFLAG | Total packets | Discarded packets |
| A | 0 | 10 | 0 |
| B | 0 | 10 | 0 |
| C | 0 | 10 | 0 |
| D | 0 | 10 | 0 |
| Mode SS | |||
|---|---|---|---|
| Quadrant | BADHDUFLAG | Total packets | Discarded packets |
| A | 0 | 126 | 0 |
| B | 0 | 126 | 0 |
| C | 0 | 126 | 0 |
| D | 0 | 126 | 0 |
| Quadrant | Total seconds | Saturated seconds | Saturation percentage |
|---|---|---|---|
| A | 6195 | 955 | 15.415658% |
| B | 6196 | 91 | 1.468689% |
| C | 6196 | 504 | 8.134280% |
| D | 6196 | 4154 | 67.043254% |
Noise dominated data is calculated using 1-second bins in cleaned event files. If a bin has >2000 counts, and if more than 50% of those come from <1% of pixels, then it is considered to be noise-dominated and hence unusable.
| Quadrant | # 1 sec bins | Bins with >0 counts | Bins with >2000 counts | High rate bins dominated by noise | Noise dominated (total time) | Noise dominated (detector-on time) | Marked lightcurve |
|---|---|---|---|---|---|---|---|
| A | 7195 | 6195 | 740 | 740 | 10.28% | 11.95% | 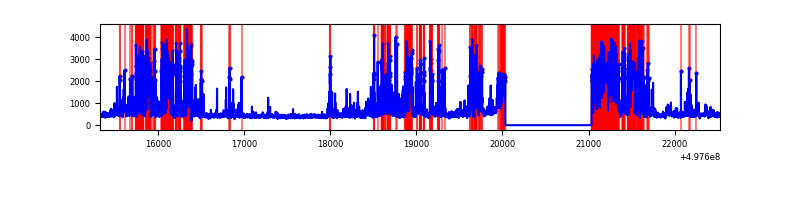 |
| B | 7196 | 6197 | 9 | 9 | 0.13% | 0.15% | 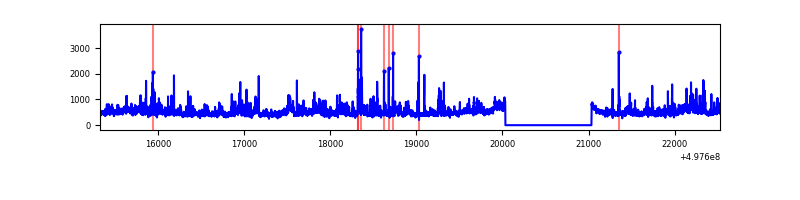 |
| C | 7196 | 6197 | 394 | 394 | 5.48% | 6.36% | 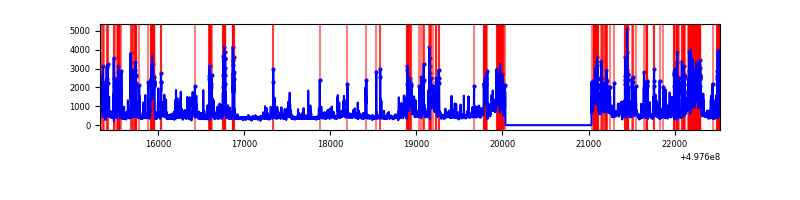 |
| D | 7195 | 6195 | 3848 | 3848 | 53.48% | 62.11% | 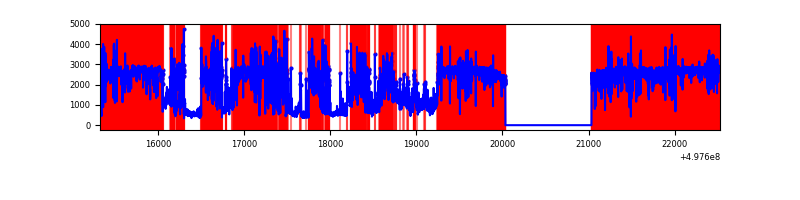 |
Top three noisy pixels from each quadrant. If the there are fewer than three noisy pixels in the level2.evt file, extra rows are filled as -1
| Pixel properties | Quadrant properties | ||||||
|---|---|---|---|---|---|---|---|
| Quadrant | DetID | PixID | Counts | Sigma | Mean | Median | Sigma |
| A | 7 | 29 | 1407576 | 9262.28 | 610 | 594 | 151.9 |
| A | 12 | 17 | 1141301 | 7509.37 | 610 | 594 | 151.9 |
| A | 15 | 174 | 175631 | 1152.28 | 610 | 594 | 151.9 |
| B | 7 | 0 | 360127 | 2590.67 | 652 | 629 | 138.8 |
| B | 0 | 213 | 111559 | 799.4 | 652 | 629 | 138.8 |
| B | 8 | 234 | 68362 | 488.11 | 652 | 629 | 138.8 |
| C | 1 | 29 | 1541509 | 9051.87 | 613 | 605 | 170.2 |
| C | 15 | 198 | 302399 | 1772.86 | 613 | 605 | 170.2 |
| C | 12 | 249 | 144510 | 845.35 | 613 | 605 | 170.2 |
| D | 8 | 176 | 10780078 | 110189.53 | 333 | 318 | 97.8 |
| D | 12 | 2 | 196069 | 2000.95 | 333 | 318 | 97.8 |
| D | 12 | 3 | 82408 | 839.12 | 333 | 318 | 97.8 |
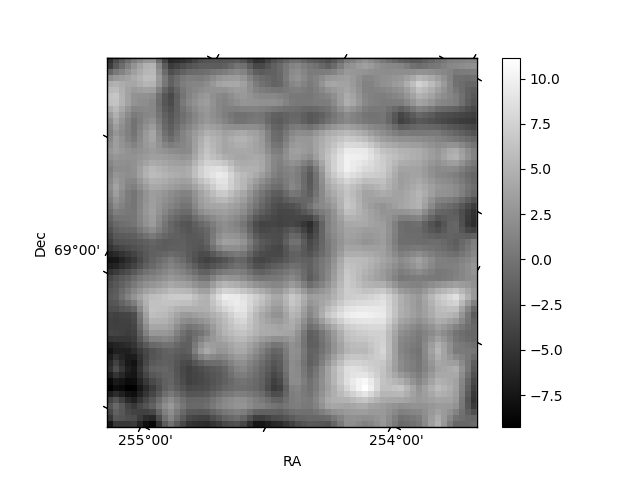
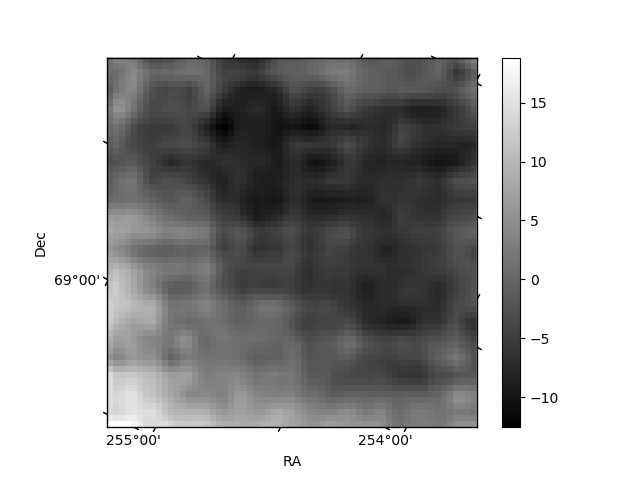
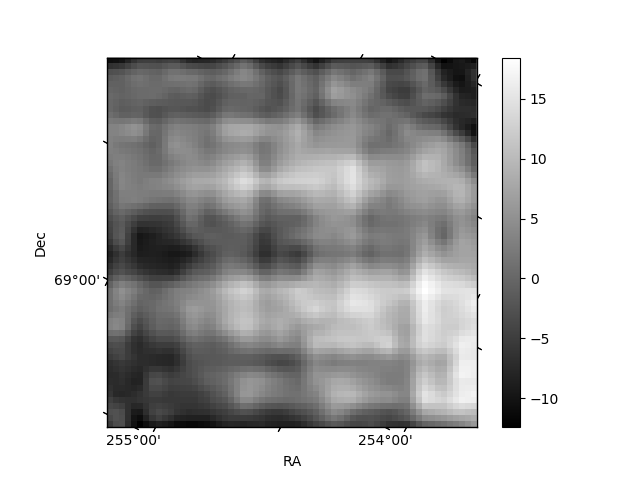
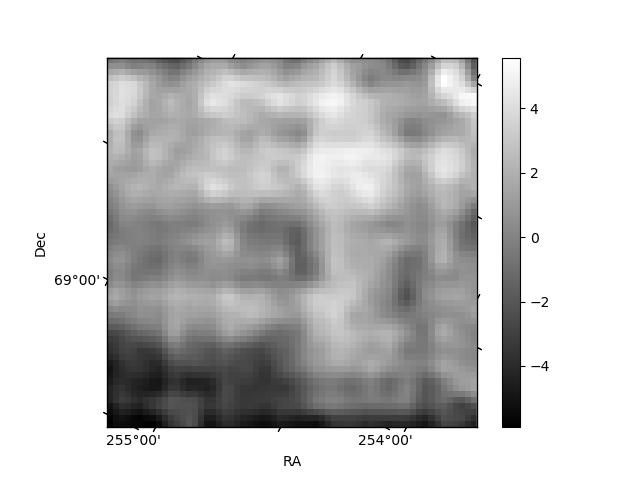
Histogram calculated using DETX and DETY for each event in the final _common_clean file
| Quadrant A | 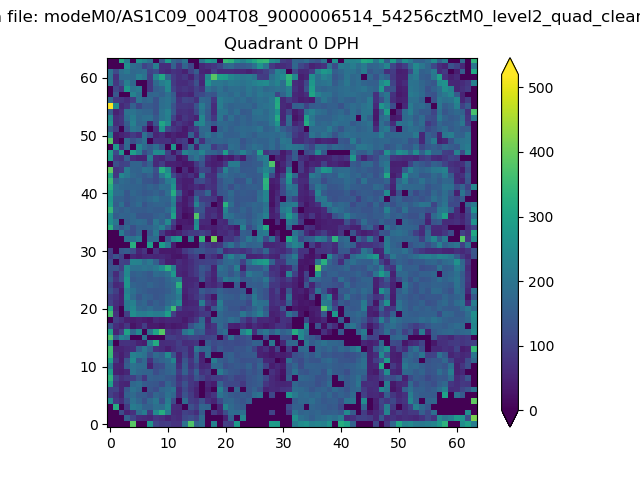 |
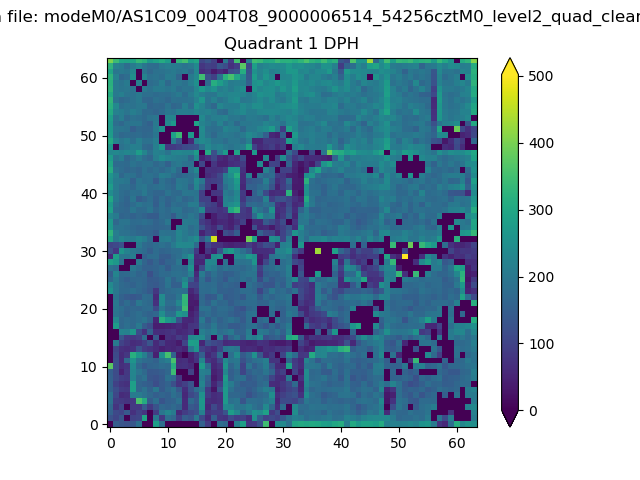 |
Quadrant B |
|---|---|---|---|
| Quadrant D | 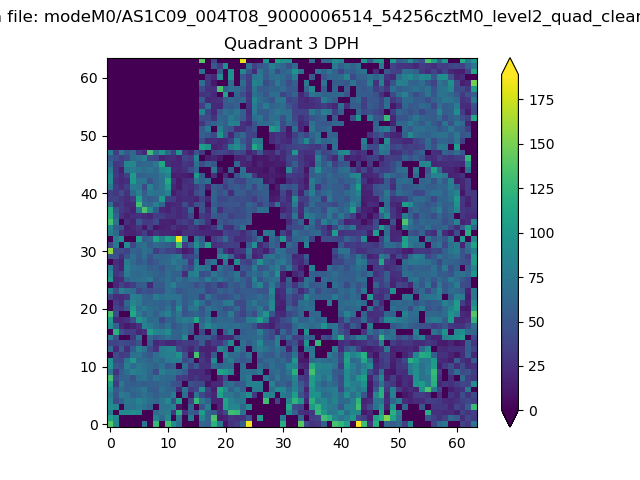 |
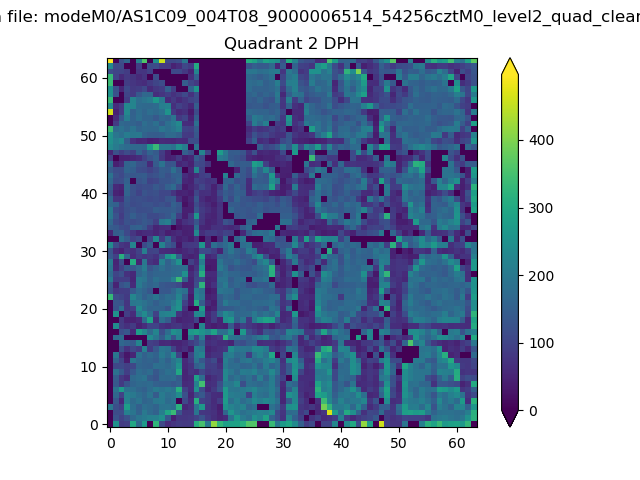 |
Quadrant C |
| Plot type | Count rate plots | Images |
|---|---|---|
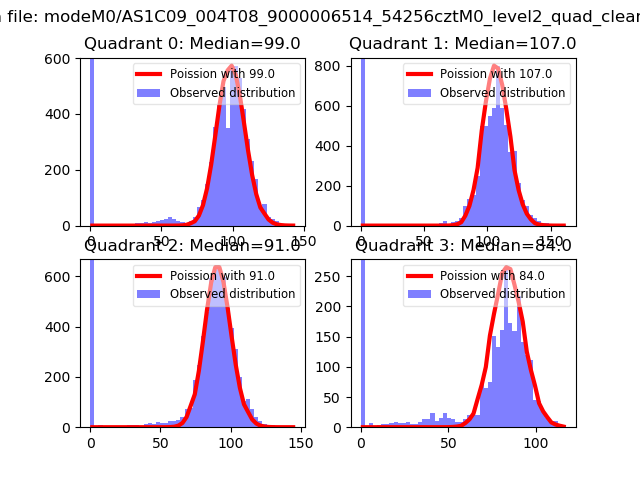
| Comparison with Poisson distribution Blue bars denote a histogram of data divided into 1 sec bins. Red curve is a Poisson curve with rate = median count rate of data. |
 |
 |
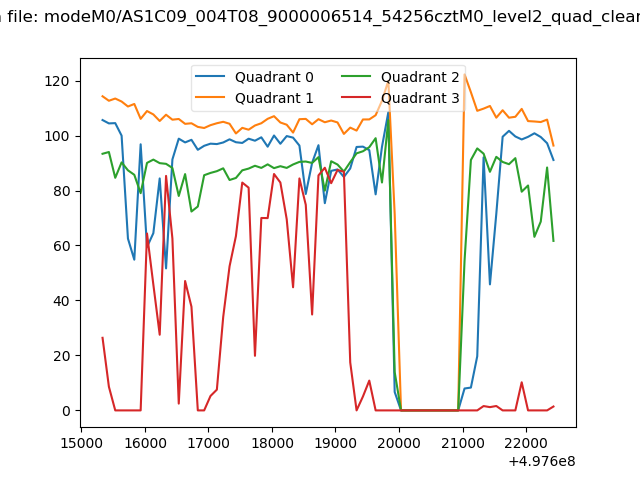
| Quadrant-wise count rates Data is divided into 100 sec bins |
 |
|
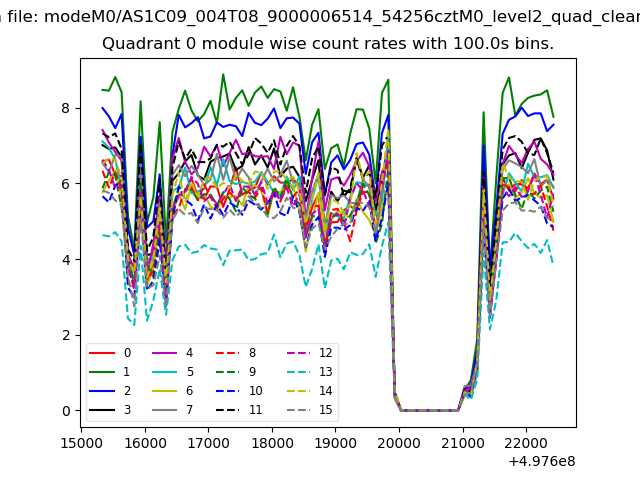
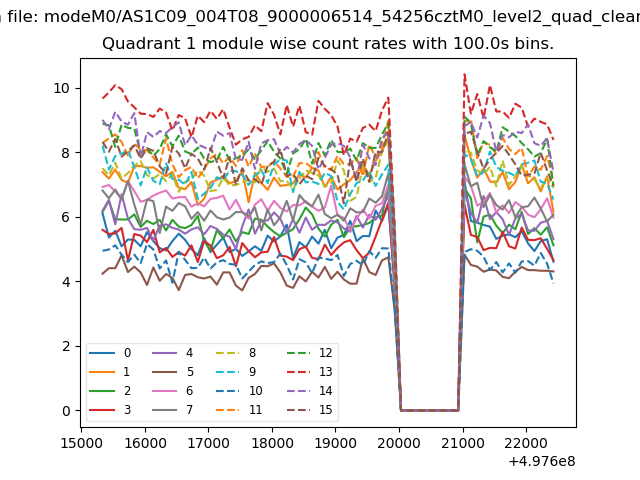
| Module-wise count rates for Quadrant A Data is divided into 100 sec bins |
 |
 |
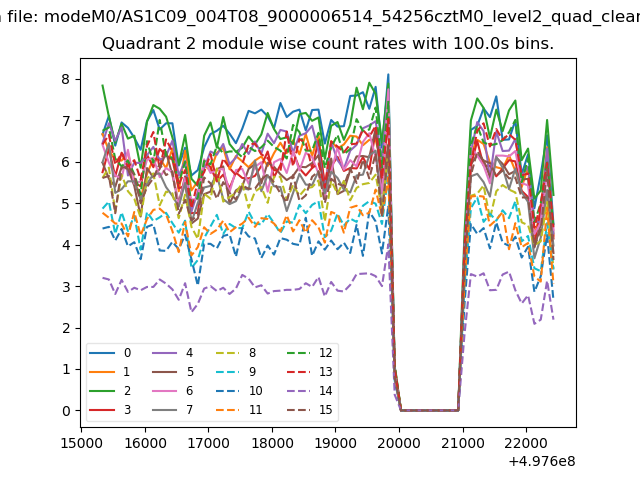
| Module-wise count rates for Quadrant B Data is divided into 100 sec bins |
 |
 |
| Module-wise count rates for Quadrant C Data is divided into 100 sec bins |
 |
 |
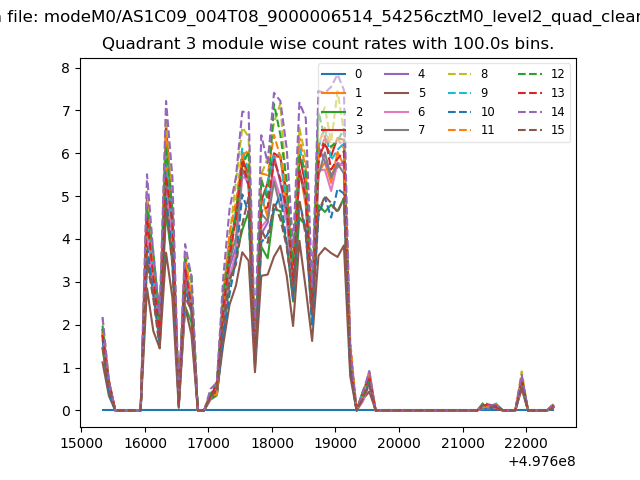
| Module-wise count rates for Quadrant D Data is divided into 100 sec bins |
 |
 |
| Parameter | Plot |
|---|---|
| CZT HV Monitor | 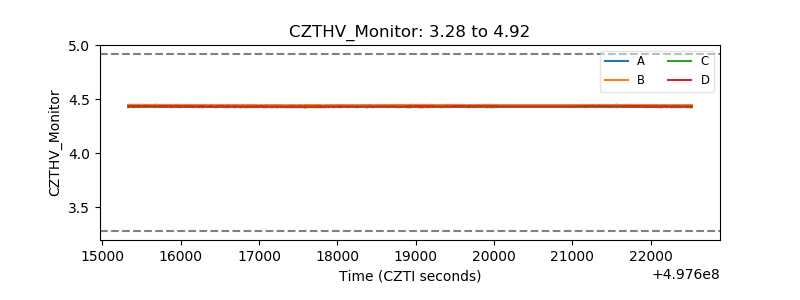 |
| D_VDD | 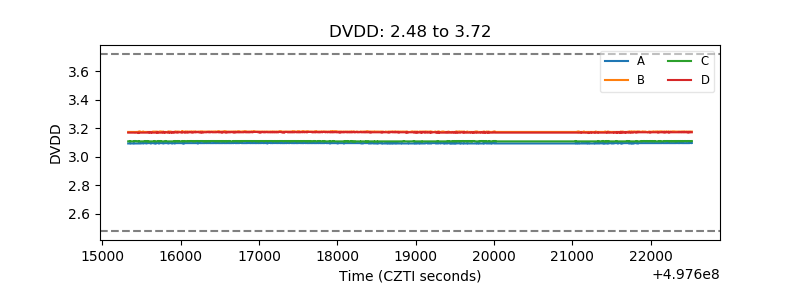 |
| Temperature 1 | 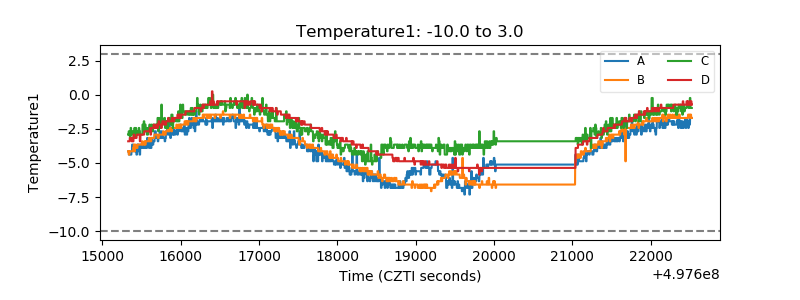 |
| Veto HV Monitor | 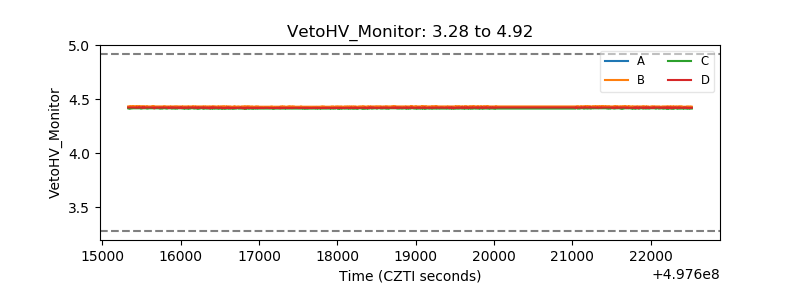 |
| Veto LLD | 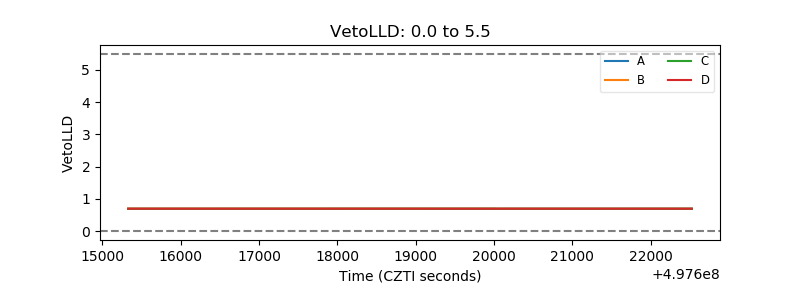 |
| Alpha Counter | 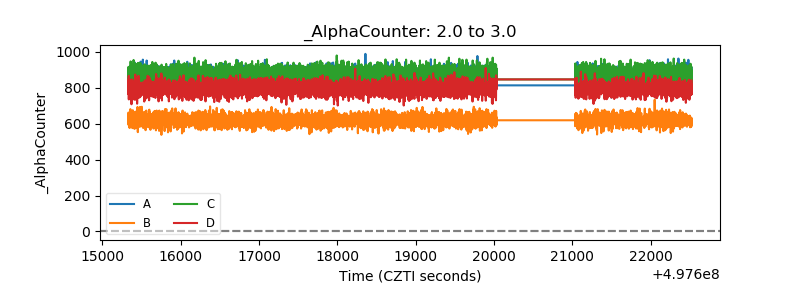 |
| _CPM_Rate | 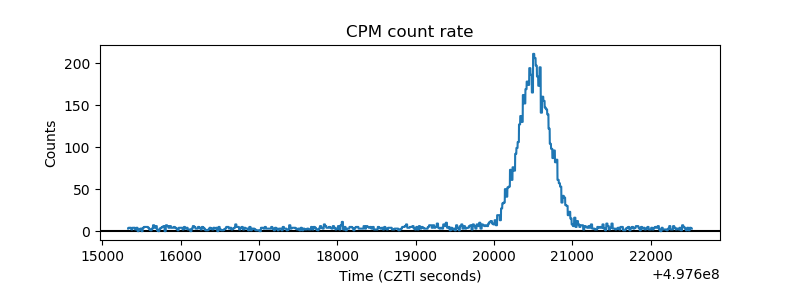 |
| CZT Counter | 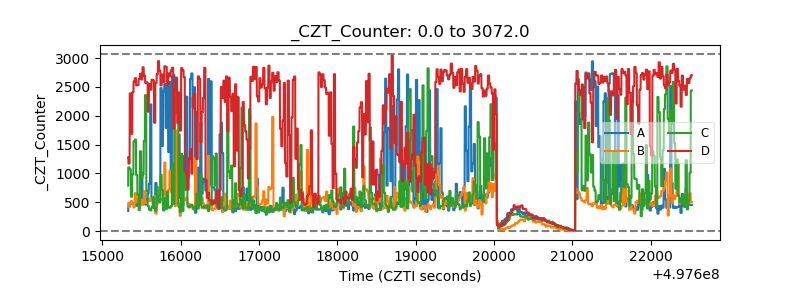 |
| +2.5 Volts monitor |  |
| +5 Volts monitor |  |
| _ROLL_ROT | 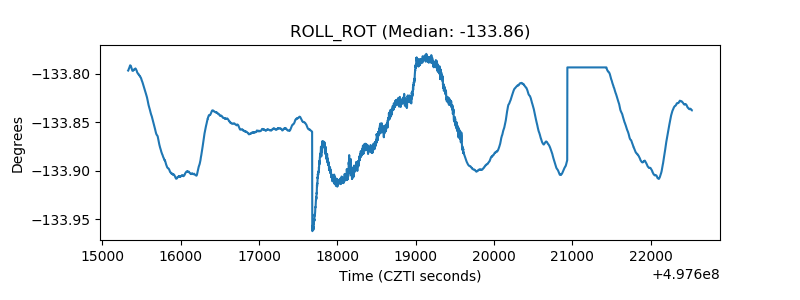 |
| _Roll_DEC | 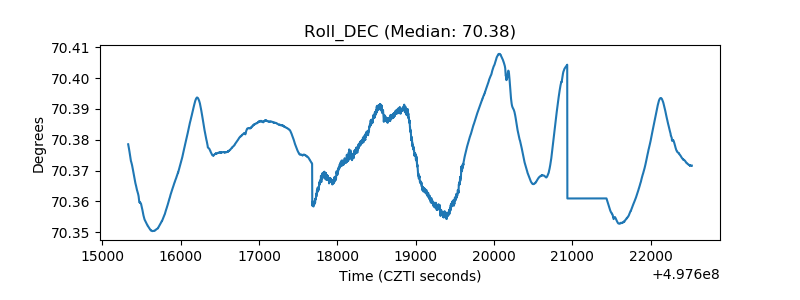 |
| _Roll_RA | 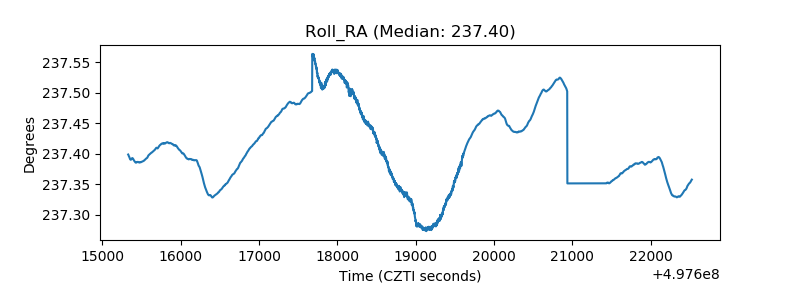 |
| Veto Counter | 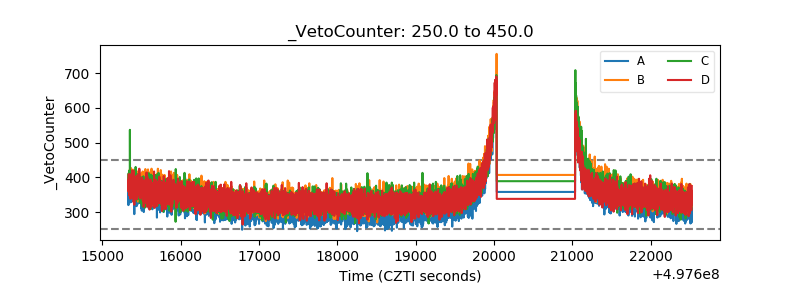 |