| Param | Original file | Final file |
|---|---|---|
| Filename | modeM0/AS1C09_004T08_9000006514_54257cztM0_level2.fits | modeM0/AS1C09_004T08_9000006514_54257cztM0_level2_quad_clean.evt |
| Size (bytes) | 776,819,520 | 85,296,960 |
| Size | 740.8 MB | 81.3 MB |
| Events in quadrant A | 4,697,484 | 624,678 |
| Events in quadrant B | 5,072,677 | 688,209 |
| Events in quadrant C | 5,316,387 | 561,917 |
| Events in quadrant D | 13,145,247 | 236,627 |
| Mode M0 | |||
|---|---|---|---|
| Quadrant | BADHDUFLAG | Total packets | Discarded packets |
| A | 0 | 18705 | 1 |
| B | 0 | 19832 | 1 |
| C | 0 | 20628 | 2 |
| D | 0 | 43691 | 1 |
| Mode M9 | |||
|---|---|---|---|
| Quadrant | BADHDUFLAG | Total packets | Discarded packets |
| A | 0 | 7 | 0 |
| B | 0 | 7 | 0 |
| C | 0 | 7 | 0 |
| D | 0 | 7 | 0 |
| Mode SS | |||
|---|---|---|---|
| Quadrant | BADHDUFLAG | Total packets | Discarded packets |
| A | 0 | 138 | 0 |
| B | 0 | 138 | 0 |
| C | 0 | 138 | 0 |
| D | 0 | 138 | 0 |
| Quadrant | Total seconds | Saturated seconds | Saturation percentage |
|---|---|---|---|
| A | 6757 | 460 | 6.807755% |
| B | 6758 | 252 | 3.728914% |
| C | 6757 | 611 | 9.042474% |
| D | 6757 | 4133 | 61.166198% |
Noise dominated data is calculated using 1-second bins in cleaned event files. If a bin has >2000 counts, and if more than 50% of those come from <1% of pixels, then it is considered to be noise-dominated and hence unusable.
| Quadrant | # 1 sec bins | Bins with >0 counts | Bins with >2000 counts | High rate bins dominated by noise | Noise dominated (total time) | Noise dominated (detector-on time) | Marked lightcurve |
|---|---|---|---|---|---|---|---|
| A | 7487 | 6758 | 325 | 325 | 4.34% | 4.81% | 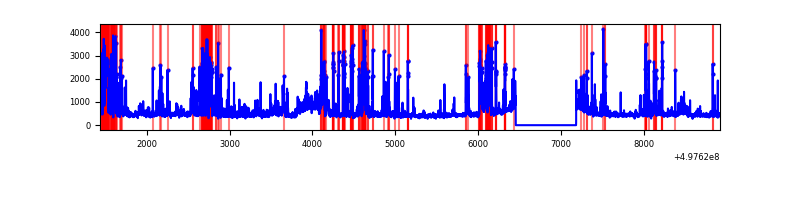 |
| B | 7488 | 6759 | 111 | 111 | 1.48% | 1.64% | 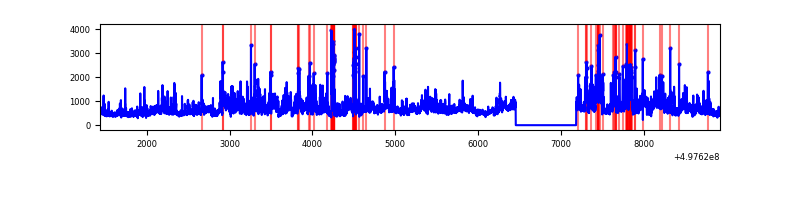 |
| C | 7487 | 6758 | 496 | 496 | 6.62% | 7.34% | 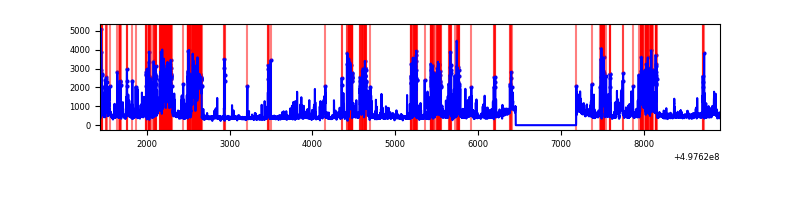 |
| D | 7487 | 6757 | 3909 | 3909 | 52.21% | 57.85% | 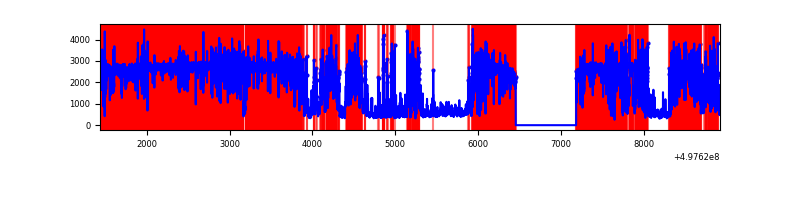 |
Top three noisy pixels from each quadrant. If the there are fewer than three noisy pixels in the level2.evt file, extra rows are filled as -1
| Pixel properties | Quadrant properties | ||||||
|---|---|---|---|---|---|---|---|
| Quadrant | DetID | PixID | Counts | Sigma | Mean | Median | Sigma |
| A | 7 | 29 | 698470 | 4031.09 | 701 | 684 | 173.1 |
| A | 13 | 248 | 537945 | 3103.74 | 701 | 684 | 173.1 |
| A | 12 | 17 | 373120 | 2151.55 | 701 | 684 | 173.1 |
| B | 7 | 0 | 1290904 | 8576.23 | 702 | 679 | 150.4 |
| B | 8 | 234 | 351439 | 2331.53 | 702 | 679 | 150.4 |
| B | 5 | 236 | 234683 | 1555.44 | 702 | 679 | 150.4 |
| C | 1 | 29 | 1450232 | 7982.13 | 665 | 657 | 181.6 |
| C | 15 | 198 | 544653 | 2995.53 | 665 | 657 | 181.6 |
| C | 13 | 3 | 254507 | 1397.83 | 665 | 657 | 181.6 |
| D | 8 | 176 | 10833419 | 87908.02 | 429 | 410 | 123.2 |
| D | 12 | 2 | 181569 | 1470.07 | 429 | 410 | 123.2 |
| D | 3 | 144 | 88433 | 714.29 | 429 | 410 | 123.2 |
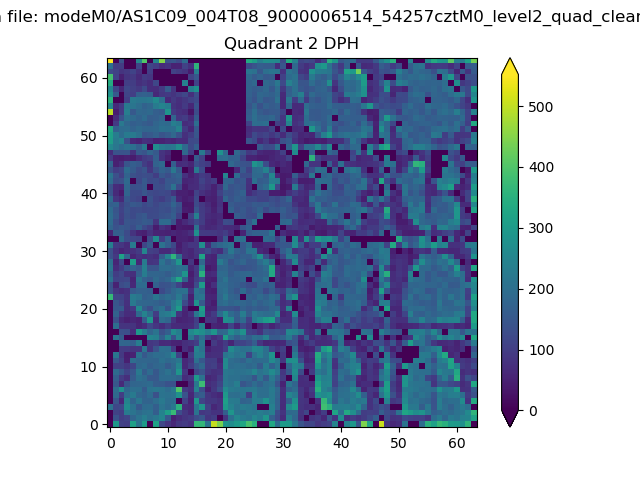
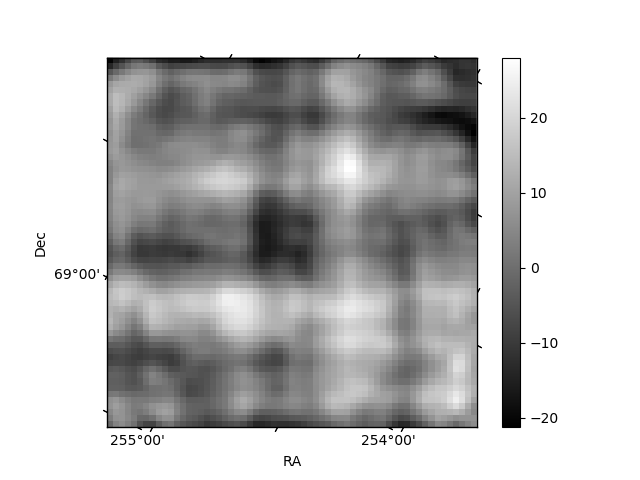
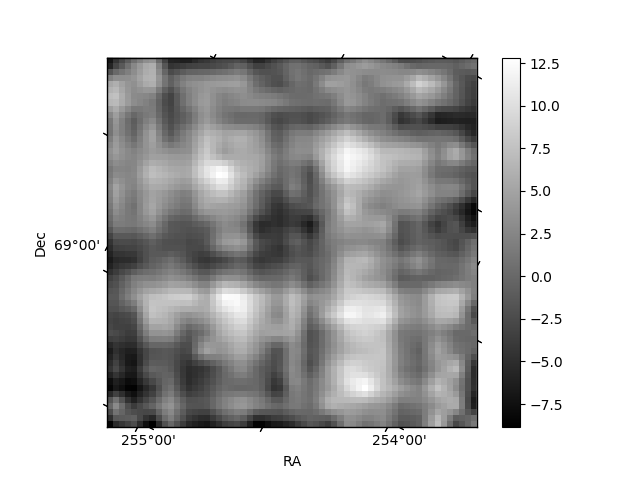
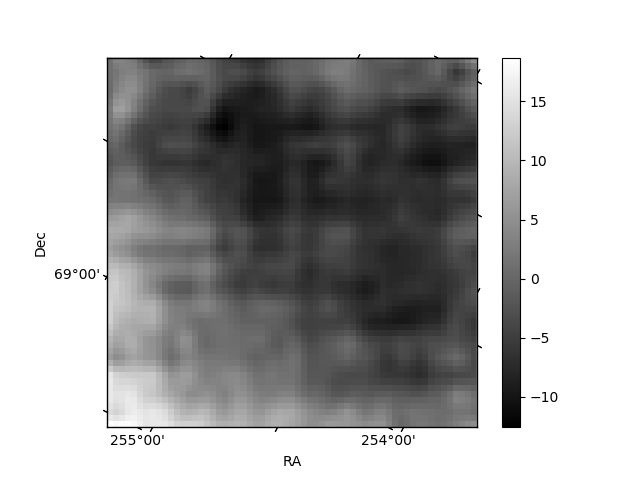
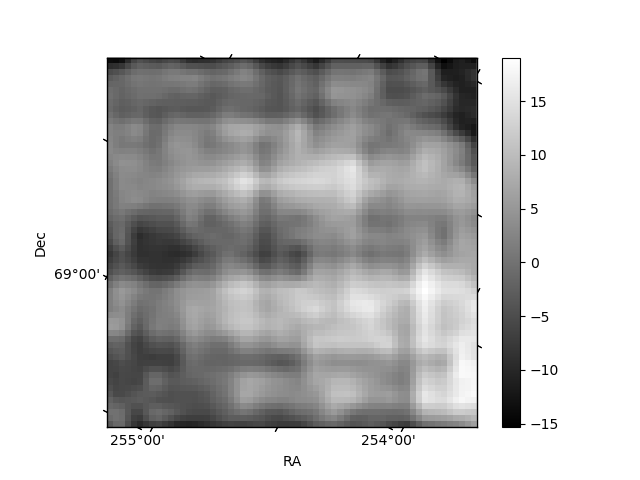
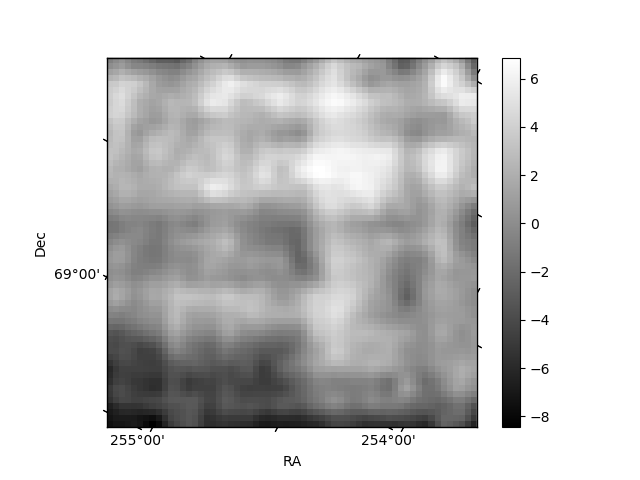
Histogram calculated using DETX and DETY for each event in the final _common_clean file
| Quadrant A | 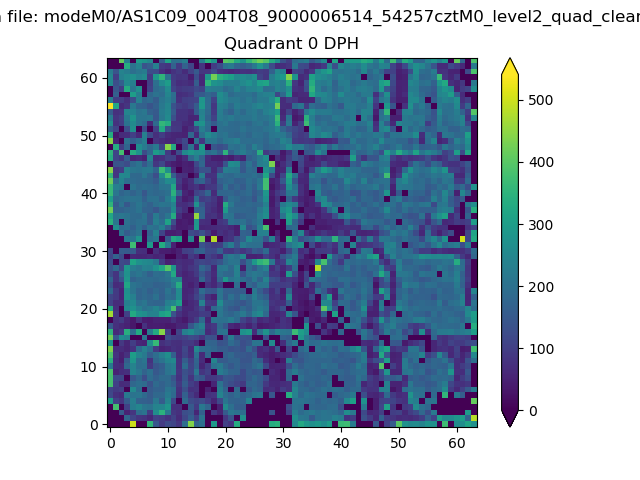 |
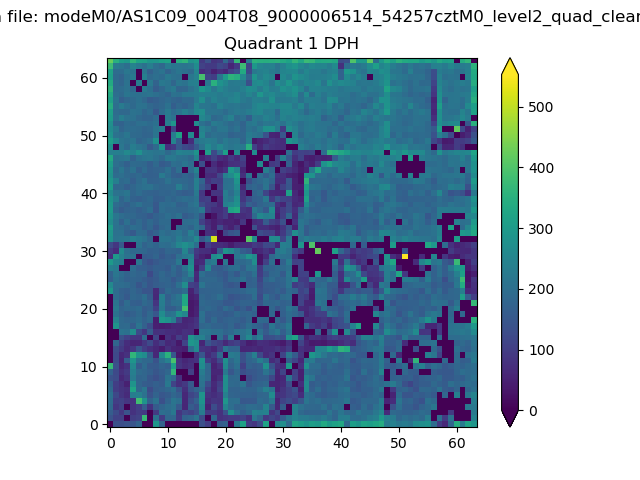 |
Quadrant B |
|---|---|---|---|
| Quadrant D | 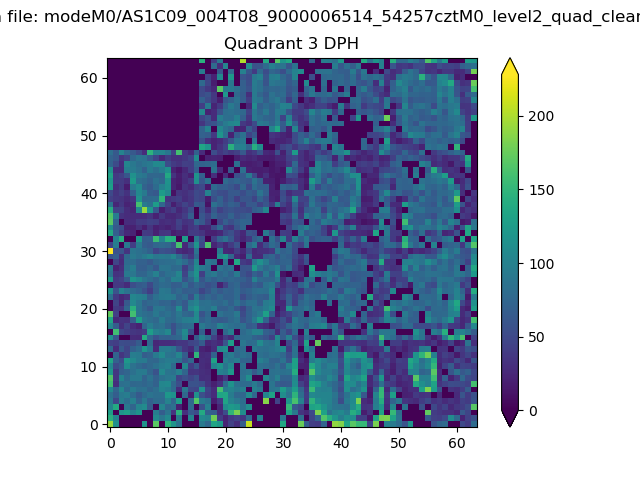 |
 |
Quadrant C |
| Plot type | Count rate plots | Images |
|---|---|---|
| Comparison with Poisson distribution Blue bars denote a histogram of data divided into 1 sec bins. Red curve is a Poisson curve with rate = median count rate of data. |
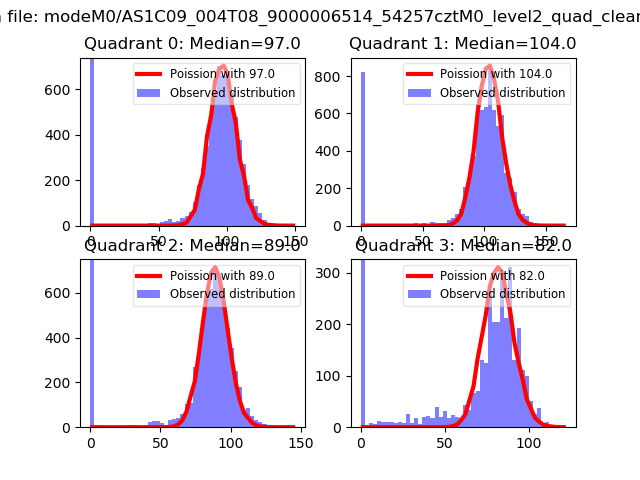 |
 |
| Quadrant-wise count rates Data is divided into 100 sec bins |
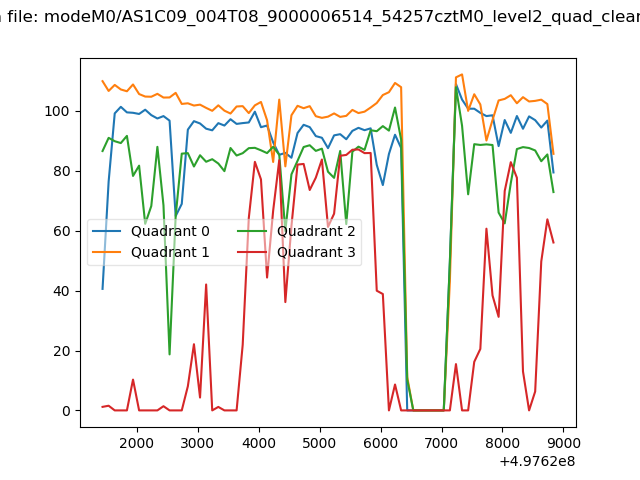 |
|
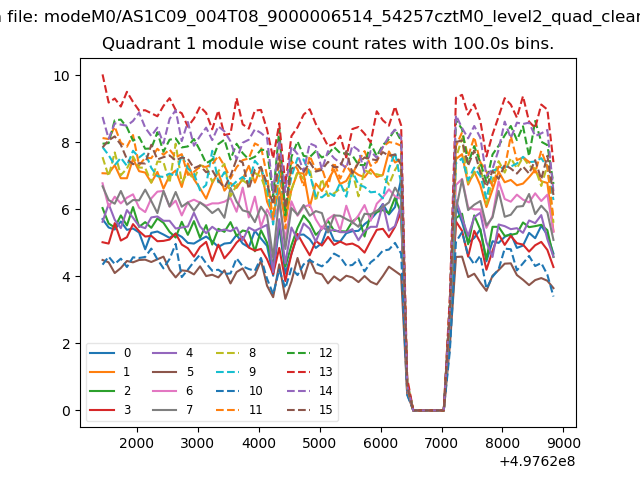
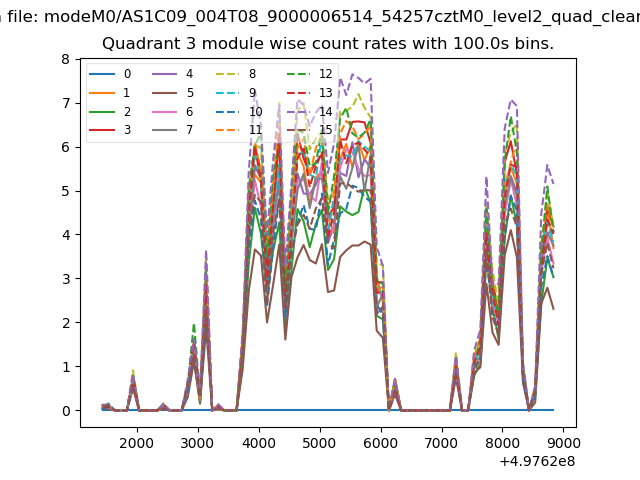
| Module-wise count rates for Quadrant A Data is divided into 100 sec bins |
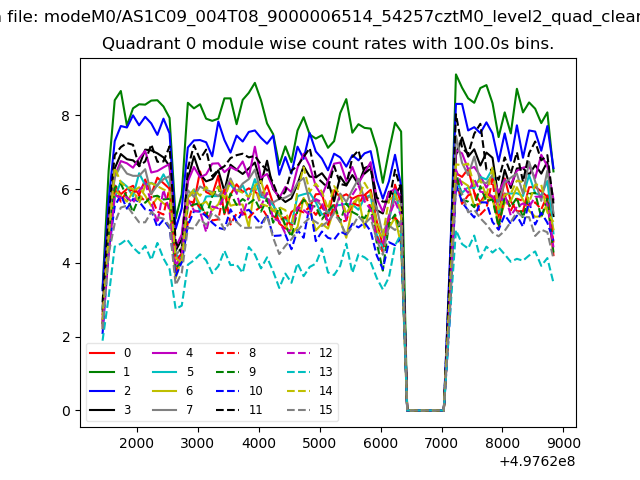 |
 |
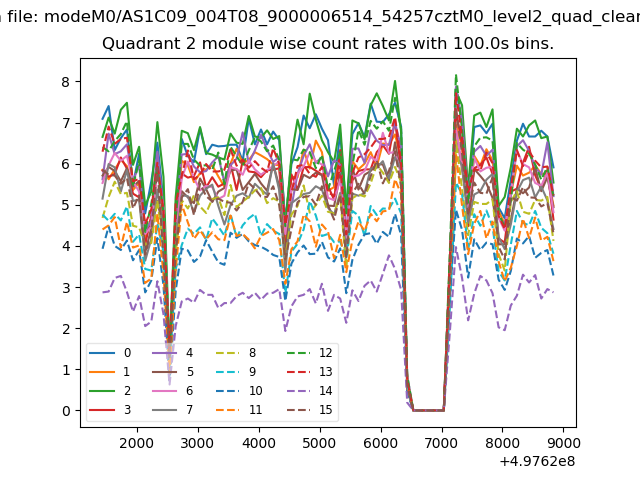
| Module-wise count rates for Quadrant B Data is divided into 100 sec bins |
 |
 |
| Module-wise count rates for Quadrant C Data is divided into 100 sec bins |
 |
 |
| Module-wise count rates for Quadrant D Data is divided into 100 sec bins |
 |
 |
| Parameter | Plot |
|---|---|
| CZT HV Monitor | 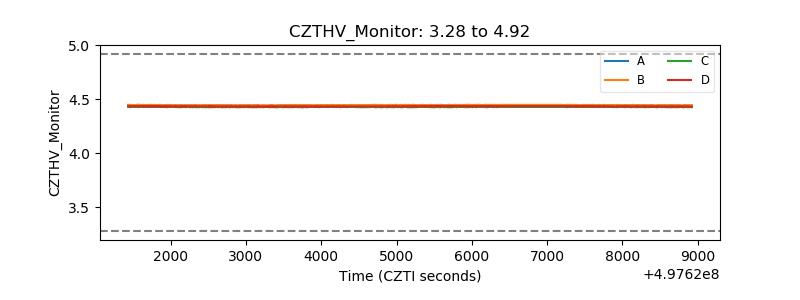 |
| D_VDD | 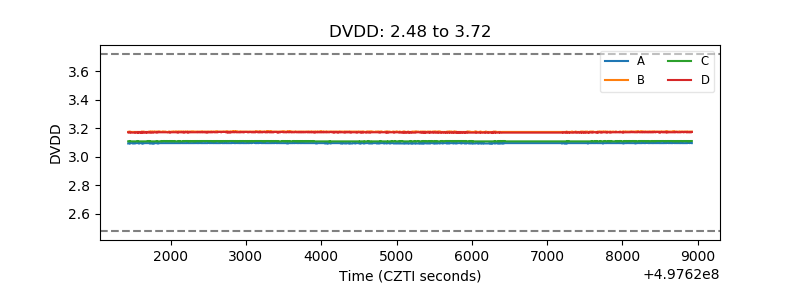 |
| Temperature 1 | 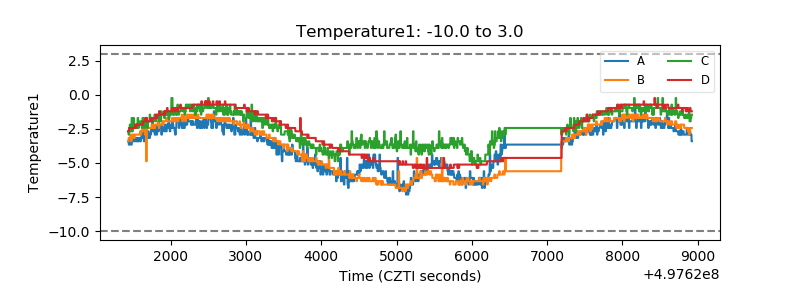 |
| Veto HV Monitor | 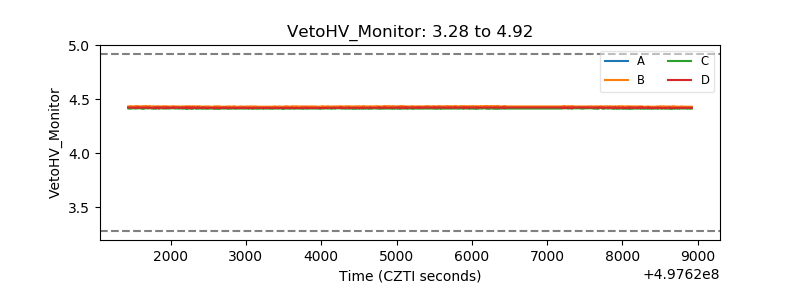 |
| Veto LLD | 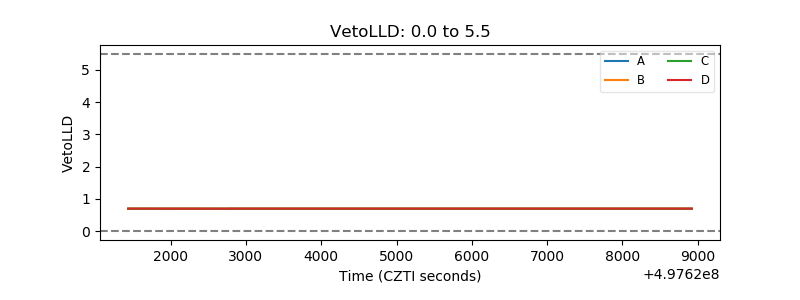 |
| Alpha Counter | 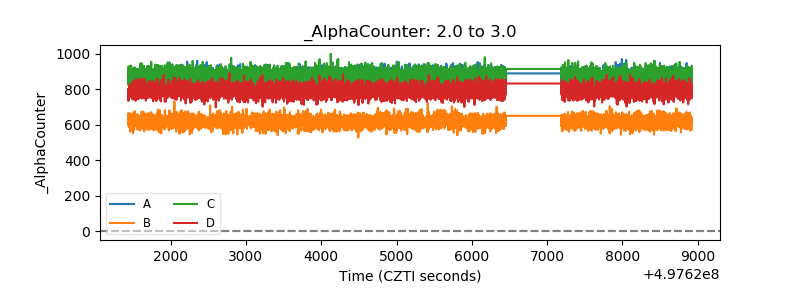 |
| _CPM_Rate | 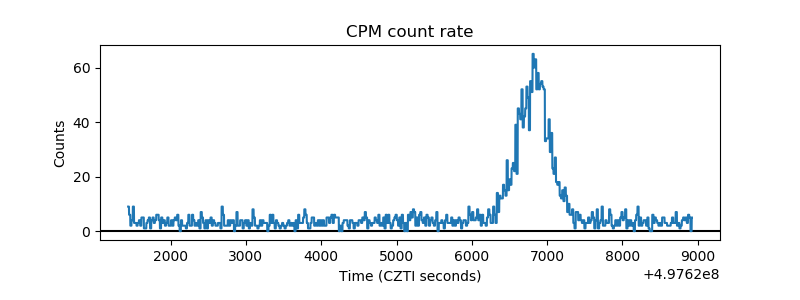 |
| CZT Counter |  |
| +2.5 Volts monitor |  |
| +5 Volts monitor |  |
| _ROLL_ROT | 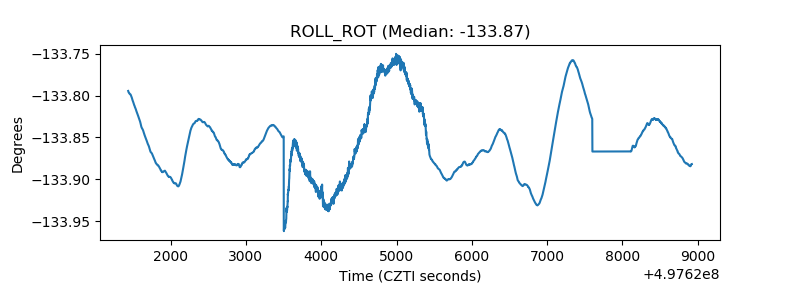 |
| _Roll_DEC | 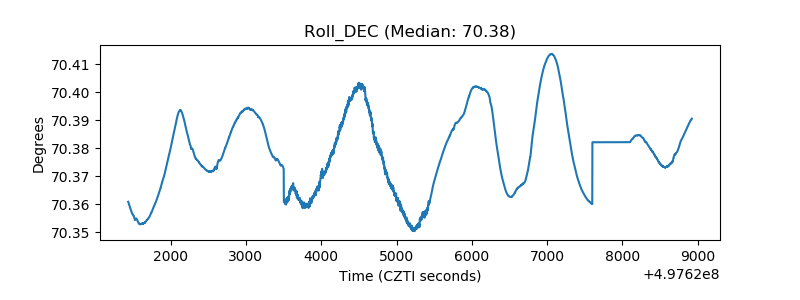 |
| _Roll_RA | 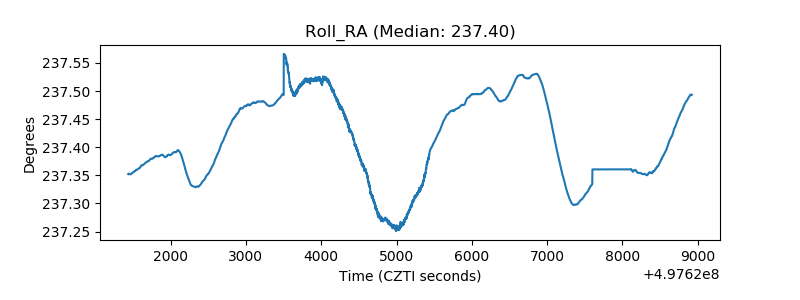 |
| Veto Counter | 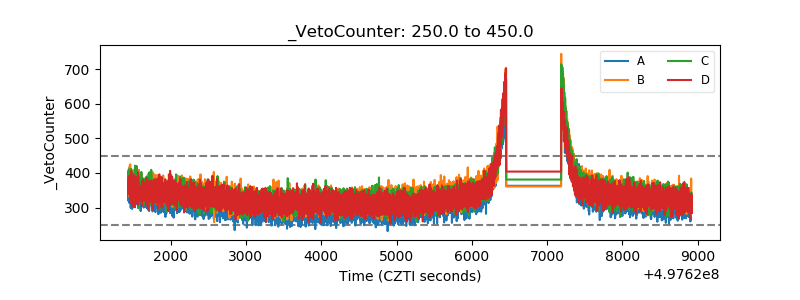 |