| Param | Original file | Final file |
|---|---|---|
| Filename | modeM0/AS1C09_004T08_9000006514_54258cztM0_level2.fits | modeM0/AS1C09_004T08_9000006514_54258cztM0_level2_quad_clean.evt |
| Size (bytes) | 585,996,480 | 94,049,280 |
| Size | 558.8 MB | 89.7 MB |
| Events in quadrant A | 4,463,563 | 631,303 |
| Events in quadrant B | 4,095,026 | 701,323 |
| Events in quadrant C | 4,957,773 | 569,939 |
| Events in quadrant D | 7,637,177 | 462,060 |
| Mode M0 | |||
|---|---|---|---|
| Quadrant | BADHDUFLAG | Total packets | Discarded packets |
| A | 0 | 18243 | 2 |
| B | 0 | 17170 | 2 |
| C | 0 | 19745 | 2 |
| D | 0 | 27592 | 2 |
| Mode M9 | |||
|---|---|---|---|
| Quadrant | BADHDUFLAG | Total packets | Discarded packets |
| A | 0 | 1 | 0 |
| B | 0 | 1 | 0 |
| C | 0 | 1 | 0 |
| D | 0 | 1 | 0 |
| Mode SS | |||
|---|---|---|---|
| Quadrant | BADHDUFLAG | Total packets | Discarded packets |
| A | 0 | 142 | 0 |
| B | 0 | 140 | 0 |
| C | 0 | 140 | 0 |
| D | 0 | 140 | 0 |
| Quadrant | Total seconds | Saturated seconds | Saturation percentage |
|---|---|---|---|
| A | 6932 | 463 | 6.679169% |
| B | 6932 | 213 | 3.072706% |
| C | 6932 | 614 | 8.857473% |
| D | 6932 | 1546 | 22.302366% |
Noise dominated data is calculated using 1-second bins in cleaned event files. If a bin has >2000 counts, and if more than 50% of those come from <1% of pixels, then it is considered to be noise-dominated and hence unusable.
| Quadrant | # 1 sec bins | Bins with >0 counts | Bins with >2000 counts | High rate bins dominated by noise | Noise dominated (total time) | Noise dominated (detector-on time) | Marked lightcurve |
|---|---|---|---|---|---|---|---|
| A | 7092 | 6933 | 323 | 323 | 4.55% | 4.66% | 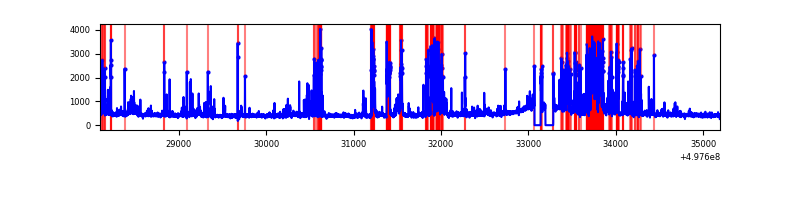 |
| B | 7092 | 6934 | 55 | 55 | 0.78% | 0.79% | 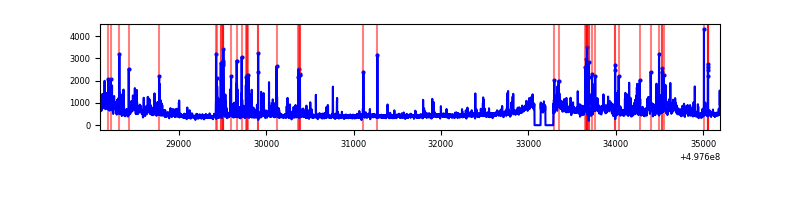 |
| C | 7092 | 6933 | 414 | 414 | 5.84% | 5.97% | 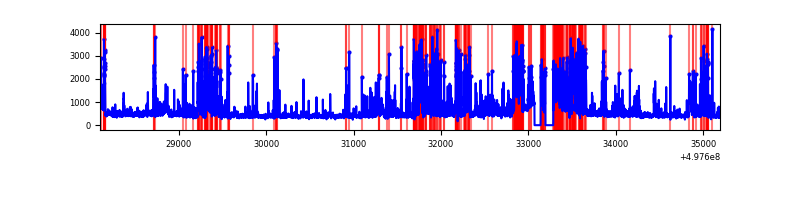 |
| D | 7092 | 6933 | 1246 | 1246 | 17.57% | 17.97% | 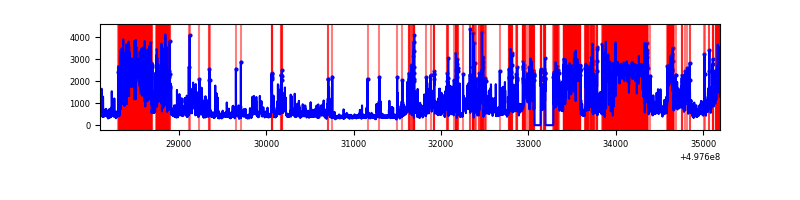 |
Top three noisy pixels from each quadrant. If the there are fewer than three noisy pixels in the level2.evt file, extra rows are filled as -1
| Pixel properties | Quadrant properties | ||||||
|---|---|---|---|---|---|---|---|
| Quadrant | DetID | PixID | Counts | Sigma | Mean | Median | Sigma |
| A | 12 | 17 | 592528 | 3319.58 | 722 | 704 | 178.3 |
| A | 7 | 29 | 461785 | 2586.24 | 722 | 704 | 178.3 |
| A | 15 | 174 | 236513 | 1322.67 | 722 | 704 | 178.3 |
| B | 7 | 0 | 474787 | 3037.21 | 732 | 708 | 156.1 |
| B | 5 | 236 | 195011 | 1244.81 | 732 | 708 | 156.1 |
| B | 0 | 213 | 166155 | 1059.94 | 732 | 708 | 156.1 |
| C | 1 | 29 | 1041291 | 5532.33 | 690 | 685 | 188.1 |
| C | 13 | 3 | 314662 | 1669.24 | 690 | 685 | 188.1 |
| C | 12 | 249 | 309120 | 1639.78 | 690 | 685 | 188.1 |
| D | 8 | 176 | 4511011 | 25322.45 | 626 | 598 | 178.1 |
| D | 10 | 181 | 166794 | 933.06 | 626 | 598 | 178.1 |
| D | 3 | 12 | 91300 | 509.22 | 626 | 598 | 178.1 |
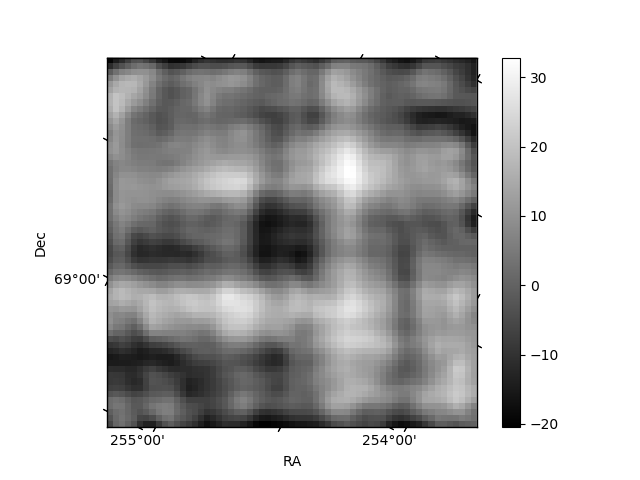
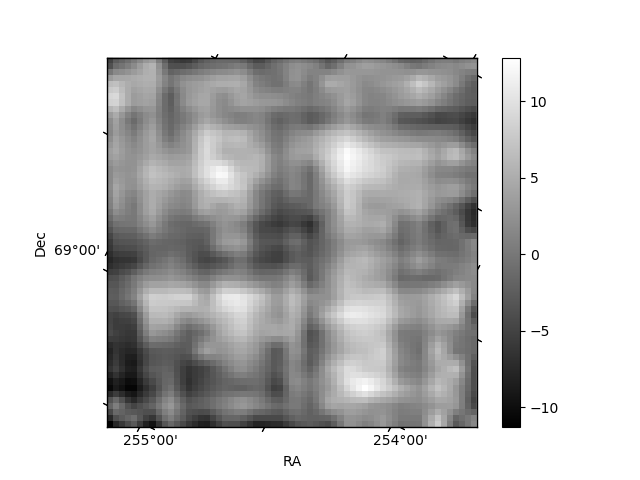
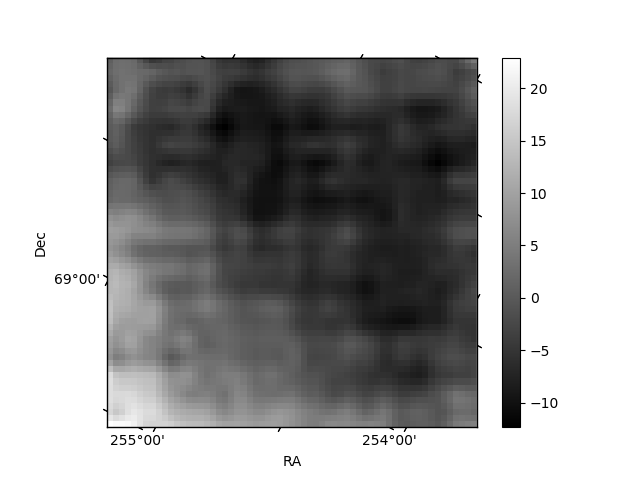
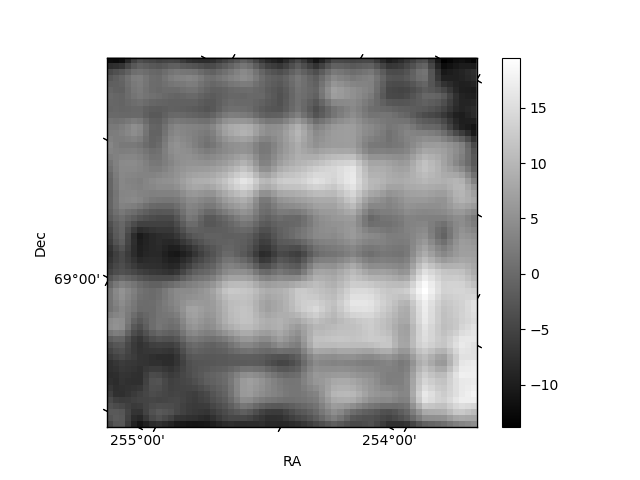
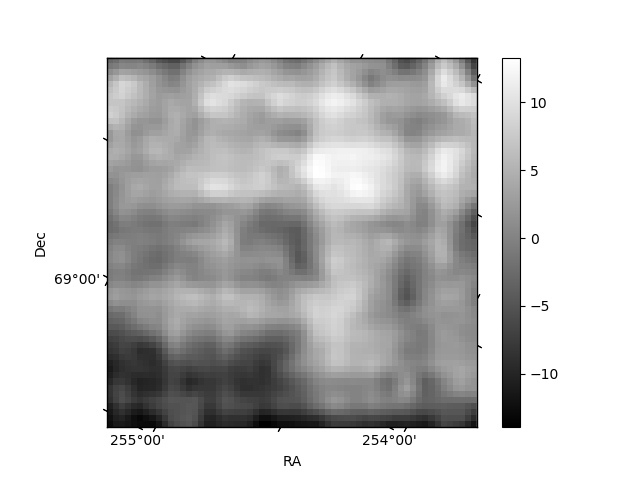
Histogram calculated using DETX and DETY for each event in the final _common_clean file
| Quadrant A | 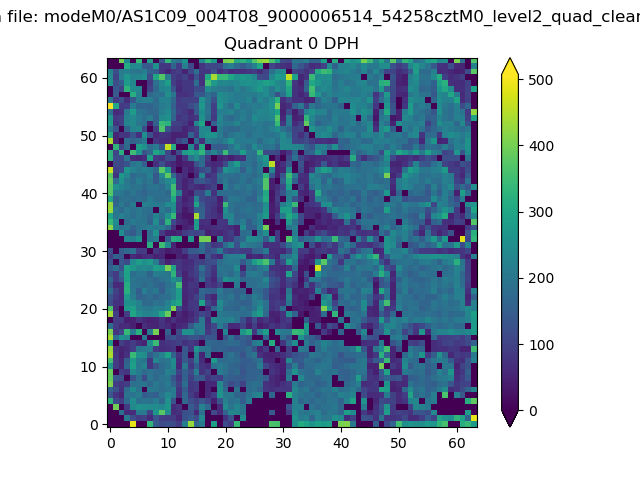 |
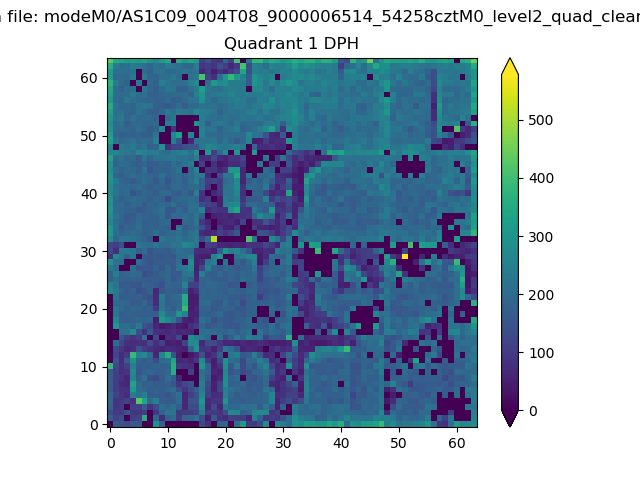 |
Quadrant B |
|---|---|---|---|
| Quadrant D | 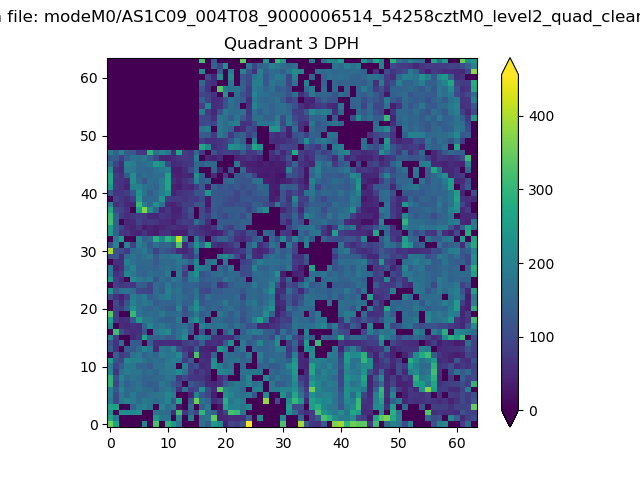 |
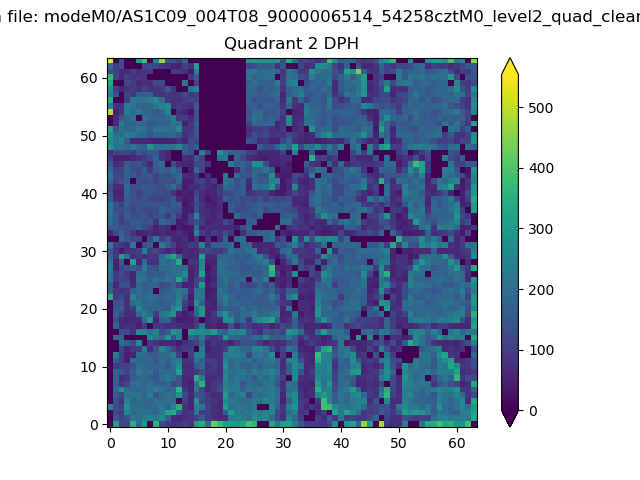 |
Quadrant C |
| Plot type | Count rate plots | Images |
|---|---|---|
| Comparison with Poisson distribution Blue bars denote a histogram of data divided into 1 sec bins. Red curve is a Poisson curve with rate = median count rate of data. |
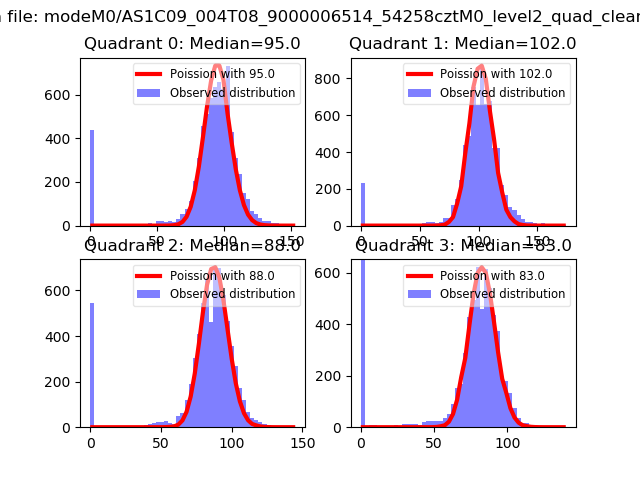 |
 |
| Quadrant-wise count rates Data is divided into 100 sec bins |
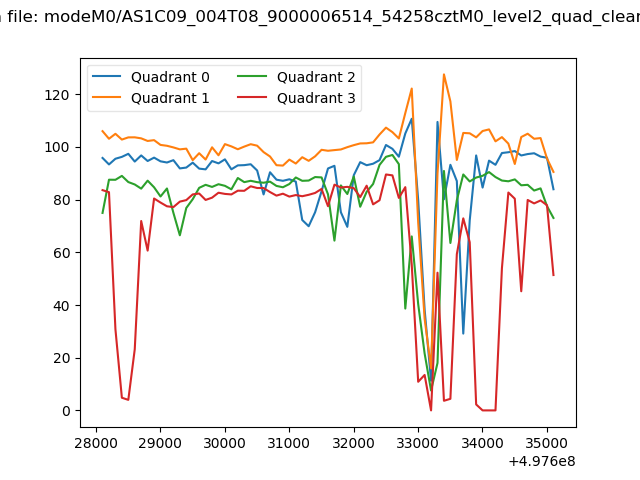 |
|
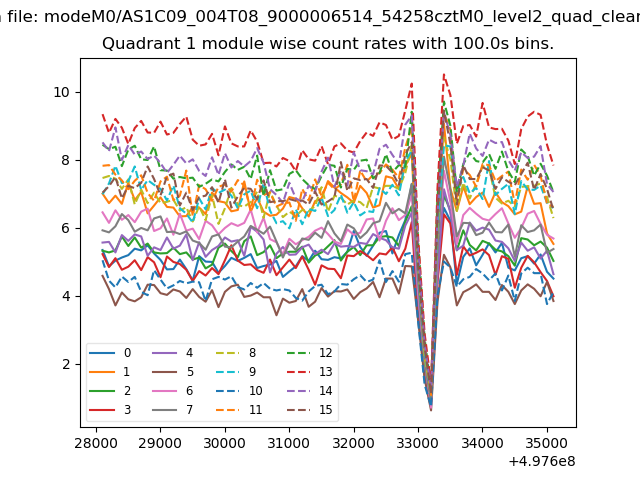
| Module-wise count rates for Quadrant A Data is divided into 100 sec bins |
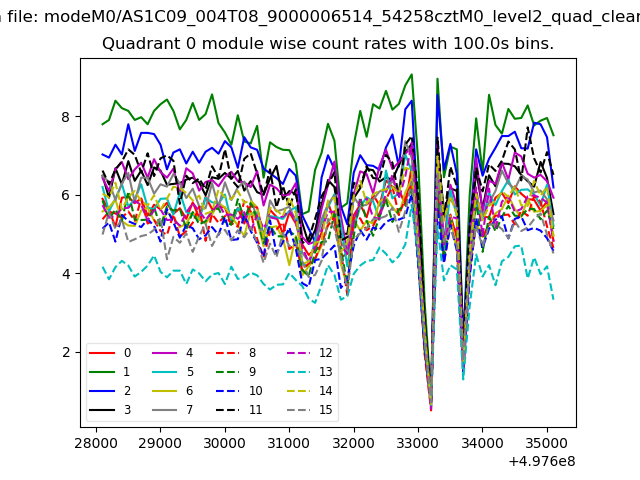 |
 |
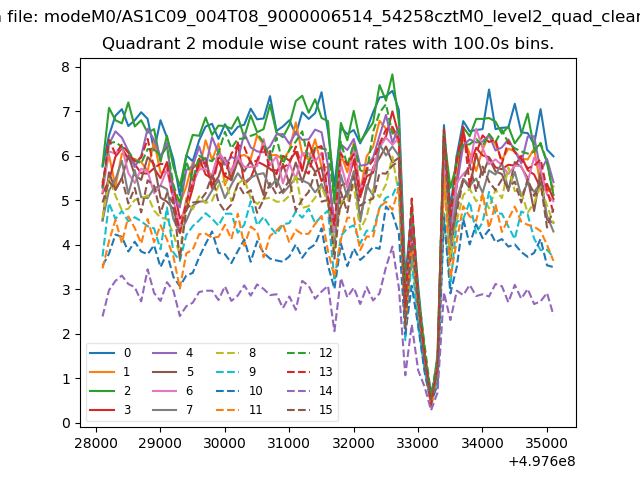
| Module-wise count rates for Quadrant B Data is divided into 100 sec bins |
 |
 |
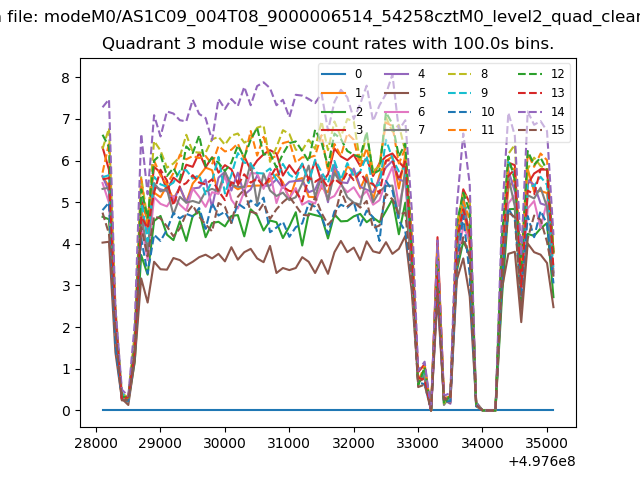
| Module-wise count rates for Quadrant C Data is divided into 100 sec bins |
 |
 |
| Module-wise count rates for Quadrant D Data is divided into 100 sec bins |
 |
 |
| Parameter | Plot |
|---|---|
| CZT HV Monitor | 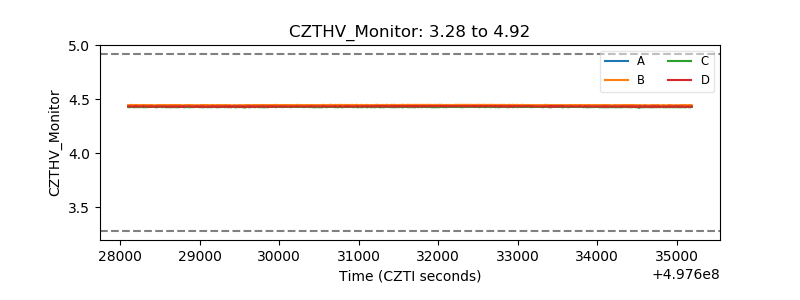 |
| D_VDD | 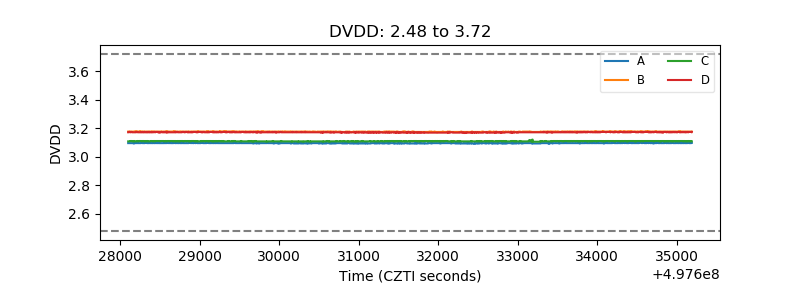 |
| Temperature 1 | 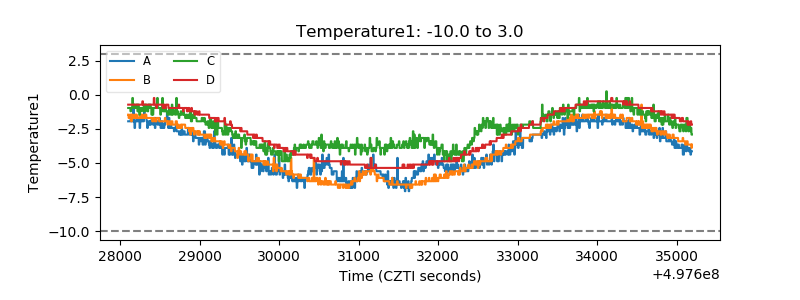 |
| Veto HV Monitor | 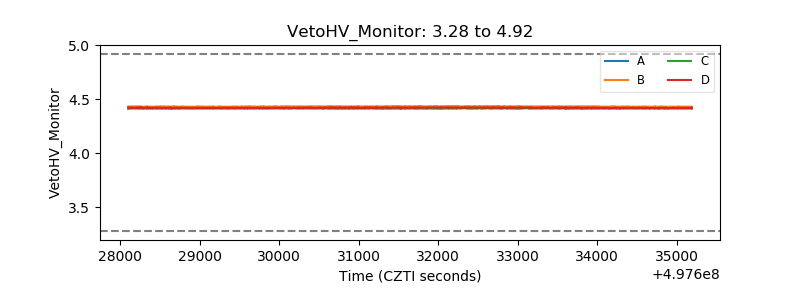 |
| Veto LLD | 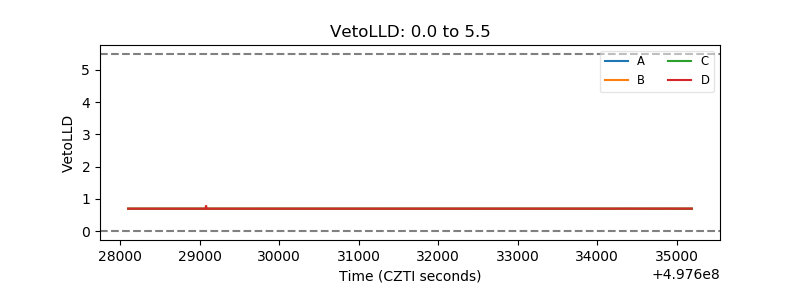 |
| Alpha Counter | 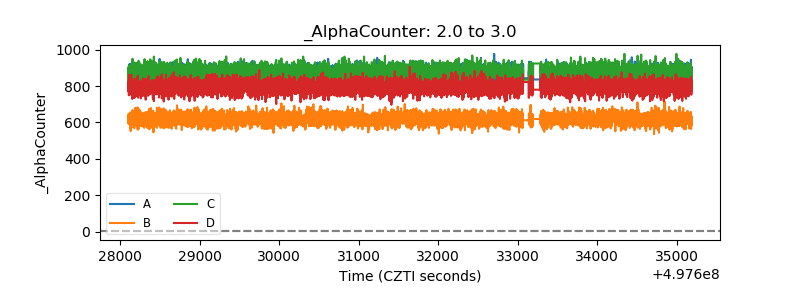 |
| _CPM_Rate | 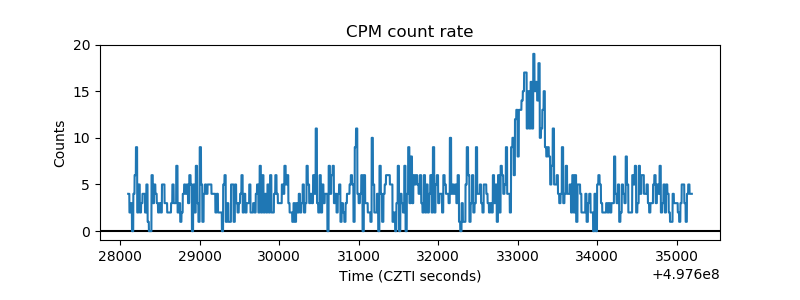 |
| CZT Counter | 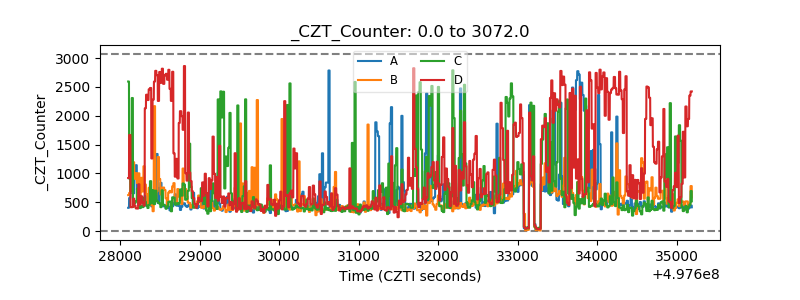 |
| +2.5 Volts monitor | 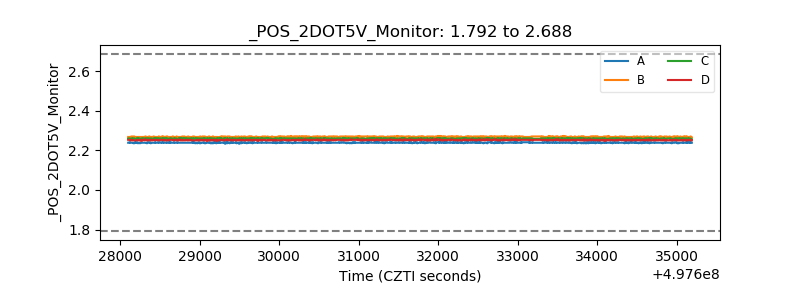 |
| +5 Volts monitor | 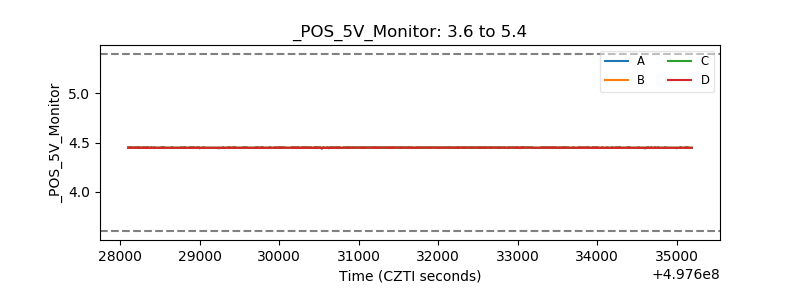 |
| _ROLL_ROT | 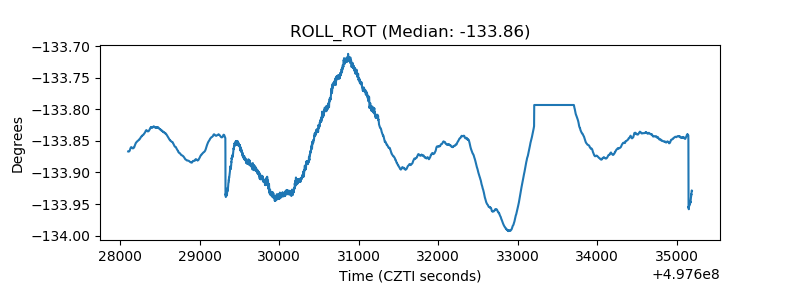 |
| _Roll_DEC | 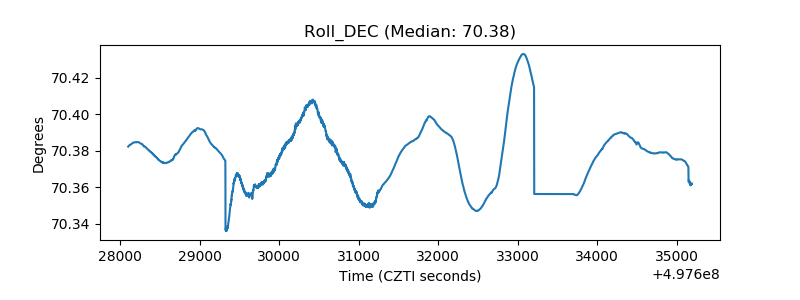 |
| _Roll_RA | 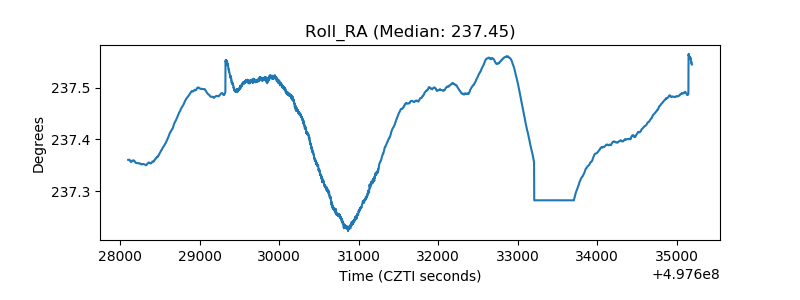 |
| Veto Counter | 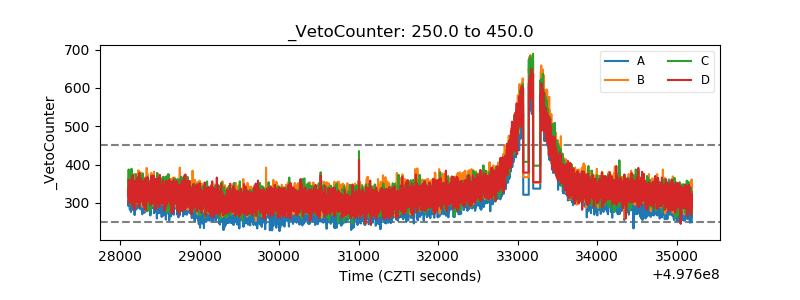 |