| Param | Original file | Final file |
|---|---|---|
| Filename | modeM0/AS1C09_004T08_9000006514_54259cztM0_level2.fits | modeM0/AS1C09_004T08_9000006514_54259cztM0_level2_quad_clean.evt |
| Size (bytes) | 694,157,760 | 95,388,480 |
| Size | 662.0 MB | 91.0 MB |
| Events in quadrant A | 4,776,052 | 663,479 |
| Events in quadrant B | 4,876,365 | 724,740 |
| Events in quadrant C | 5,245,764 | 599,034 |
| Events in quadrant D | 10,234,655 | 395,306 |
| Mode M0 | |||
|---|---|---|---|
| Quadrant | BADHDUFLAG | Total packets | Discarded packets |
| A | 0 | 19853 | 561 |
| B | 0 | 19833 | 643 |
| C | 0 | 21521 | 631 |
| D | 0 | 37380 | 1976 |
| Mode SS | |||
|---|---|---|---|
| Quadrant | BADHDUFLAG | Total packets | Discarded packets |
| A | 0 | 150 | 0 |
| B | 0 | 149 | 0 |
| C | 0 | 147 | 2 |
| D | 0 | 147 | 5 |
| Quadrant | Total seconds | Saturated seconds | Saturation percentage |
|---|---|---|---|
| A | 7290 | 405 | 5.555556% |
| B | 7250 | 220 | 3.034483% |
| C | 7301 | 577 | 7.903027% |
| D | 7167 | 2544 | 35.496023% |
Noise dominated data is calculated using 1-second bins in cleaned event files. If a bin has >2000 counts, and if more than 50% of those come from <1% of pixels, then it is considered to be noise-dominated and hence unusable.
| Quadrant | # 1 sec bins | Bins with >0 counts | Bins with >2000 counts | High rate bins dominated by noise | Noise dominated (total time) | Noise dominated (detector-on time) | Marked lightcurve |
|---|---|---|---|---|---|---|---|
| A | 7521 | 7443 | 333 | 333 | 4.43% | 4.47% | 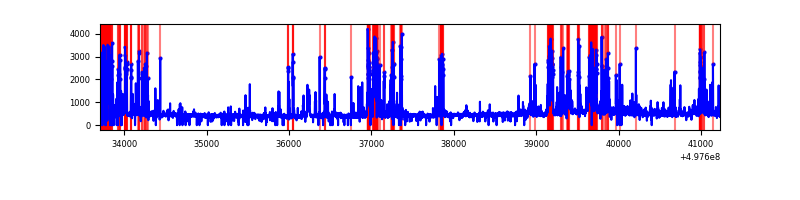 |
| B | 7522 | 7442 | 105 | 105 | 1.40% | 1.41% | 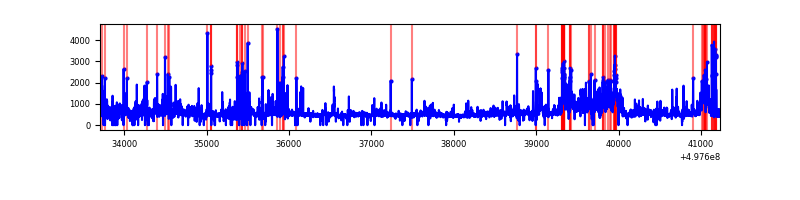 |
| C | 7522 | 7448 | 473 | 473 | 6.29% | 6.35% | 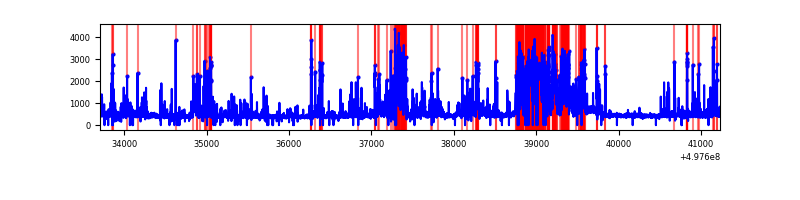 |
| D | 7522 | 7359 | 2381 | 2381 | 31.65% | 32.35% | 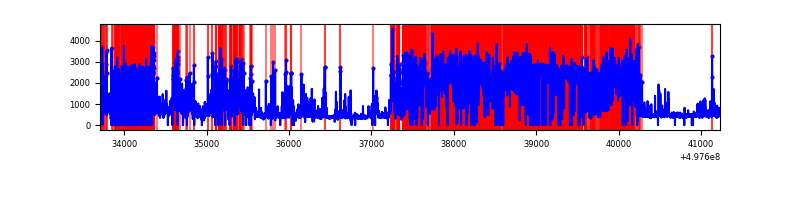 |
Top three noisy pixels from each quadrant. If the there are fewer than three noisy pixels in the level2.evt file, extra rows are filled as -1
| Pixel properties | Quadrant properties | ||||||
|---|---|---|---|---|---|---|---|
| Quadrant | DetID | PixID | Counts | Sigma | Mean | Median | Sigma |
| A | 7 | 29 | 749164 | 4037.87 | 749 | 730 | 185.4 |
| A | 12 | 17 | 413515 | 2227.01 | 749 | 730 | 185.4 |
| A | 15 | 174 | 184138 | 989.5 | 749 | 730 | 185.4 |
| B | 7 | 0 | 907351 | 5716.65 | 746 | 718 | 158.6 |
| B | 5 | 236 | 327006 | 2057.36 | 746 | 718 | 158.6 |
| B | 0 | 213 | 207461 | 1303.59 | 746 | 718 | 158.6 |
| C | 1 | 29 | 1548610 | 7867.69 | 717 | 709 | 196.7 |
| C | 14 | 254 | 312909 | 1586.85 | 717 | 709 | 196.7 |
| C | 13 | 3 | 217220 | 1100.48 | 717 | 709 | 196.7 |
| D | 8 | 176 | 7155086 | 42406.92 | 600 | 575 | 168.7 |
| D | 10 | 181 | 200314 | 1183.91 | 600 | 575 | 168.7 |
| D | 3 | 144 | 108593 | 640.25 | 600 | 575 | 168.7 |
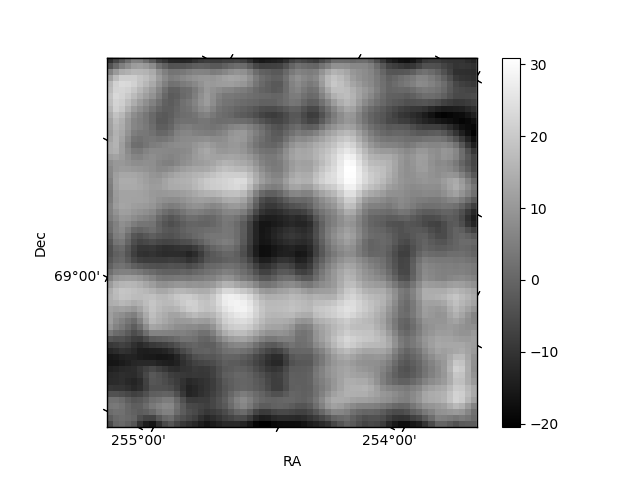
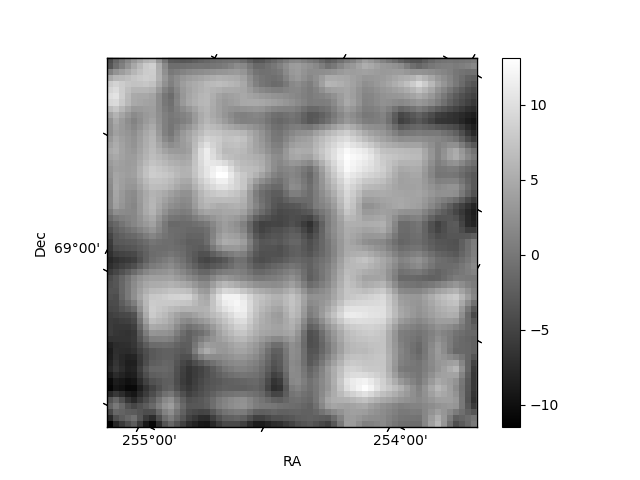
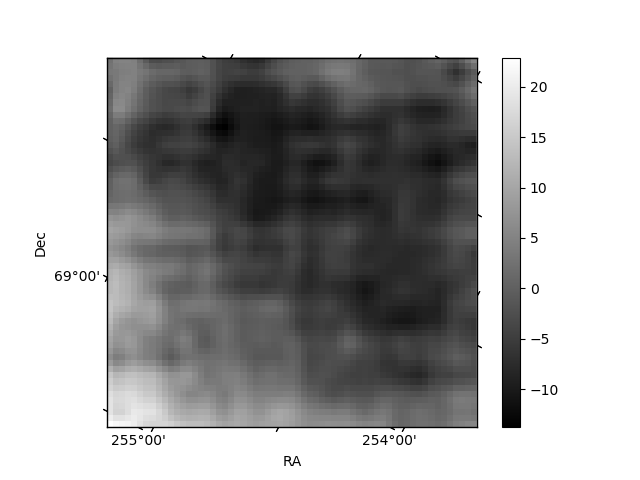
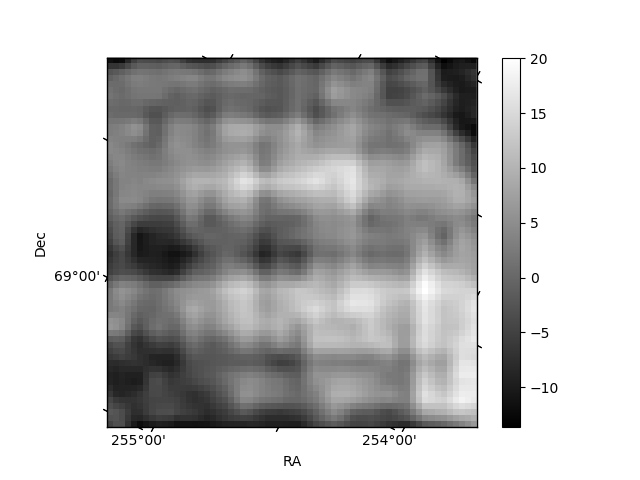
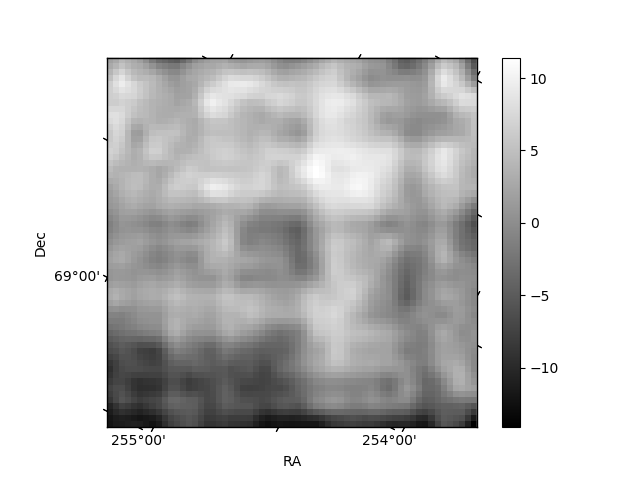
Histogram calculated using DETX and DETY for each event in the final _common_clean file
| Quadrant A | 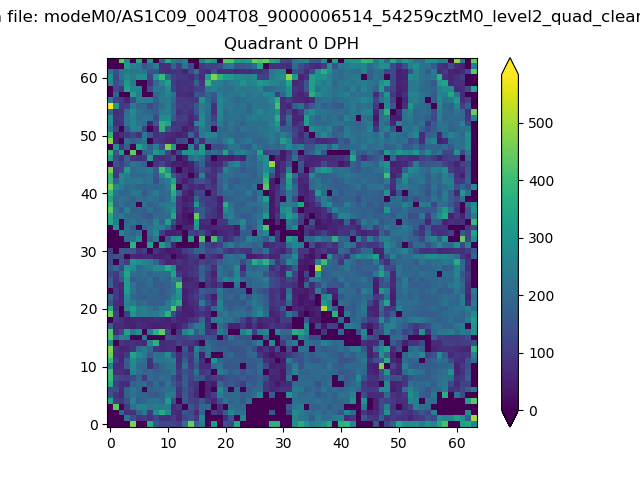 |
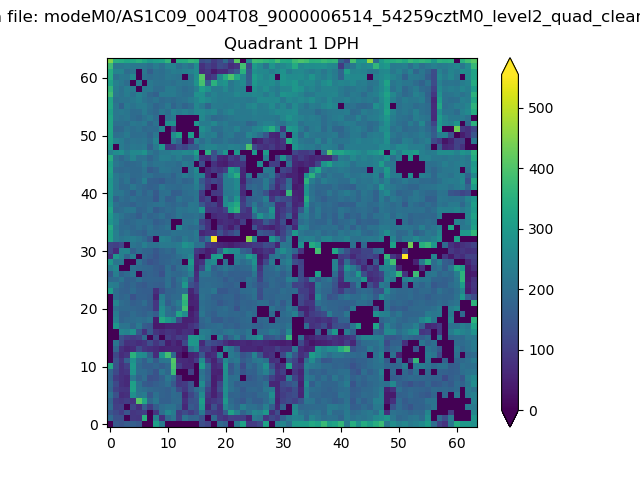 |
Quadrant B |
|---|---|---|---|
| Quadrant D | 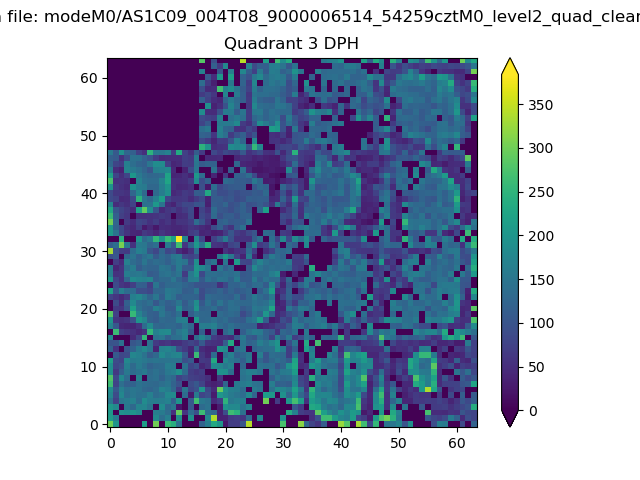 |
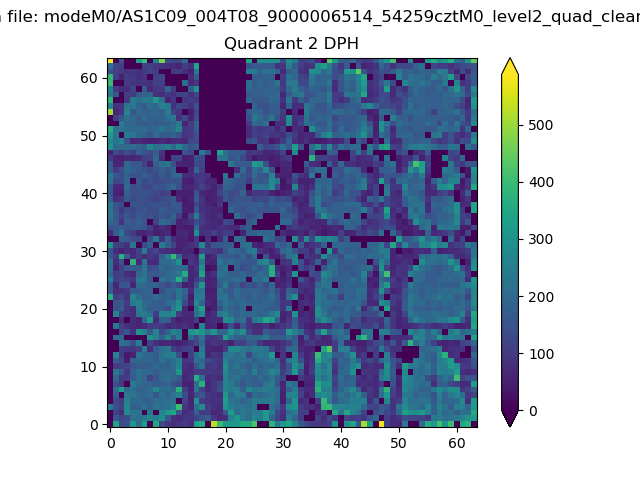 |
Quadrant C |
| Plot type | Count rate plots | Images |
|---|---|---|
| Comparison with Poisson distribution Blue bars denote a histogram of data divided into 1 sec bins. Red curve is a Poisson curve with rate = median count rate of data. |
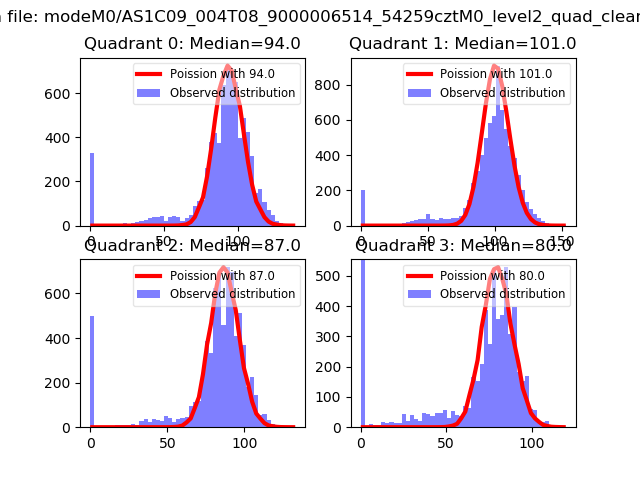 |
 |
| Quadrant-wise count rates Data is divided into 100 sec bins |
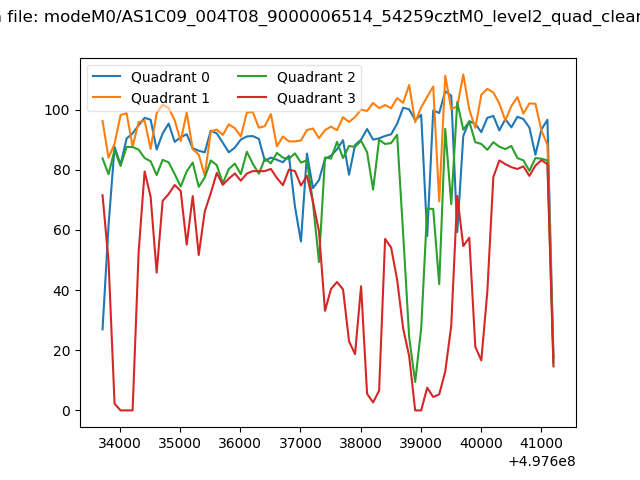 |
|
| Module-wise count rates for Quadrant A Data is divided into 100 sec bins |
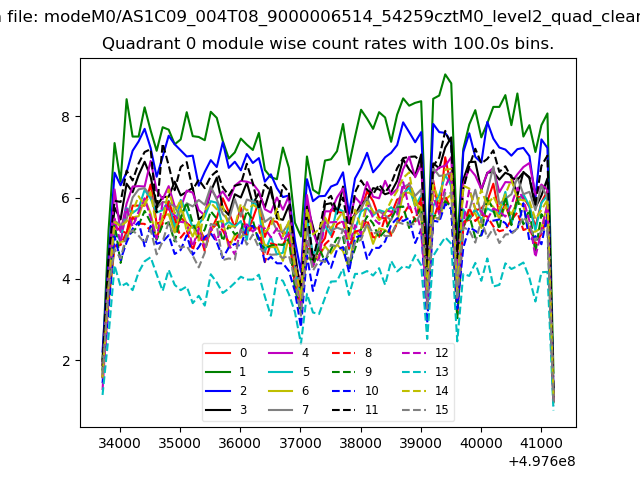 |
 |
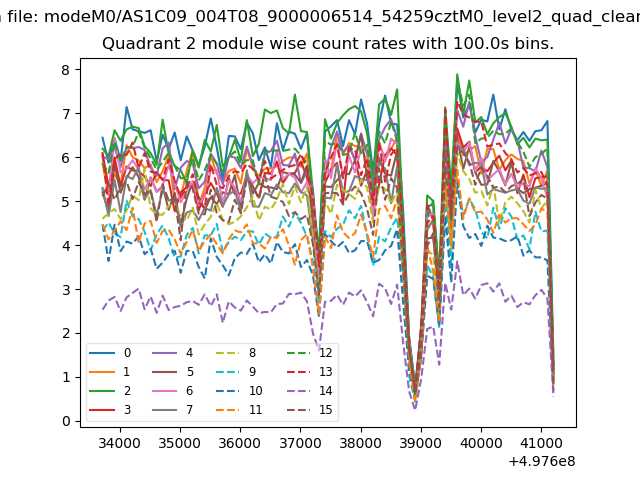
| Module-wise count rates for Quadrant B Data is divided into 100 sec bins |
 |
 |
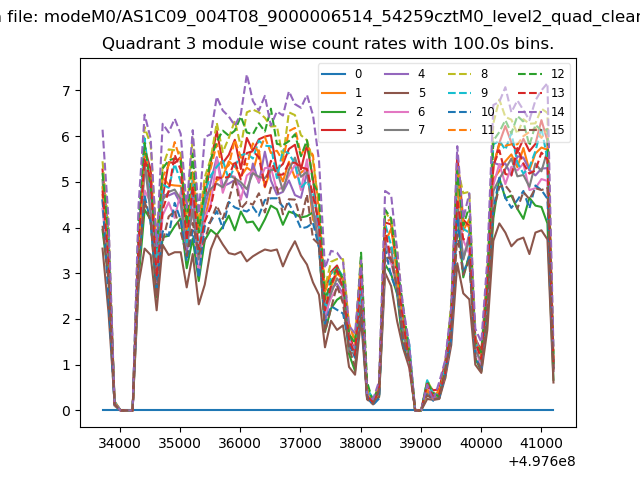
| Module-wise count rates for Quadrant C Data is divided into 100 sec bins |
 |
 |
| Module-wise count rates for Quadrant D Data is divided into 100 sec bins |
 |
 |
| Parameter | Plot |
|---|---|
| CZT HV Monitor | 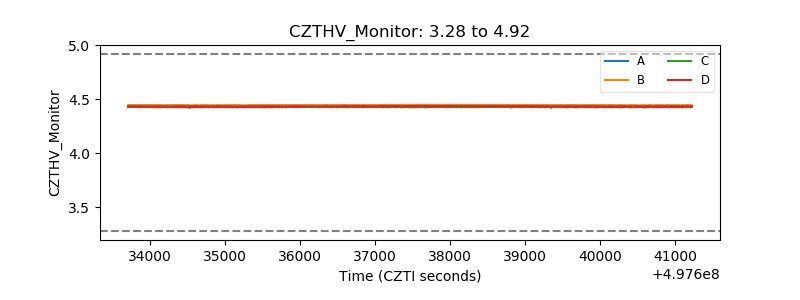 |
| D_VDD | 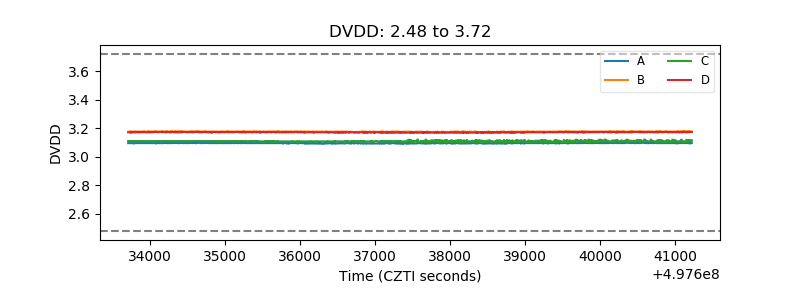 |
| Temperature 1 | 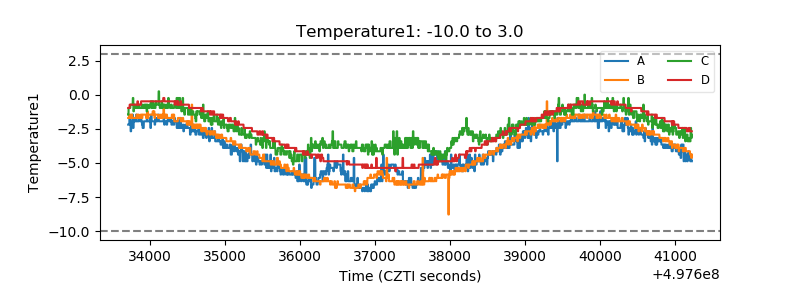 |
| Veto HV Monitor |  |
| Veto LLD | 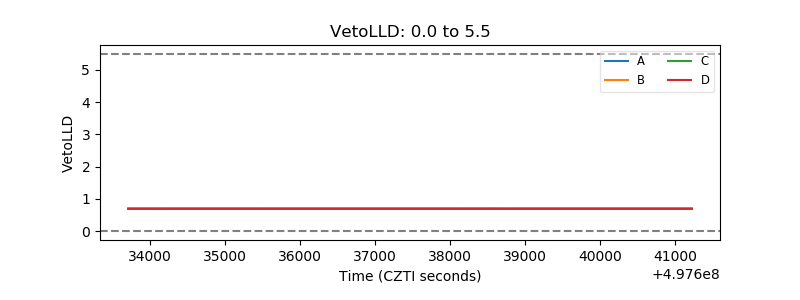 |
| Alpha Counter | 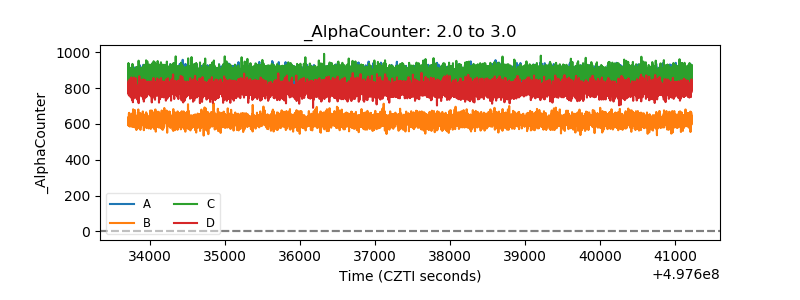 |
| _CPM_Rate | 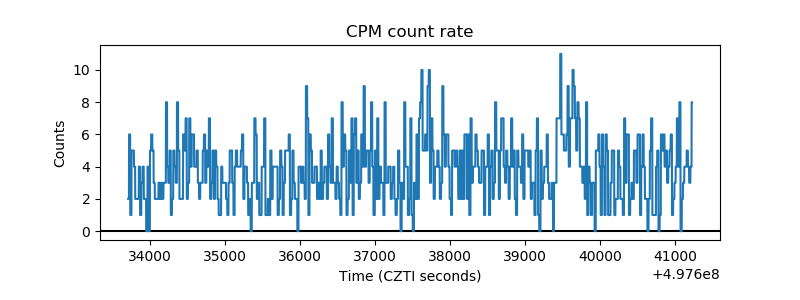 |
| CZT Counter | 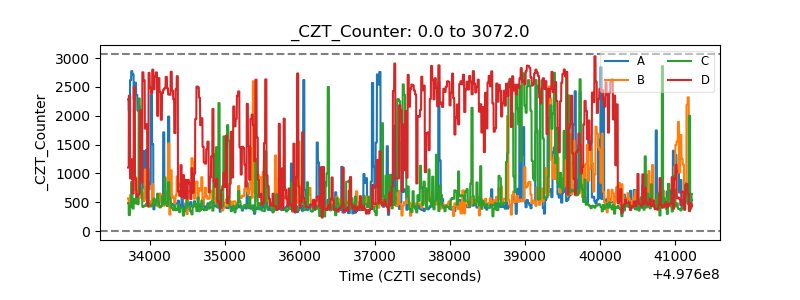 |
| +2.5 Volts monitor | 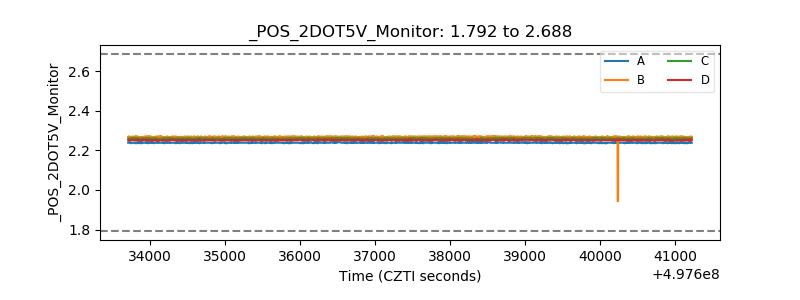 |
| +5 Volts monitor |  |
| _ROLL_ROT | 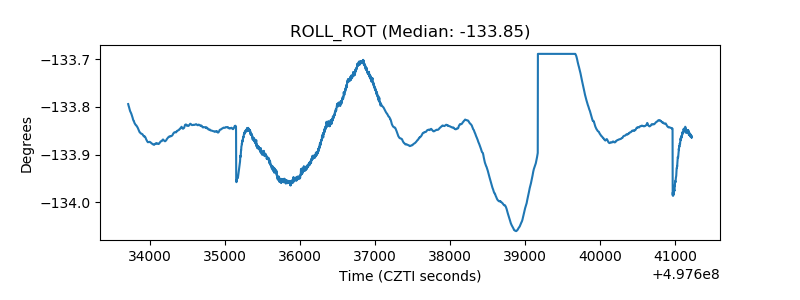 |
| _Roll_DEC | 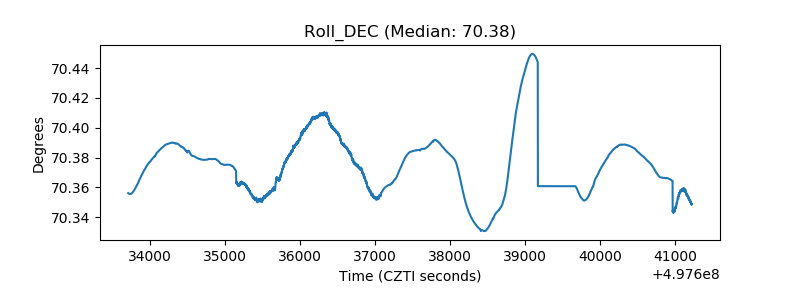 |
| _Roll_RA | 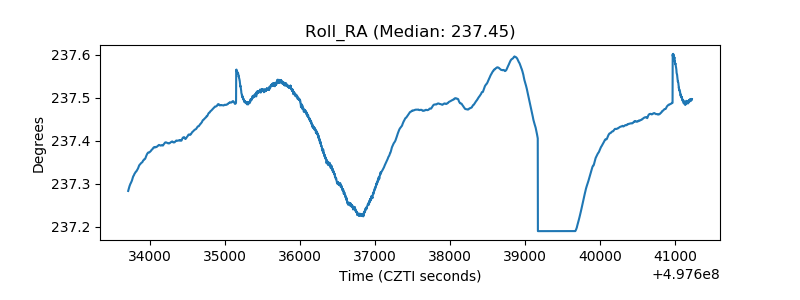 |
| Veto Counter | 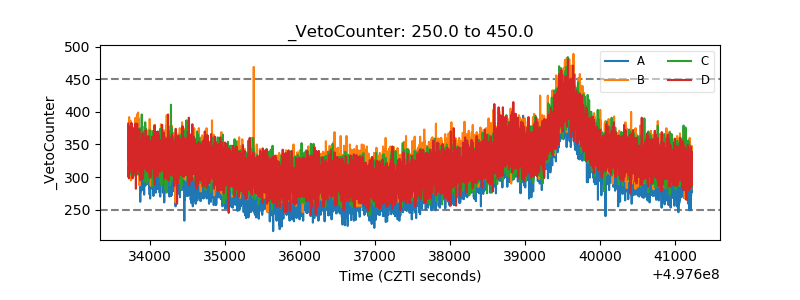 |