| Param | Original file | Final file |
|---|---|---|
| Filename | modeM0/AS1C09_004T08_9000006514_54260cztM0_level2.fits | modeM0/AS1C09_004T08_9000006514_54260cztM0_level2_quad_clean.evt |
| Size (bytes) | 695,275,200 | 105,203,520 |
| Size | 663.1 MB | 100.3 MB |
| Events in quadrant A | 4,841,035 | 731,349 |
| Events in quadrant B | 5,304,540 | 792,209 |
| Events in quadrant C | 9,388,869 | 499,921 |
| Events in quadrant D | 5,592,270 | 614,487 |
| Mode M0 | |||
|---|---|---|---|
| Quadrant | BADHDUFLAG | Total packets | Discarded packets |
| A | 0 | 19758 | 0 |
| B | 0 | 21159 | 0 |
| C | 0 | 33462 | 7 |
| D | 0 | 22216 | 0 |
| Mode SS | |||
|---|---|---|---|
| Quadrant | BADHDUFLAG | Total packets | Discarded packets |
| A | 0 | 158 | 0 |
| B | 0 | 158 | 0 |
| C | 0 | 158 | 0 |
| D | 0 | 158 | 0 |
| Quadrant | Total seconds | Saturated seconds | Saturation percentage |
|---|---|---|---|
| A | 7869 | 283 | 3.596391% |
| B | 7870 | 239 | 3.036849% |
| C | 7868 | 2257 | 28.685816% |
| D | 7869 | 568 | 7.218198% |
Noise dominated data is calculated using 1-second bins in cleaned event files. If a bin has >2000 counts, and if more than 50% of those come from <1% of pixels, then it is considered to be noise-dominated and hence unusable.
| Quadrant | # 1 sec bins | Bins with >0 counts | Bins with >2000 counts | High rate bins dominated by noise | Noise dominated (total time) | Noise dominated (detector-on time) | Marked lightcurve |
|---|---|---|---|---|---|---|---|
| A | 7869 | 7869 | 213 | 213 | 2.71% | 2.71% | 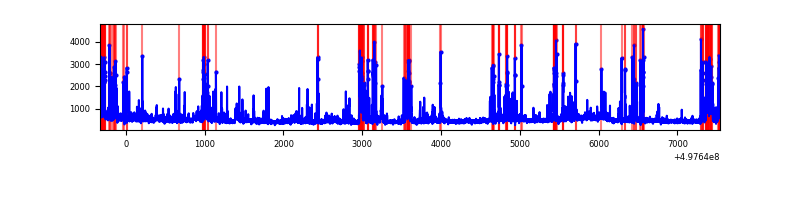 |
| B | 7870 | 7870 | 133 | 133 | 1.69% | 1.69% | 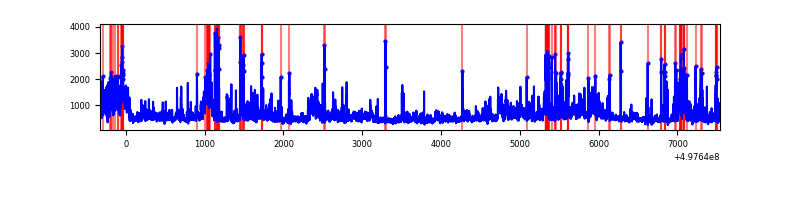 |
| C | 7869 | 7868 | 2191 | 2191 | 27.84% | 27.85% | 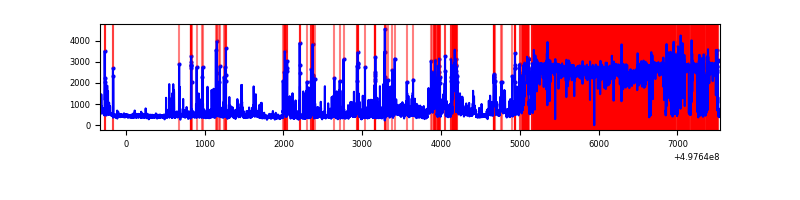 |
| D | 7869 | 7869 | 480 | 480 | 6.10% | 6.10% | 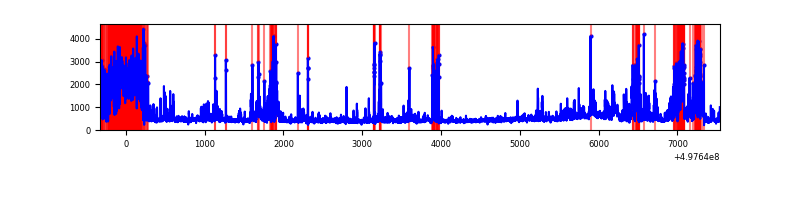 |
Top three noisy pixels from each quadrant. If the there are fewer than three noisy pixels in the level2.evt file, extra rows are filled as -1
| Pixel properties | Quadrant properties | ||||||
|---|---|---|---|---|---|---|---|
| Quadrant | DetID | PixID | Counts | Sigma | Mean | Median | Sigma |
| A | 7 | 29 | 781255 | 3857.73 | 821 | 802 | 202.3 |
| A | 3 | 110 | 129823 | 637.74 | 821 | 802 | 202.3 |
| A | 12 | 17 | 129174 | 634.54 | 821 | 802 | 202.3 |
| B | 7 | 0 | 856716 | 4972.02 | 814 | 786 | 172.1 |
| B | 0 | 213 | 383158 | 2221.17 | 814 | 786 | 172.1 |
| B | 5 | 236 | 304471 | 1764.08 | 814 | 786 | 172.1 |
| C | 1 | 241 | 5109036 | 27529.64 | 673 | 667 | 185.6 |
| C | 1 | 29 | 796671 | 4289.77 | 673 | 667 | 185.6 |
| C | 14 | 254 | 452778 | 2436.48 | 673 | 667 | 185.6 |
| D | 8 | 176 | 1033394 | 4661.81 | 784 | 750 | 221.5 |
| D | 13 | 170 | 464390 | 2093.07 | 784 | 750 | 221.5 |
| D | 15 | 159 | 279706 | 1259.33 | 784 | 750 | 221.5 |
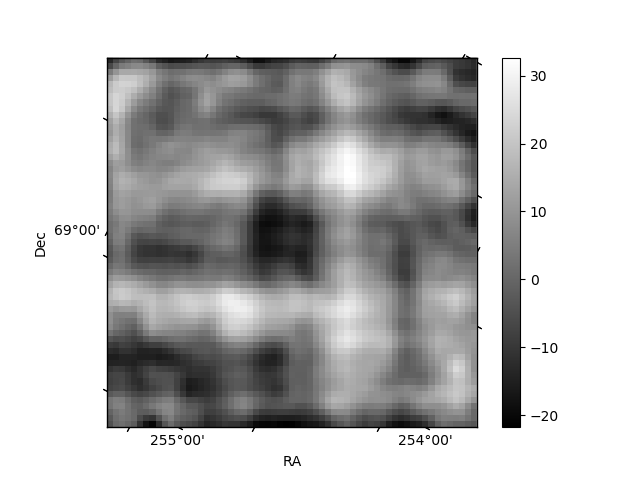
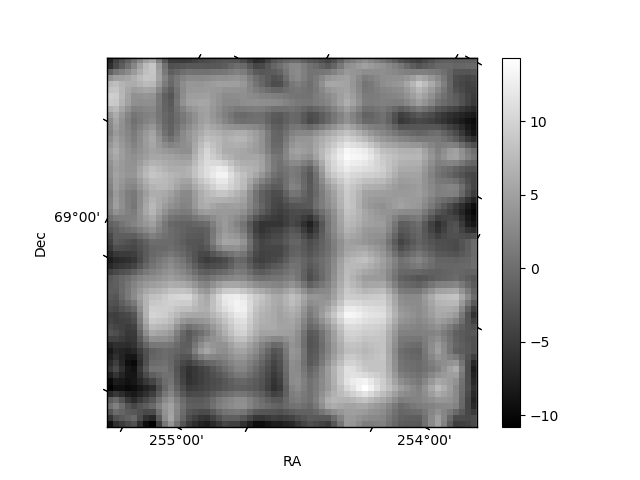
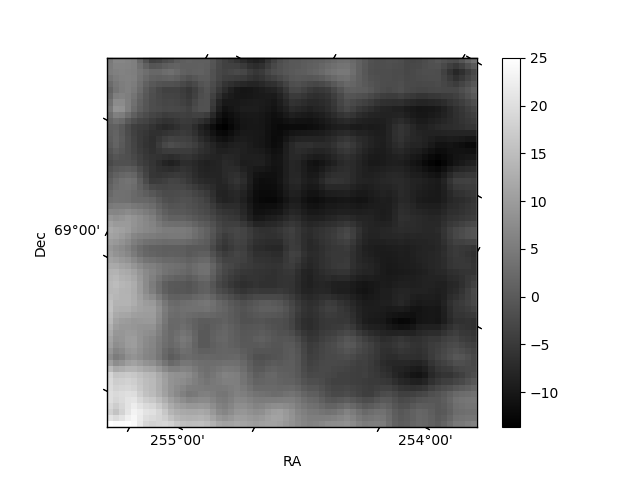
Histogram calculated using DETX and DETY for each event in the final _common_clean file
| Quadrant A | 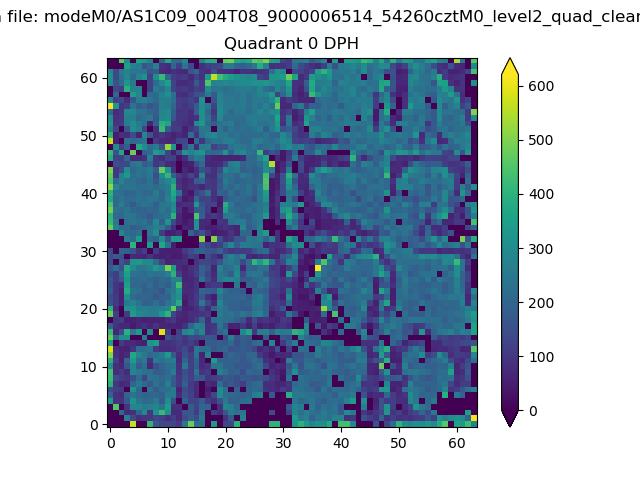 |
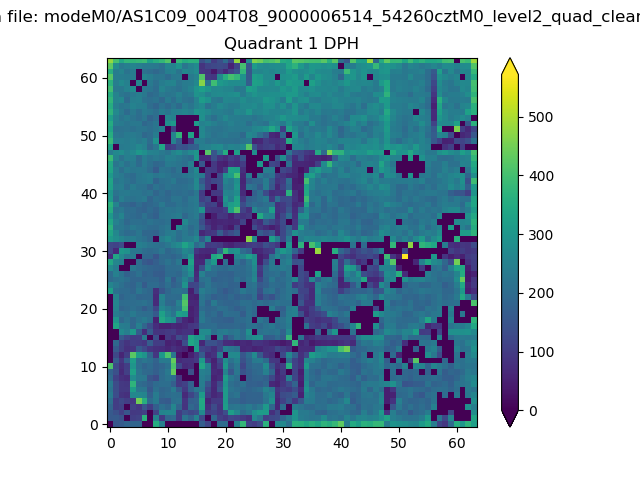 |
Quadrant B |
|---|---|---|---|
| Quadrant D | 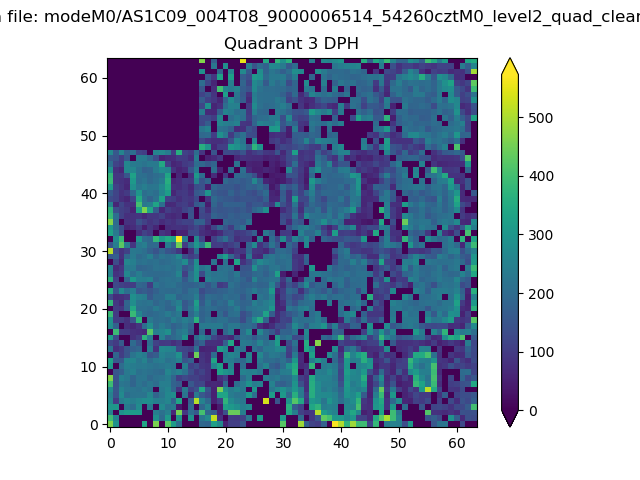 |
 |
Quadrant C |
| Plot type | Count rate plots | Images |
|---|---|---|
| Comparison with Poisson distribution Blue bars denote a histogram of data divided into 1 sec bins. Red curve is a Poisson curve with rate = median count rate of data. |
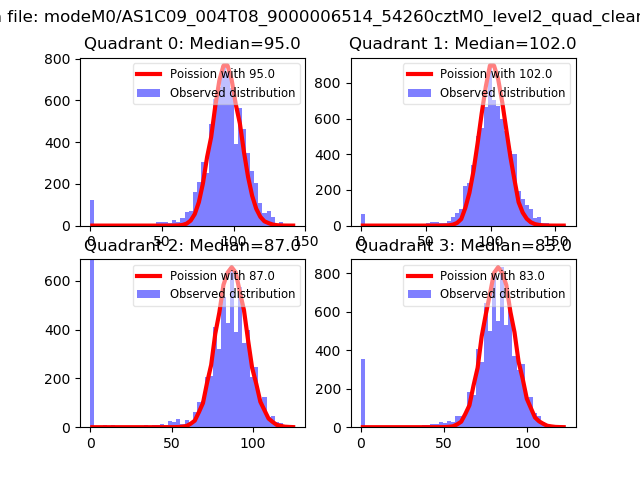 |
 |
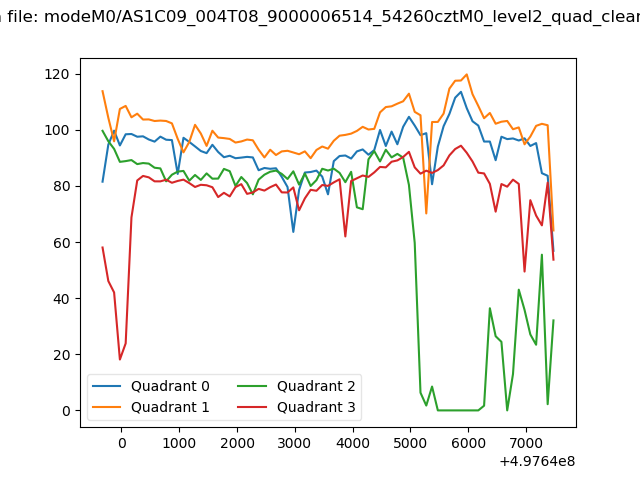
| Quadrant-wise count rates Data is divided into 100 sec bins |
 |
|
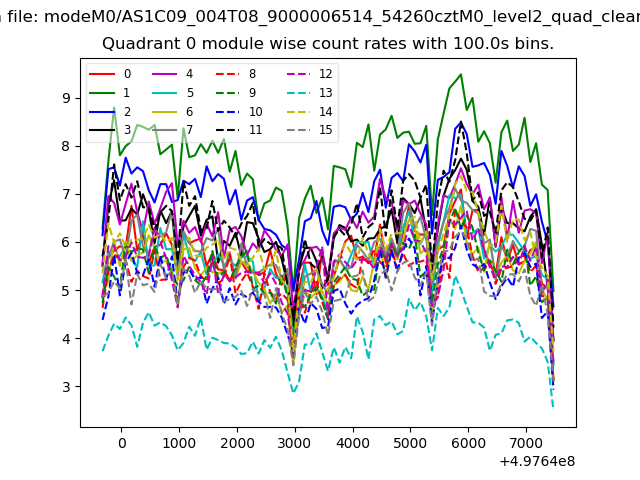
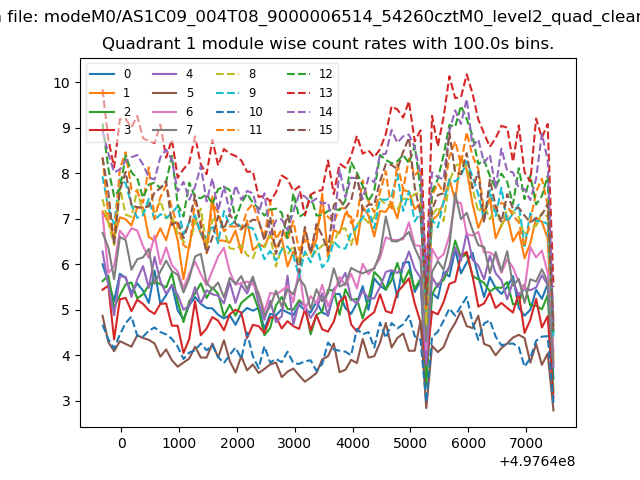
| Module-wise count rates for Quadrant A Data is divided into 100 sec bins |
 |
 |
| Module-wise count rates for Quadrant B Data is divided into 100 sec bins |
 |
 |
| Module-wise count rates for Quadrant C Data is divided into 100 sec bins |
 |
 |
| Module-wise count rates for Quadrant D Data is divided into 100 sec bins |
 |
 |
| Parameter | Plot |
|---|---|
| CZT HV Monitor | 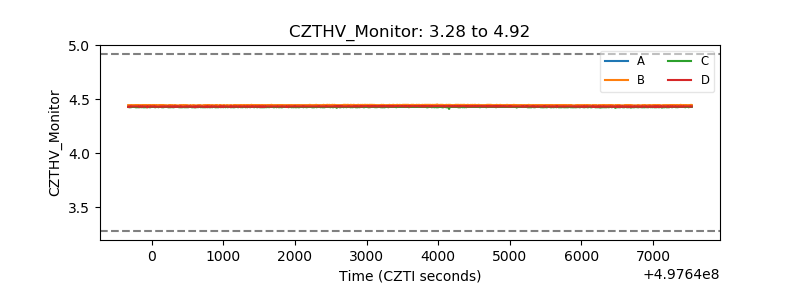 |
| D_VDD | 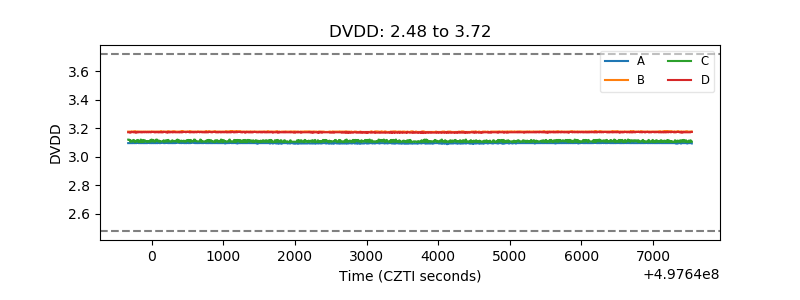 |
| Temperature 1 | 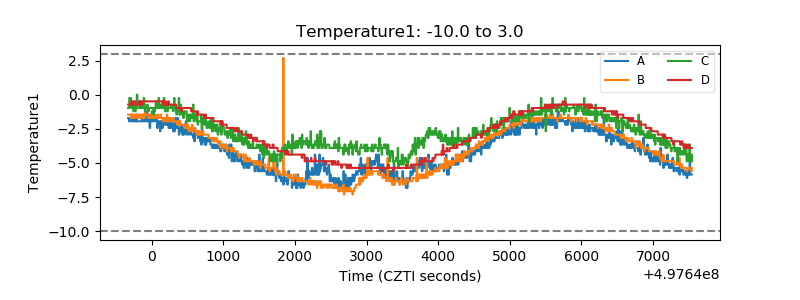 |
| Veto HV Monitor | 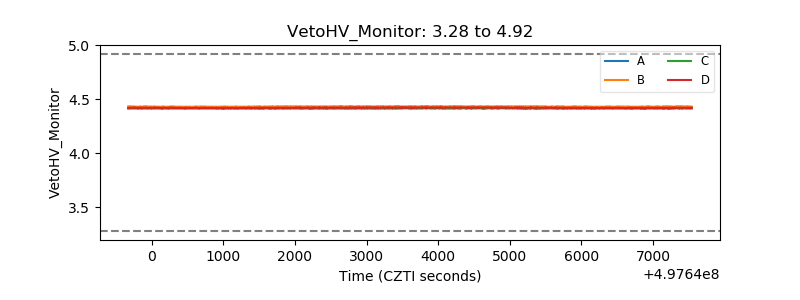 |
| Veto LLD | 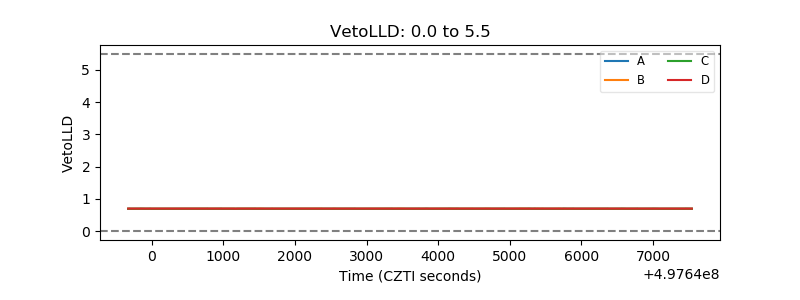 |
| Alpha Counter | 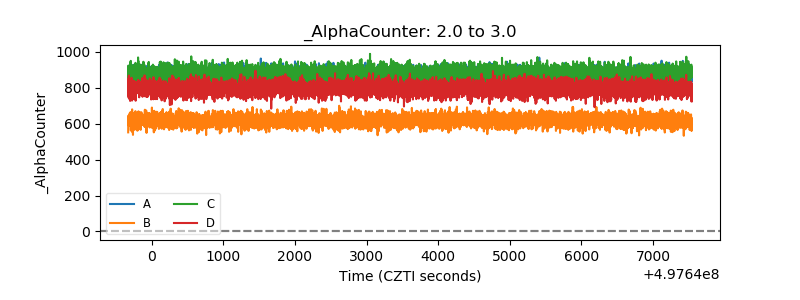 |
| _CPM_Rate | 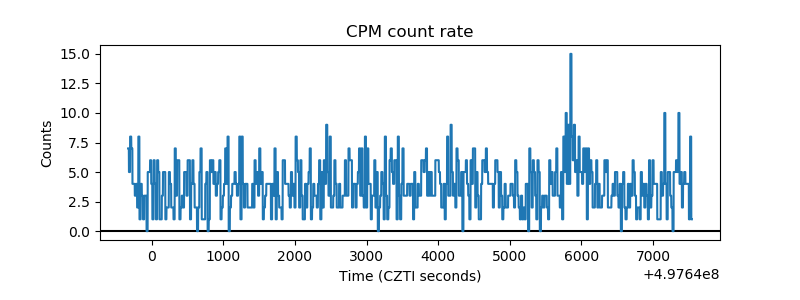 |
| CZT Counter | 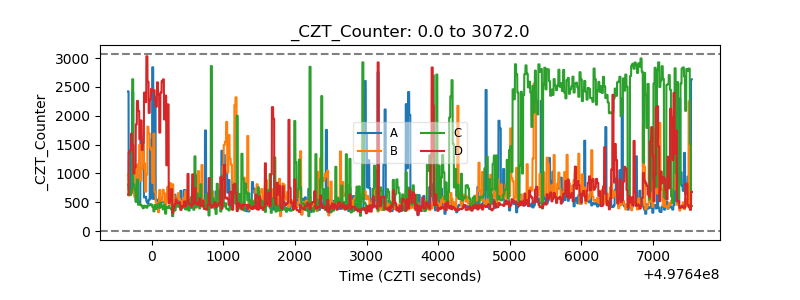 |
| +2.5 Volts monitor |  |
| +5 Volts monitor | 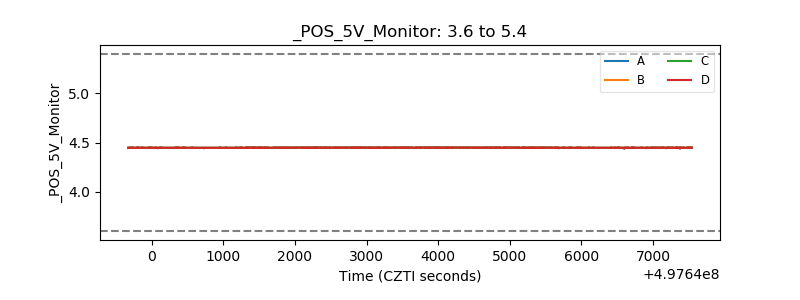 |
| _ROLL_ROT | 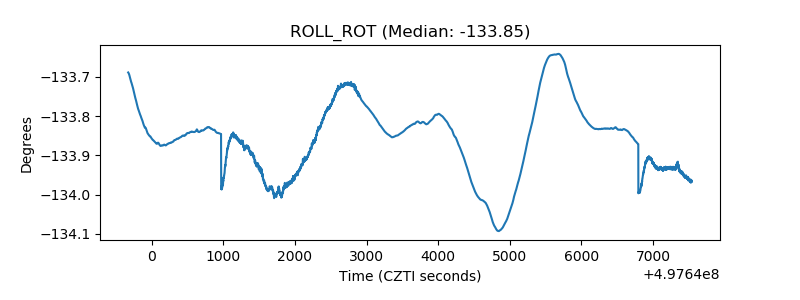 |
| _Roll_DEC | 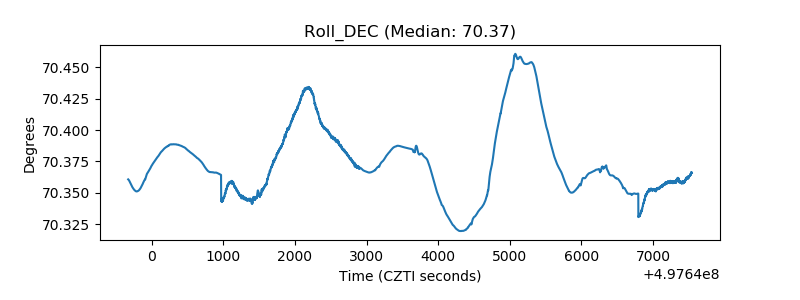 |
| _Roll_RA | 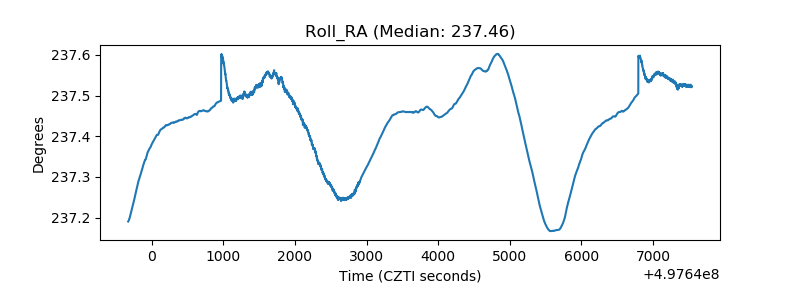 |
| Veto Counter | 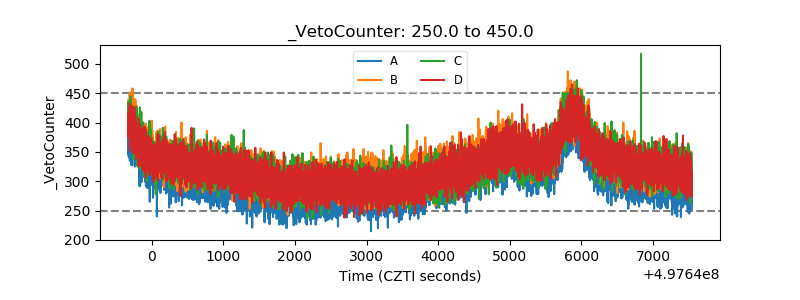 |