| Param | Original file | Final file |
|---|---|---|
| Filename | modeM0/AS1C09_004T08_9000006514_54263cztM0_level2.fits | modeM0/AS1C09_004T08_9000006514_54263cztM0_level2_quad_clean.evt |
| Size (bytes) | 1,827,351,360 | 248,126,400 |
| Size | 1.7 GB | 236.6 MB |
| Events in quadrant A | 13,056,140 | 1,720,277 |
| Events in quadrant B | 16,633,254 | 1,732,984 |
| Events in quadrant C | 22,795,360 | 1,239,703 |
| Events in quadrant D | 13,650,545 | 1,474,799 |
| Mode M0 | |||
|---|---|---|---|
| Quadrant | BADHDUFLAG | Total packets | Discarded packets |
| A | 0 | 52836 | 2 |
| B | 0 | 62947 | 2 |
| C | 0 | 81478 | 2 |
| D | 0 | 54586 | 7 |
| Mode M9 | |||
|---|---|---|---|
| Quadrant | BADHDUFLAG | Total packets | Discarded packets |
| A | 0 | 10 | 0 |
| B | 0 | 10 | 0 |
| C | 0 | 10 | 0 |
| D | 0 | 10 | 0 |
| Mode SS | |||
|---|---|---|---|
| Quadrant | BADHDUFLAG | Total packets | Discarded packets |
| A | 0 | 394 | 0 |
| B | 0 | 394 | 0 |
| C | 0 | 394 | 0 |
| D | 0 | 394 | 0 |
| Quadrant | Total seconds | Saturated seconds | Saturation percentage |
|---|---|---|---|
| A | 19510 | 1017 | 5.212711% |
| B | 19511 | 2337 | 11.977859% |
| C | 19511 | 5173 | 26.513249% |
| D | 19510 | 1447 | 7.416709% |
Noise dominated data is calculated using 1-second bins in cleaned event files. If a bin has >2000 counts, and if more than 50% of those come from <1% of pixels, then it is considered to be noise-dominated and hence unusable.
| Quadrant | # 1 sec bins | Bins with >0 counts | Bins with >2000 counts | High rate bins dominated by noise | Noise dominated (total time) | Noise dominated (detector-on time) | Marked lightcurve |
|---|---|---|---|---|---|---|---|
| A | 20520 | 19512 | 872 | 872 | 4.25% | 4.47% | 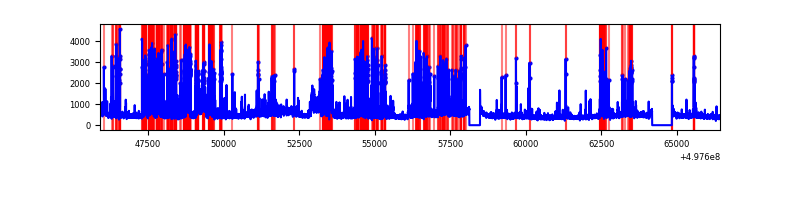 |
| B | 20521 | 19513 | 1792 | 1792 | 8.73% | 9.18% | 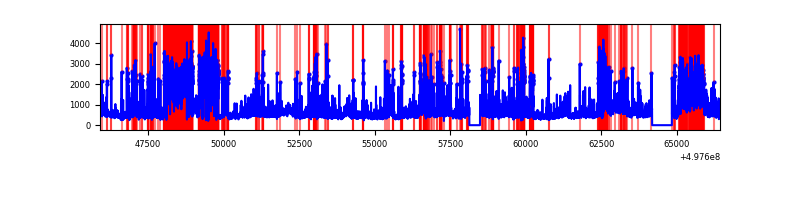 |
| C | 20521 | 19513 | 4801 | 4801 | 23.40% | 24.60% | 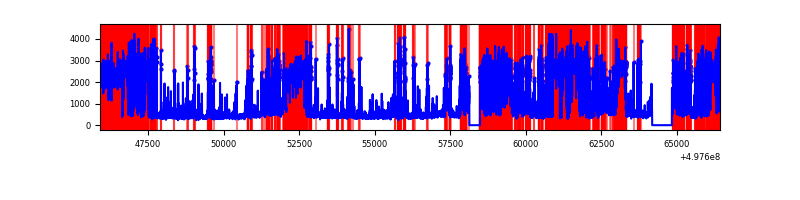 |
| D | 20519 | 19511 | 1354 | 1354 | 6.60% | 6.94% | 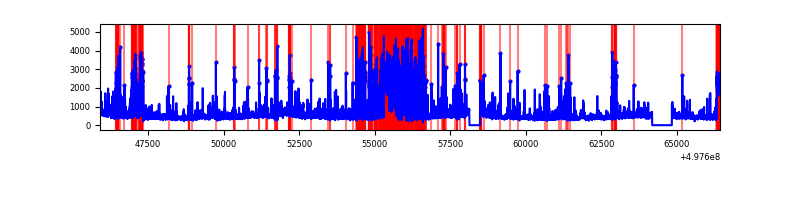 |
Top three noisy pixels from each quadrant. If the there are fewer than three noisy pixels in the level2.evt file, extra rows are filled as -1
| Pixel properties | Quadrant properties | ||||||
|---|---|---|---|---|---|---|---|
| Quadrant | DetID | PixID | Counts | Sigma | Mean | Median | Sigma |
| A | 7 | 29 | 2096249 | 4189.32 | 2025 | 1972 | 499.9 |
| A | 15 | 174 | 736642 | 1469.61 | 2025 | 1972 | 499.9 |
| A | 12 | 17 | 725665 | 1447.65 | 2025 | 1972 | 499.9 |
| B | 5 | 250 | 3071245 | 7337.93 | 1976 | 1905 | 418.3 |
| B | 5 | 236 | 1614970 | 3856.38 | 1976 | 1905 | 418.3 |
| B | 5 | 185 | 1607099 | 3837.57 | 1976 | 1905 | 418.3 |
| C | 1 | 241 | 9176838 | 19426.38 | 1729 | 1713 | 472.3 |
| C | 1 | 29 | 4474615 | 9470.42 | 1729 | 1713 | 472.3 |
| C | 12 | 252 | 876925 | 1853.08 | 1729 | 1713 | 472.3 |
| D | 8 | 176 | 3966627 | 7214.72 | 1927 | 1835 | 549.5 |
| D | 13 | 170 | 501493 | 909.23 | 1927 | 1835 | 549.5 |
| D | 15 | 159 | 470730 | 853.25 | 1927 | 1835 | 549.5 |
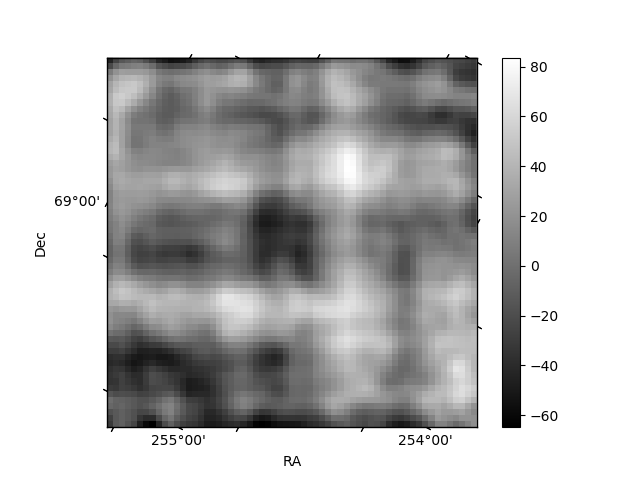
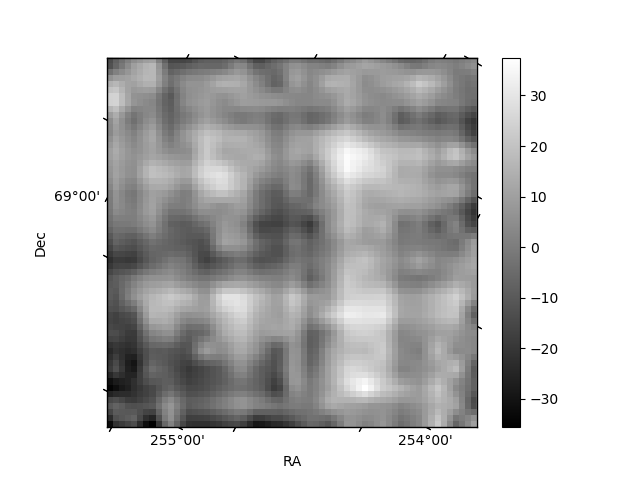
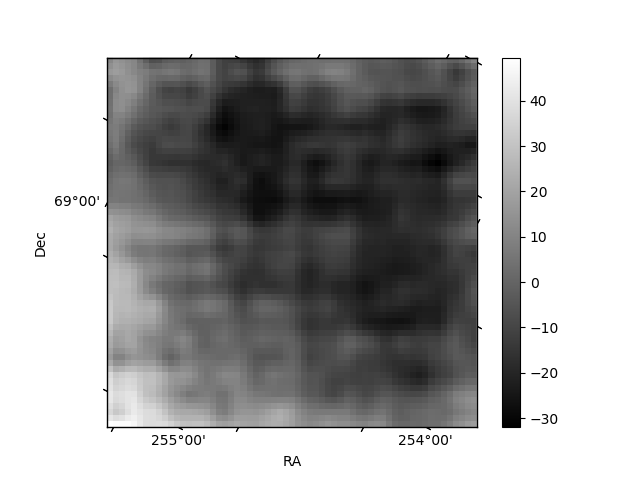
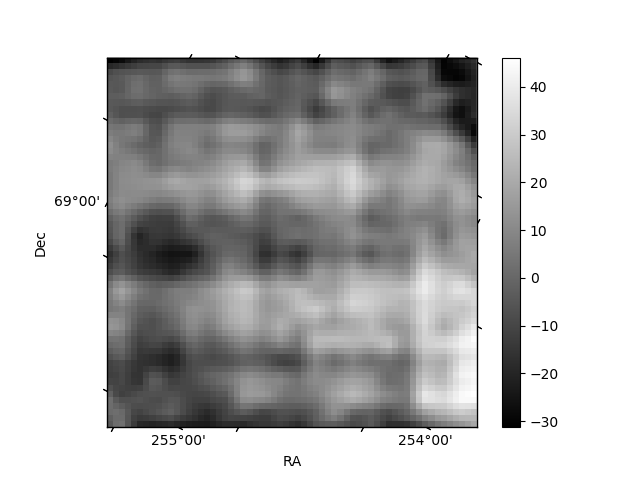
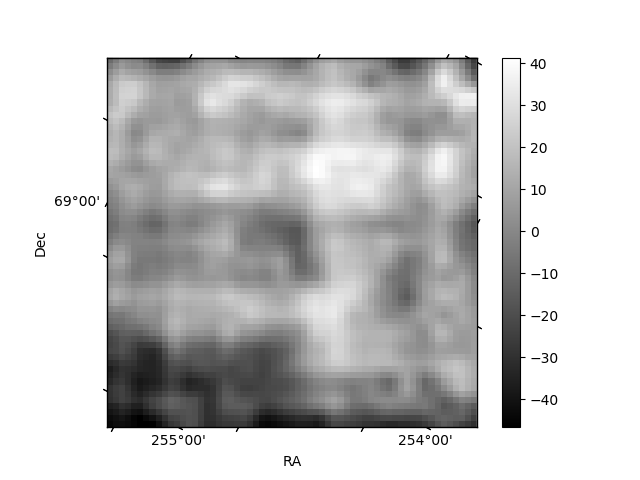
Histogram calculated using DETX and DETY for each event in the final _common_clean file
| Quadrant A | 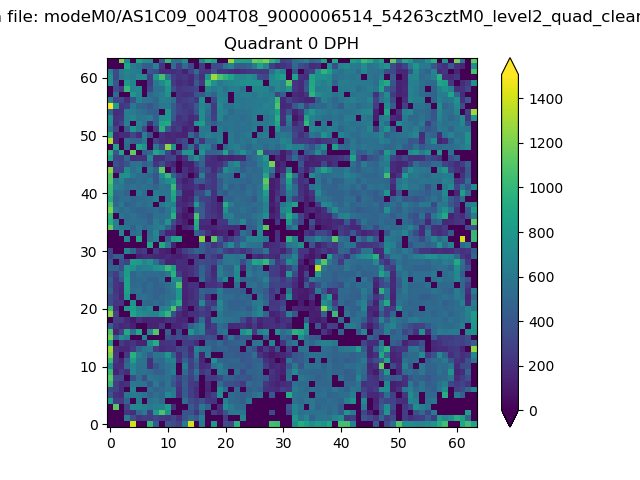 |
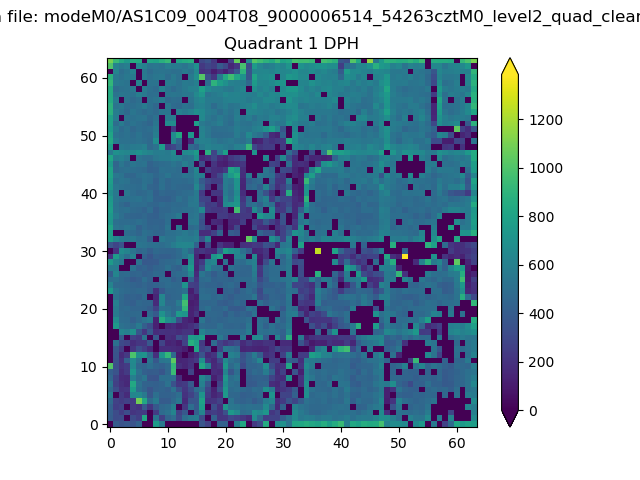 |
Quadrant B |
|---|---|---|---|
| Quadrant D | 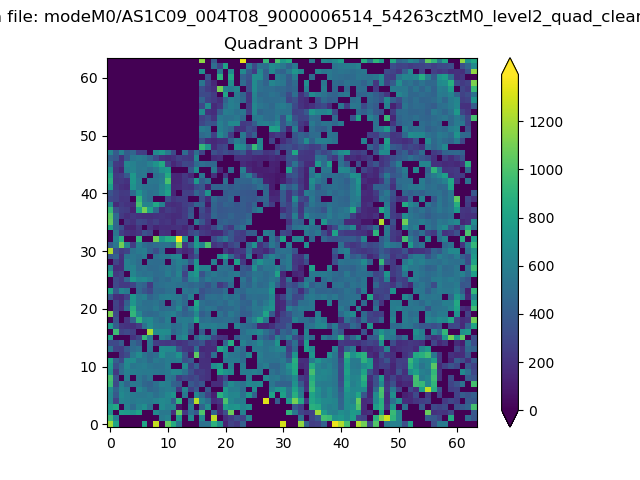 |
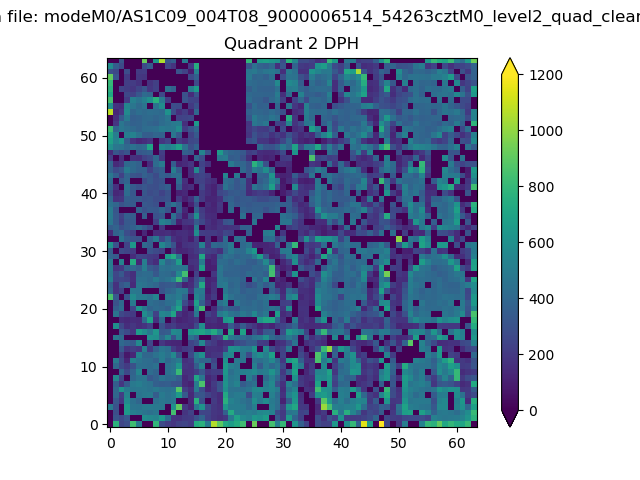 |
Quadrant C |
| Plot type | Count rate plots | Images |
|---|---|---|
| Comparison with Poisson distribution Blue bars denote a histogram of data divided into 1 sec bins. Red curve is a Poisson curve with rate = median count rate of data. |
 |
 |
| Quadrant-wise count rates Data is divided into 100 sec bins |
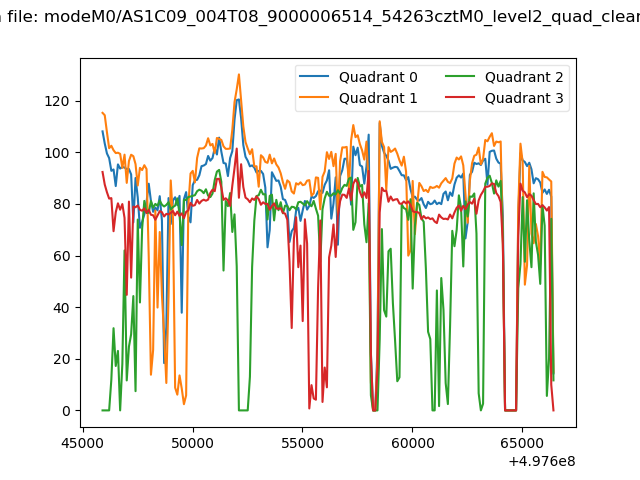 |
|
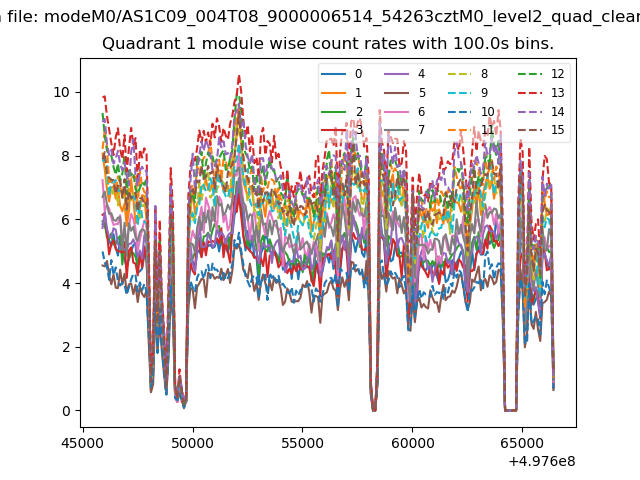
| Module-wise count rates for Quadrant A Data is divided into 100 sec bins |
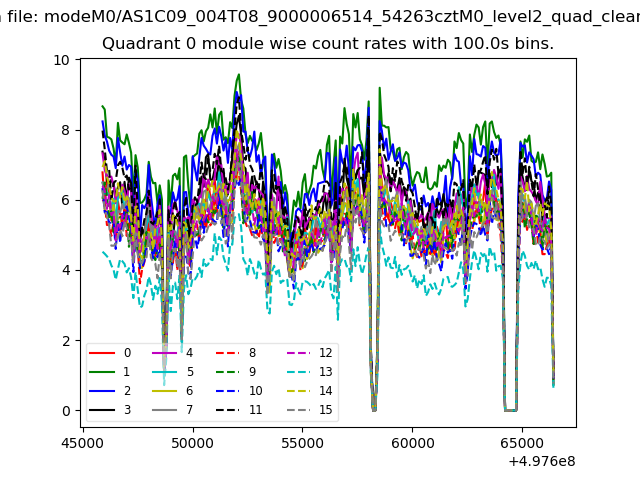 |
 |
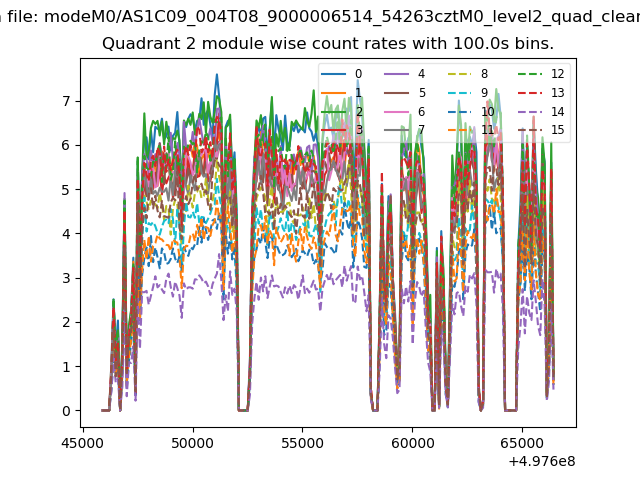
| Module-wise count rates for Quadrant B Data is divided into 100 sec bins |
 |
 |
| Module-wise count rates for Quadrant C Data is divided into 100 sec bins |
 |
 |
| Module-wise count rates for Quadrant D Data is divided into 100 sec bins |
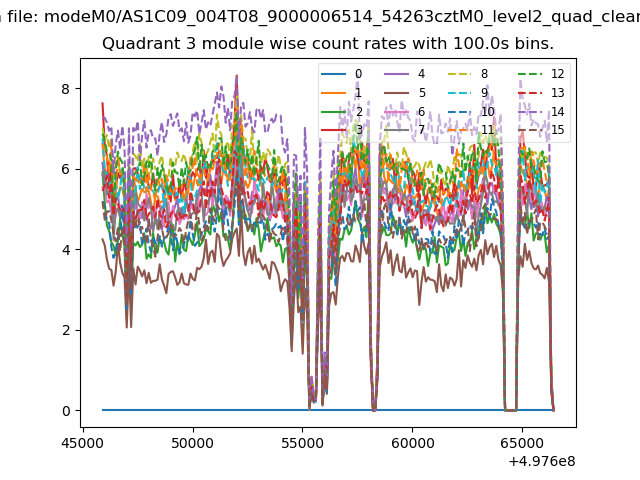 |
 |
| Parameter | Plot |
|---|---|
| CZT HV Monitor | 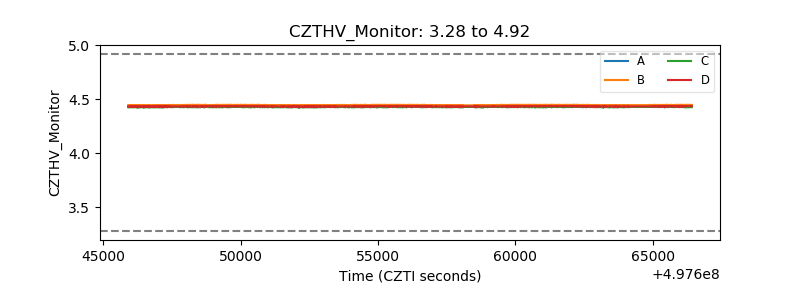 |
| D_VDD | 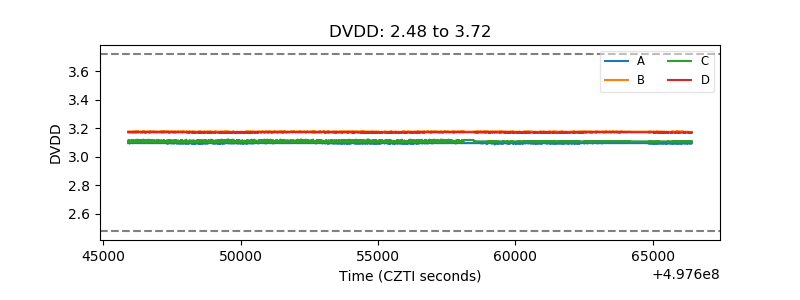 |
| Temperature 1 | 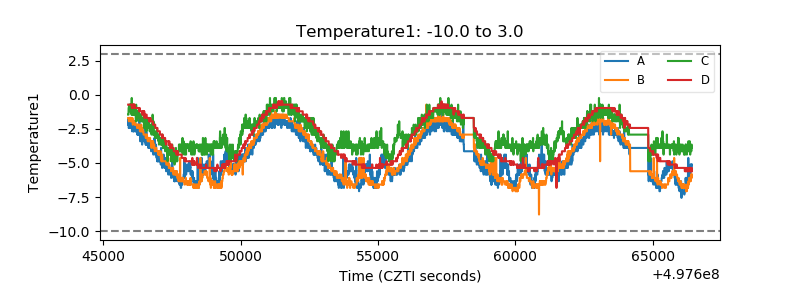 |
| Veto HV Monitor | 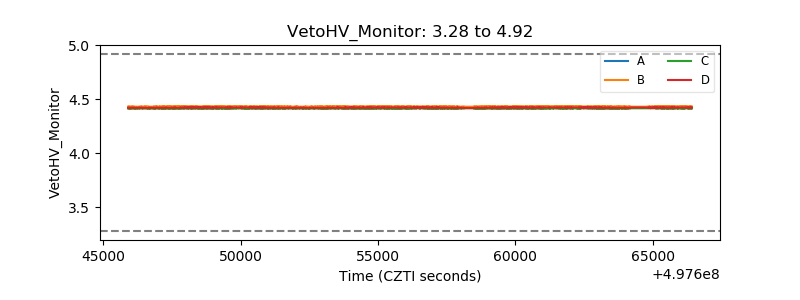 |
| Veto LLD | 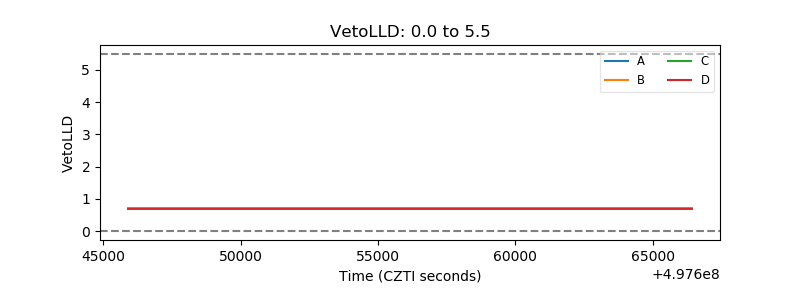 |
| Alpha Counter | 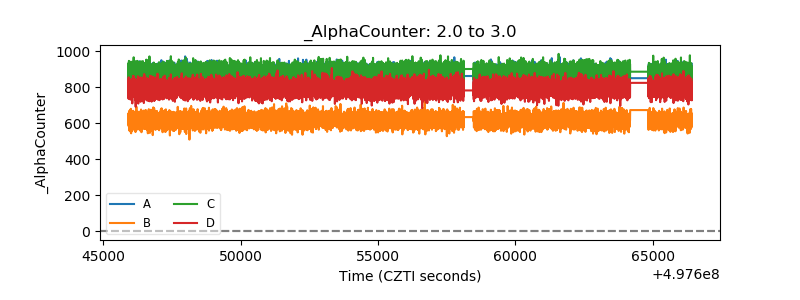 |
| _CPM_Rate | 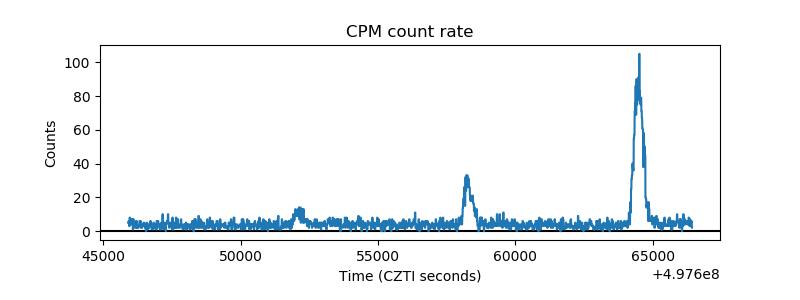 |
| CZT Counter | 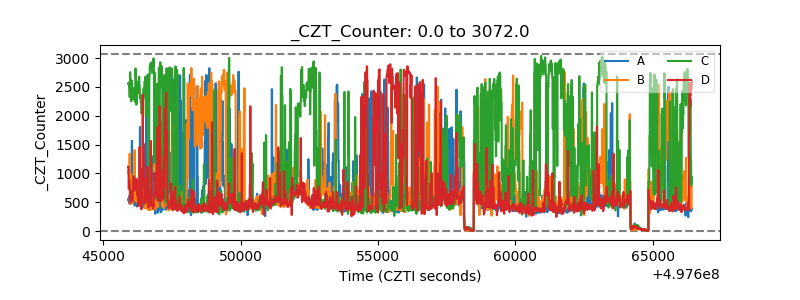 |
| +2.5 Volts monitor |  |
| +5 Volts monitor |  |
| _ROLL_ROT | 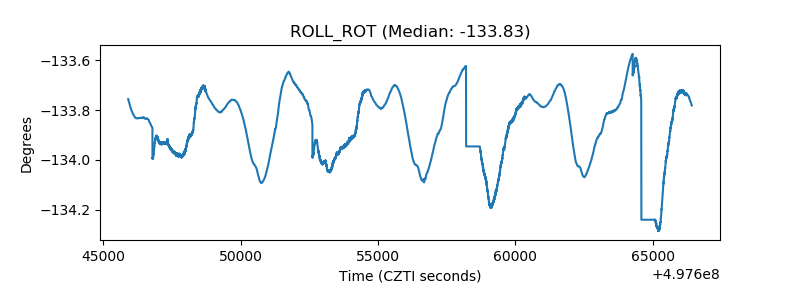 |
| _Roll_DEC | 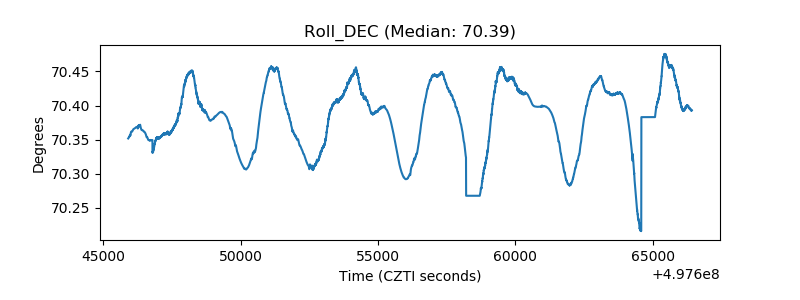 |
| _Roll_RA | 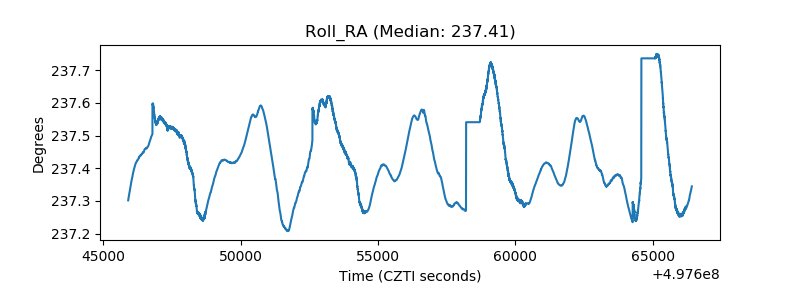 |
| Veto Counter | 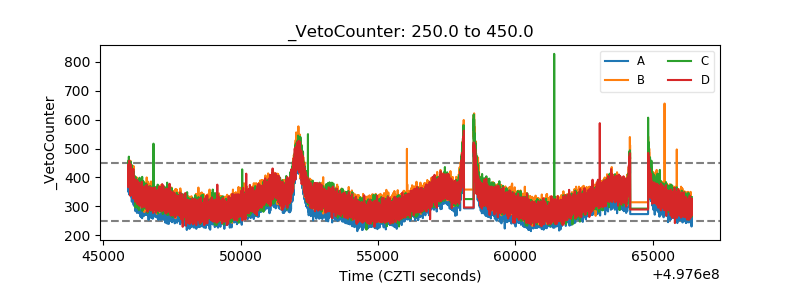 |