| Param | Original file | Final file |
|---|---|---|
| Filename | modeM0/AS1C09_004T08_9000006514_54264cztM0_level2.fits | modeM0/AS1C09_004T08_9000006514_54264cztM0_level2_quad_clean.evt |
| Size (bytes) | 760,576,320 | 81,250,560 |
| Size | 725.3 MB | 77.5 MB |
| Events in quadrant A | 4,818,986 | 565,126 |
| Events in quadrant B | 5,468,059 | 628,830 |
| Events in quadrant C | 7,010,675 | 497,462 |
| Events in quadrant D | 10,335,171 | 300,106 |
| Mode M0 | |||
|---|---|---|---|
| Quadrant | BADHDUFLAG | Total packets | Discarded packets |
| A | 0 | 19314 | 1 |
| B | 0 | 20924 | 2 |
| C | 0 | 25542 | 1 |
| D | 0 | 35336 | 1 |
| Mode M9 | |||
|---|---|---|---|
| Quadrant | BADHDUFLAG | Total packets | Discarded packets |
| A | 0 | 9 | 0 |
| B | 0 | 9 | 0 |
| C | 0 | 9 | 0 |
| D | 0 | 9 | 0 |
| Mode SS | |||
|---|---|---|---|
| Quadrant | BADHDUFLAG | Total packets | Discarded packets |
| A | 0 | 136 | 0 |
| B | 0 | 136 | 0 |
| C | 0 | 136 | 0 |
| D | 0 | 136 | 0 |
| Quadrant | Total seconds | Saturated seconds | Saturation percentage |
|---|---|---|---|
| A | 6717 | 664 | 9.885365% |
| B | 6716 | 554 | 8.248958% |
| C | 6716 | 1220 | 18.165575% |
| D | 6716 | 3343 | 49.776653% |
Noise dominated data is calculated using 1-second bins in cleaned event files. If a bin has >2000 counts, and if more than 50% of those come from <1% of pixels, then it is considered to be noise-dominated and hence unusable.
| Quadrant | # 1 sec bins | Bins with >0 counts | Bins with >2000 counts | High rate bins dominated by noise | Noise dominated (total time) | Noise dominated (detector-on time) | Marked lightcurve |
|---|---|---|---|---|---|---|---|
| A | 7537 | 6717 | 567 | 567 | 7.52% | 8.44% | 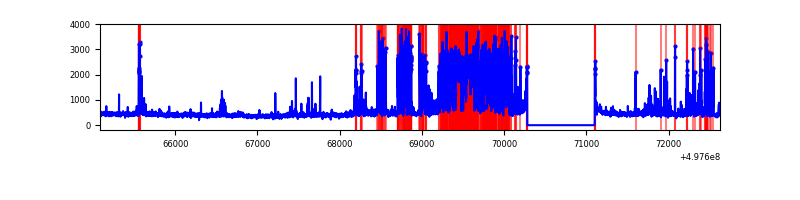 |
| B | 7536 | 6717 | 336 | 336 | 4.46% | 5.00% | 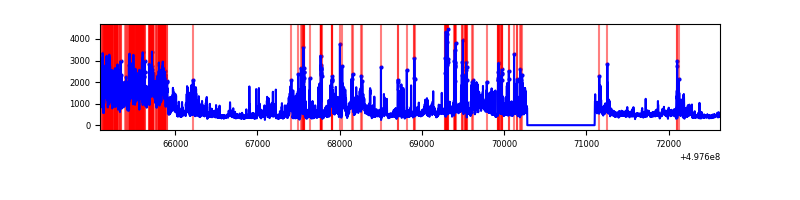 |
| C | 7536 | 6717 | 1169 | 1169 | 15.51% | 17.40% | 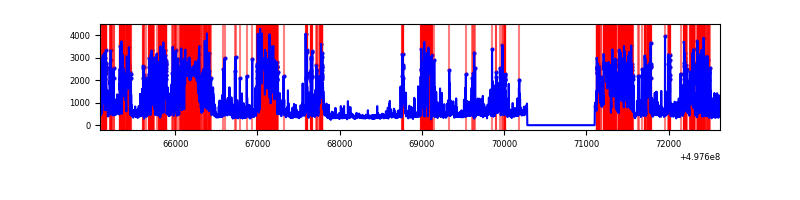 |
| D | 7535 | 6716 | 2840 | 2840 | 37.69% | 42.29% | 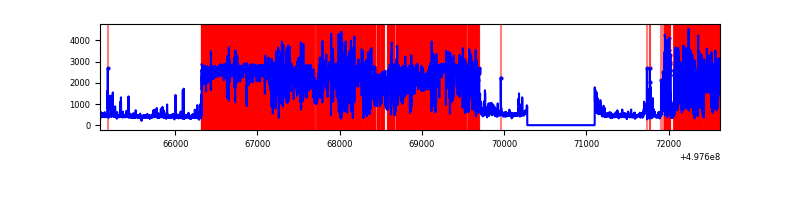 |
Top three noisy pixels from each quadrant. If the there are fewer than three noisy pixels in the level2.evt file, extra rows are filled as -1
| Pixel properties | Quadrant properties | ||||||
|---|---|---|---|---|---|---|---|
| Quadrant | DetID | PixID | Counts | Sigma | Mean | Median | Sigma |
| A | 7 | 29 | 1800694 | 11025.26 | 660 | 645 | 163.3 |
| A | 0 | 8 | 198756 | 1213.43 | 660 | 645 | 163.3 |
| A | 15 | 174 | 97017 | 590.28 | 660 | 645 | 163.3 |
| B | 5 | 185 | 1567110 | 10843.9 | 677 | 653 | 144.5 |
| B | 0 | 213 | 339692 | 2347.02 | 677 | 653 | 144.5 |
| B | 5 | 236 | 294795 | 2036.22 | 677 | 653 | 144.5 |
| C | 1 | 29 | 3011700 | 17611.61 | 618 | 610 | 171.0 |
| C | 1 | 241 | 603547 | 3526.53 | 618 | 610 | 171.0 |
| C | 15 | 215 | 419156 | 2448.04 | 618 | 610 | 171.0 |
| D | 8 | 176 | 8212962 | 64417.13 | 443 | 422 | 127.5 |
| D | 10 | 181 | 163415 | 1278.48 | 443 | 422 | 127.5 |
| D | 3 | 144 | 87537 | 683.31 | 443 | 422 | 127.5 |
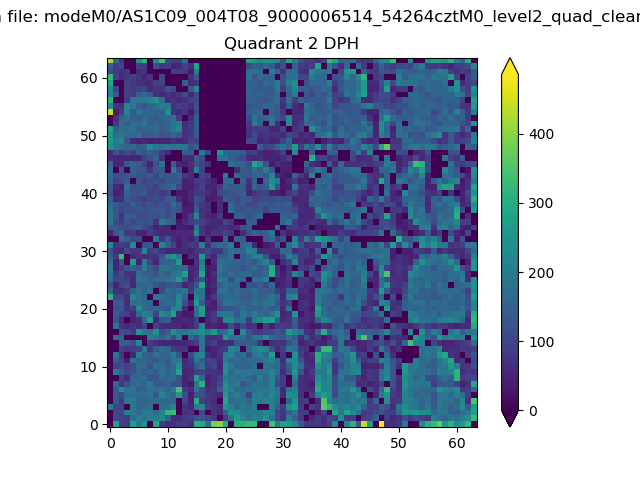
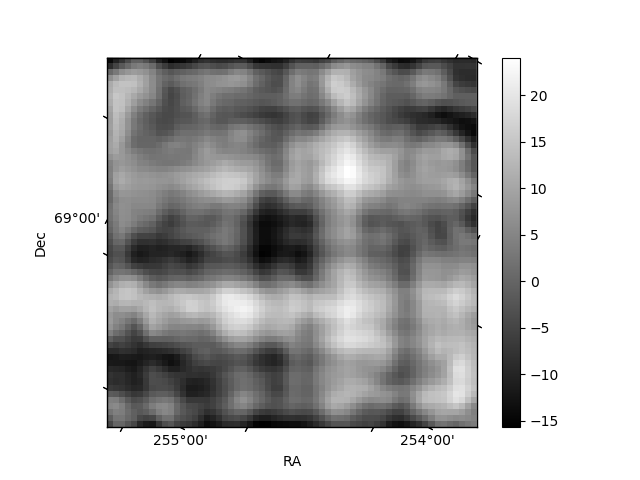
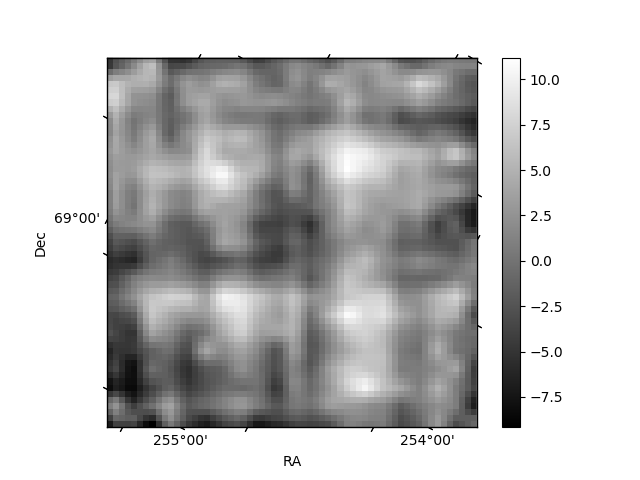
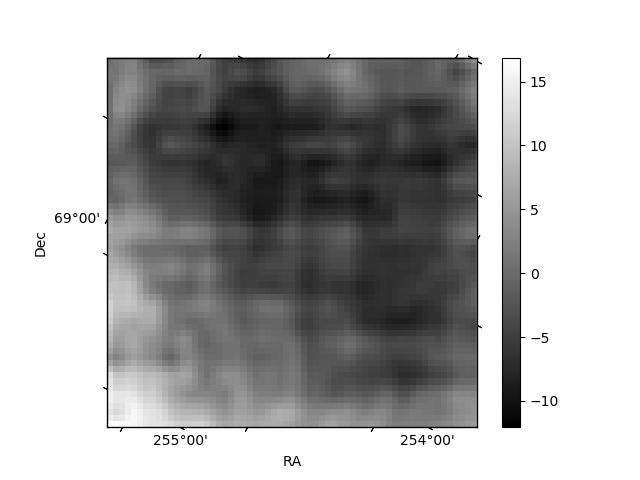
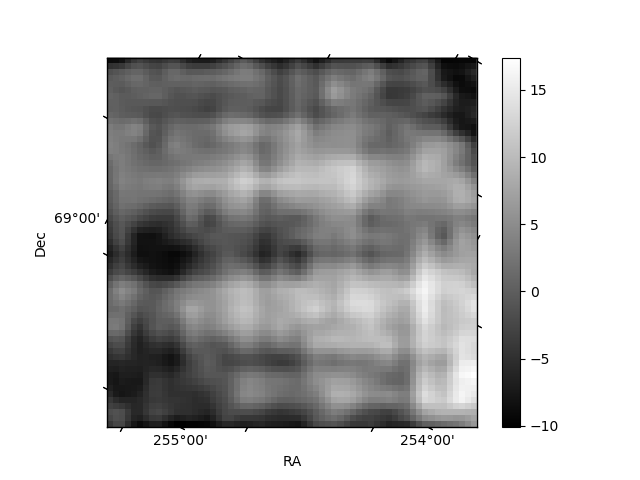
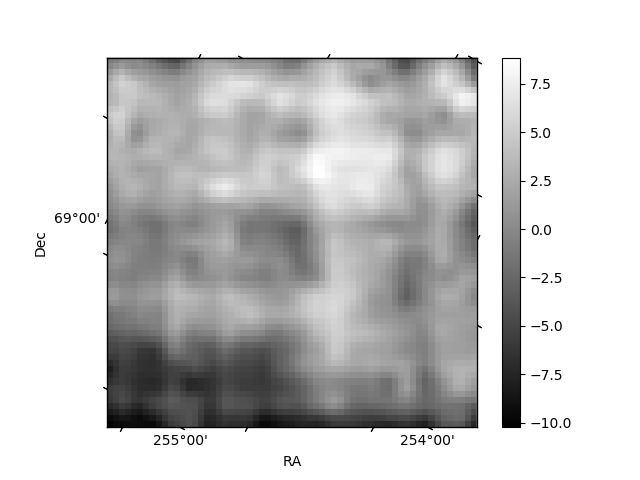
Histogram calculated using DETX and DETY for each event in the final _common_clean file
| Quadrant A | 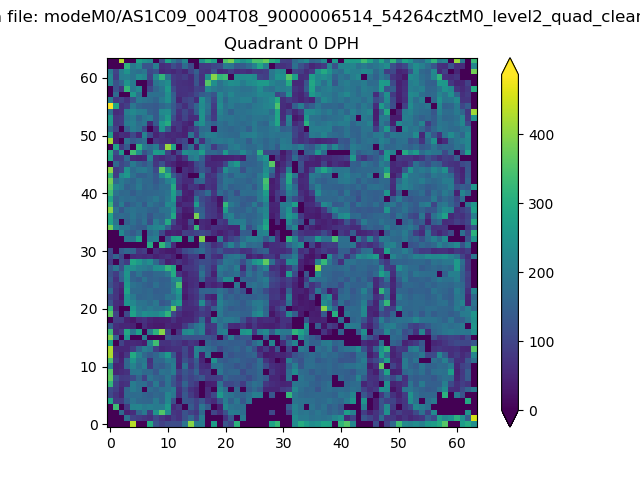 |
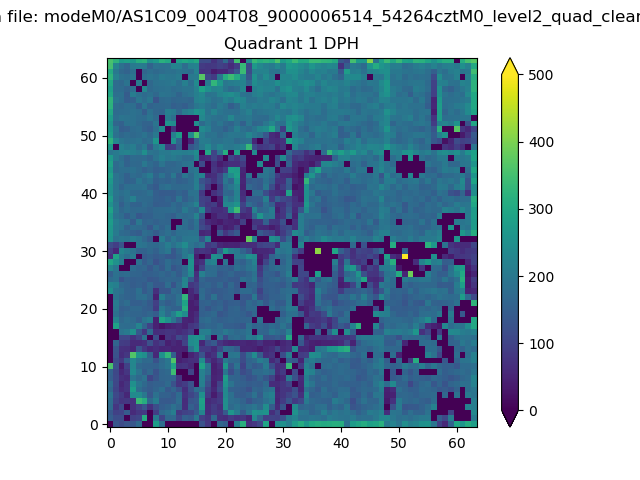 |
Quadrant B |
|---|---|---|---|
| Quadrant D | 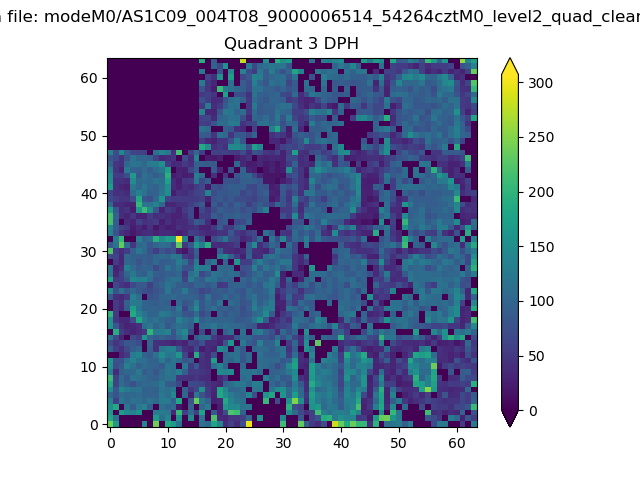 |
 |
Quadrant C |
| Plot type | Count rate plots | Images |
|---|---|---|
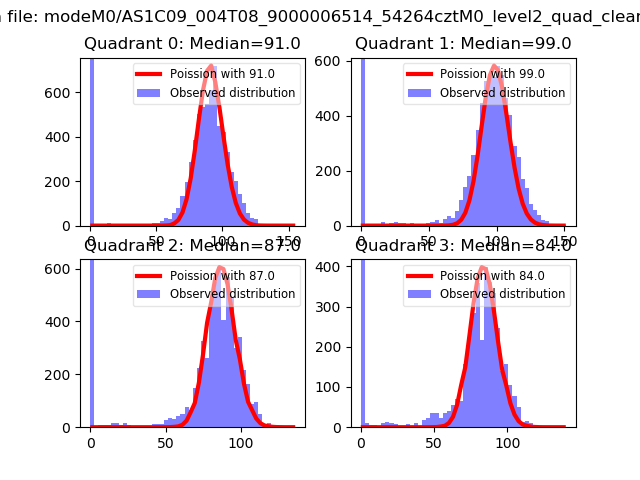
| Comparison with Poisson distribution Blue bars denote a histogram of data divided into 1 sec bins. Red curve is a Poisson curve with rate = median count rate of data. |
 |
 |
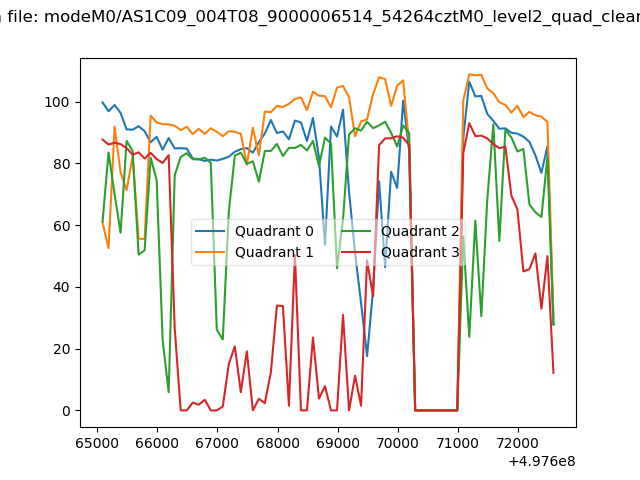
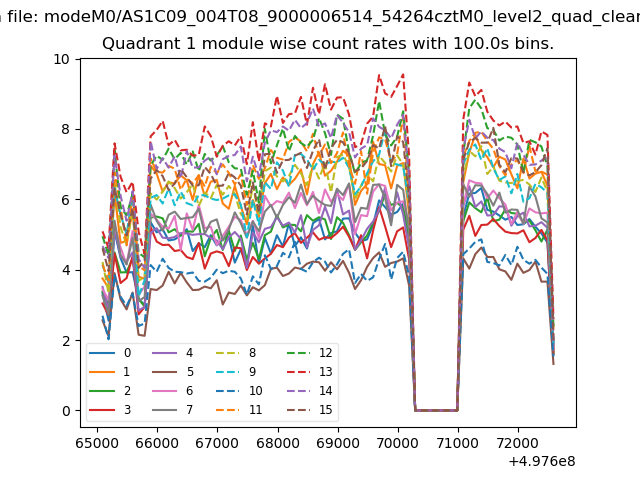
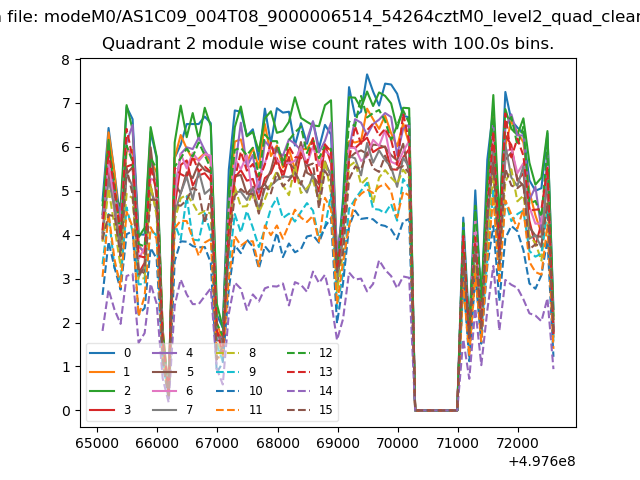
| Quadrant-wise count rates Data is divided into 100 sec bins |
 |
|
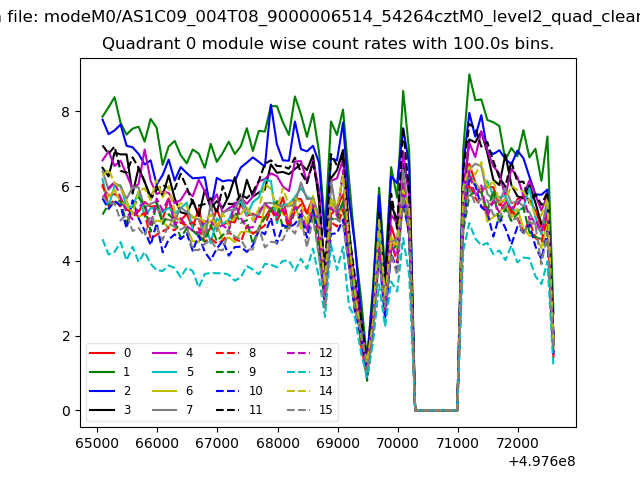
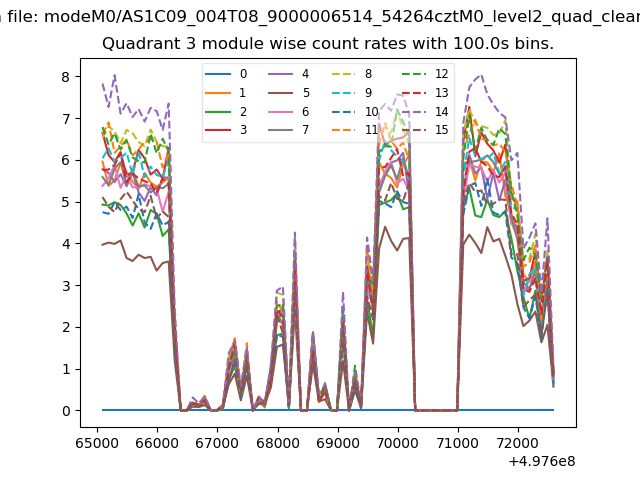
| Module-wise count rates for Quadrant A Data is divided into 100 sec bins |
 |
 |
| Module-wise count rates for Quadrant B Data is divided into 100 sec bins |
 |
 |
| Module-wise count rates for Quadrant C Data is divided into 100 sec bins |
 |
 |
| Module-wise count rates for Quadrant D Data is divided into 100 sec bins |
 |
 |
| Parameter | Plot |
|---|---|
| CZT HV Monitor | 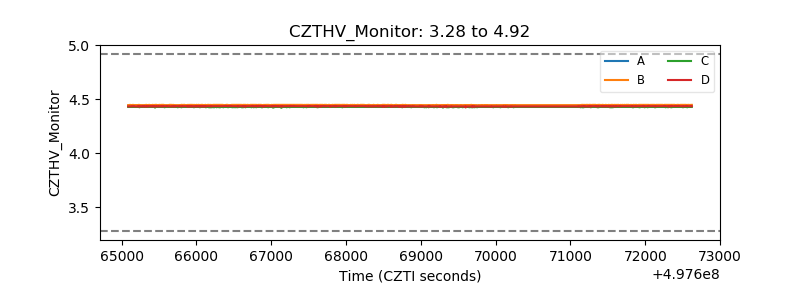 |
| D_VDD | 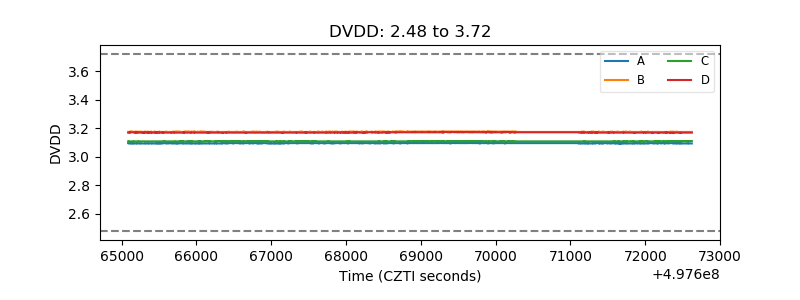 |
| Temperature 1 | 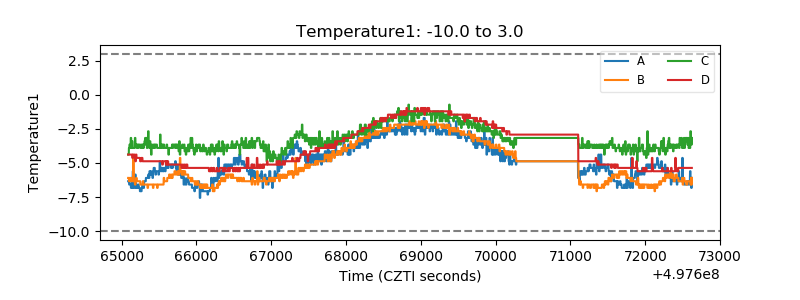 |
| Veto HV Monitor | 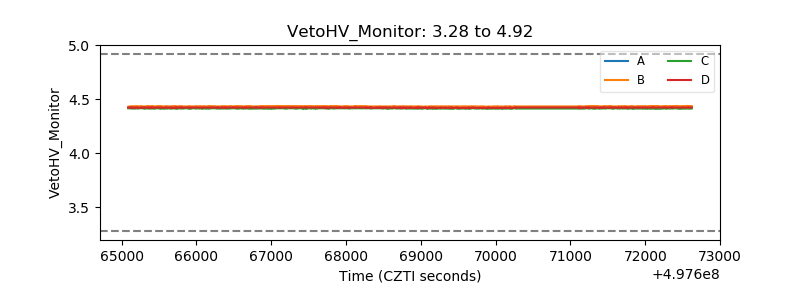 |
| Veto LLD | 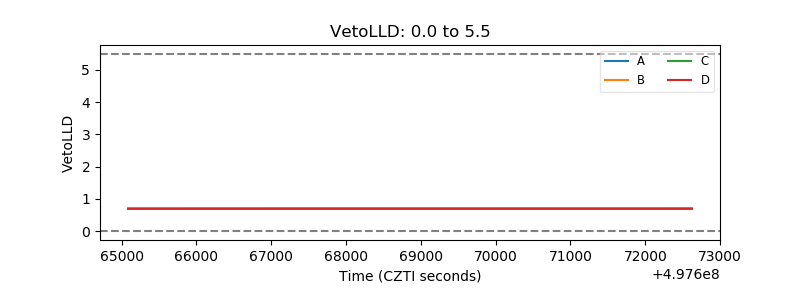 |
| Alpha Counter | 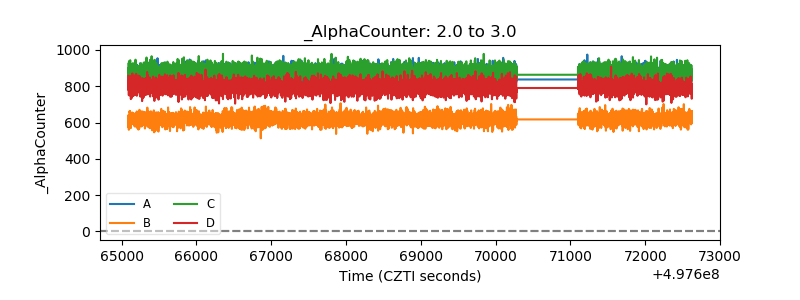 |
| _CPM_Rate | 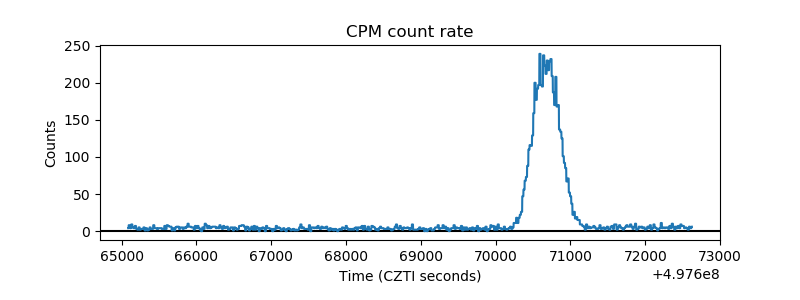 |
| CZT Counter | 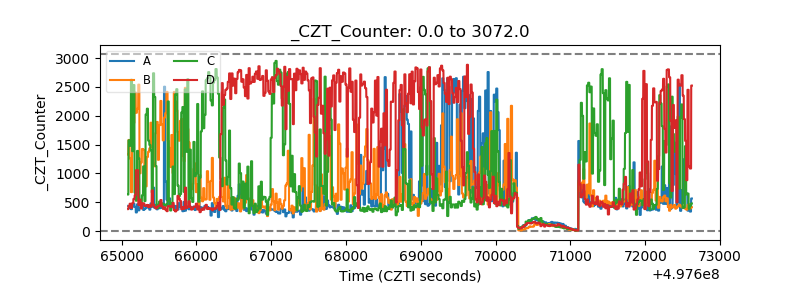 |
| +2.5 Volts monitor | 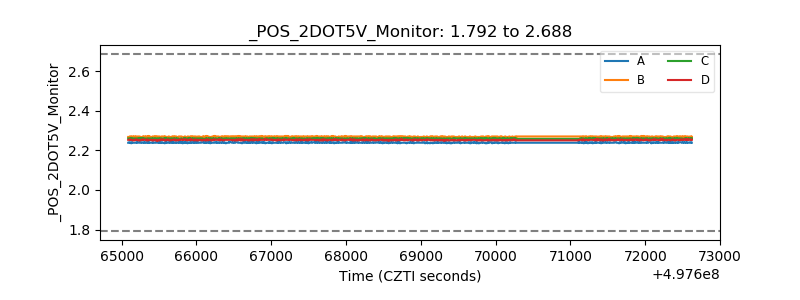 |
| +5 Volts monitor | 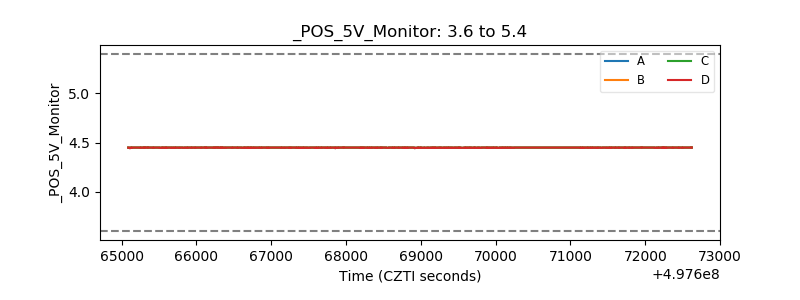 |
| _ROLL_ROT | 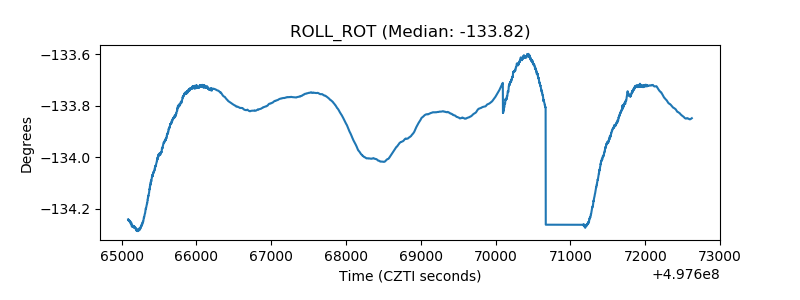 |
| _Roll_DEC | 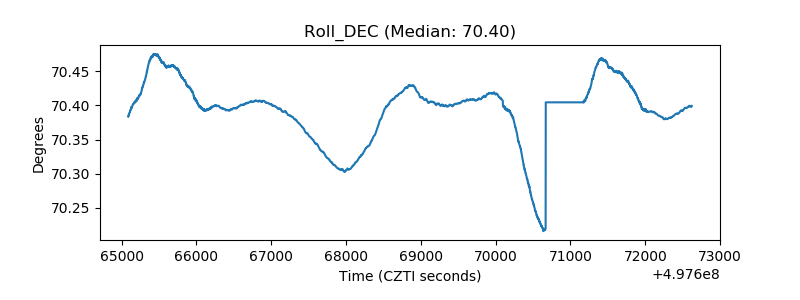 |
| _Roll_RA | 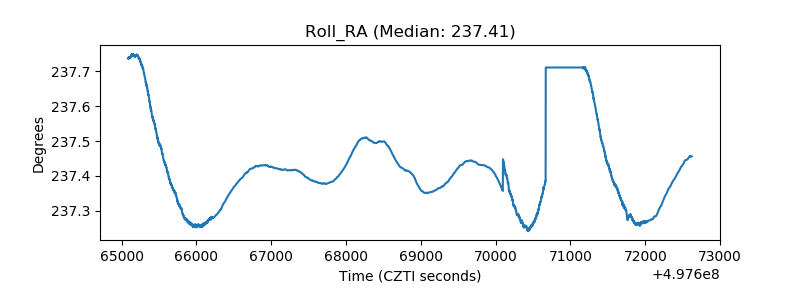 |
| Veto Counter | 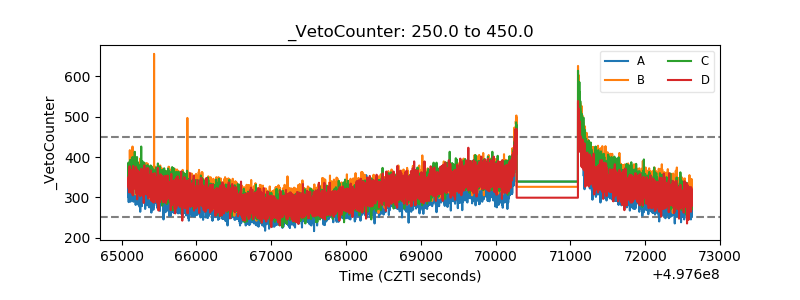 |