| Param | Original file | Final file |
|---|---|---|
| Filename | modeM0/AS1C09_004T08_9000006514_54265cztM0_level2.fits | modeM0/AS1C09_004T08_9000006514_54265cztM0_level2_quad_clean.evt |
| Size (bytes) | 711,740,160 | 83,108,160 |
| Size | 678.8 MB | 79.3 MB |
| Events in quadrant A | 4,962,731 | 577,165 |
| Events in quadrant B | 3,752,339 | 664,822 |
| Events in quadrant C | 5,902,511 | 533,510 |
| Events in quadrant D | 11,208,805 | 273,772 |
| Mode M0 | |||
|---|---|---|---|
| Quadrant | BADHDUFLAG | Total packets | Discarded packets |
| A | 0 | 19487 | 2 |
| B | 0 | 15786 | 2 |
| C | 0 | 22260 | 2 |
| D | 0 | 37858 | 2 |
| Mode M9 | |||
|---|---|---|---|
| Quadrant | BADHDUFLAG | Total packets | Discarded packets |
| A | 0 | 10 | 0 |
| B | 0 | 10 | 0 |
| C | 0 | 10 | 0 |
| D | 0 | 10 | 0 |
| Mode SS | |||
|---|---|---|---|
| Quadrant | BADHDUFLAG | Total packets | Discarded packets |
| A | 0 | 136 | 0 |
| B | 0 | 136 | 0 |
| C | 0 | 136 | 0 |
| D | 0 | 136 | 0 |
| Quadrant | Total seconds | Saturated seconds | Saturation percentage |
|---|---|---|---|
| A | 6695 | 590 | 8.812547% |
| B | 6695 | 183 | 2.733383% |
| C | 6695 | 902 | 13.472741% |
| D | 6696 | 3622 | 54.091995% |
Noise dominated data is calculated using 1-second bins in cleaned event files. If a bin has >2000 counts, and if more than 50% of those come from <1% of pixels, then it is considered to be noise-dominated and hence unusable.
| Quadrant | # 1 sec bins | Bins with >0 counts | Bins with >2000 counts | High rate bins dominated by noise | Noise dominated (total time) | Noise dominated (detector-on time) | Marked lightcurve |
|---|---|---|---|---|---|---|---|
| A | 7669 | 6694 | 492 | 492 | 6.42% | 7.35% | 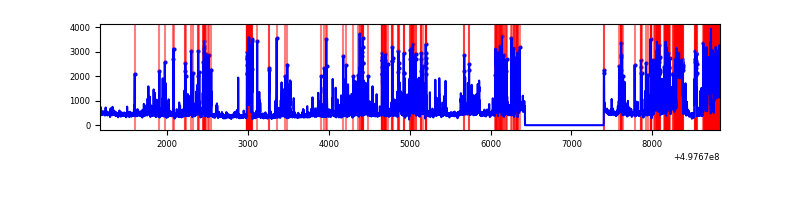 |
| B | 7670 | 6695 | 79 | 79 | 1.03% | 1.18% | 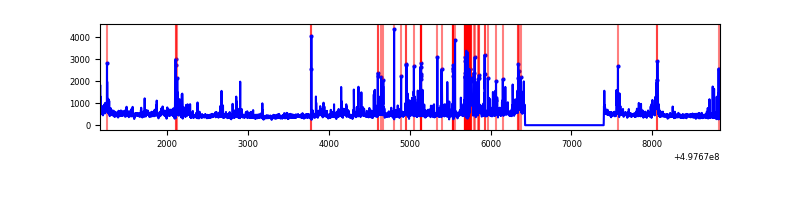 |
| C | 7670 | 6696 | 811 | 811 | 10.57% | 12.11% | 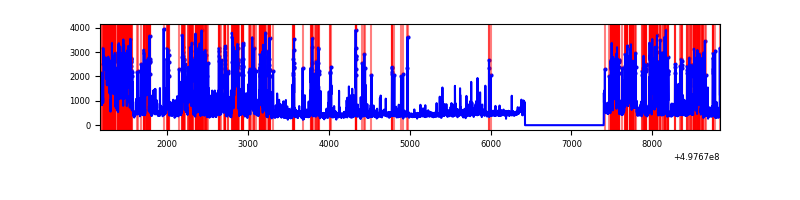 |
| D | 7670 | 6695 | 3024 | 3024 | 39.43% | 45.17% | 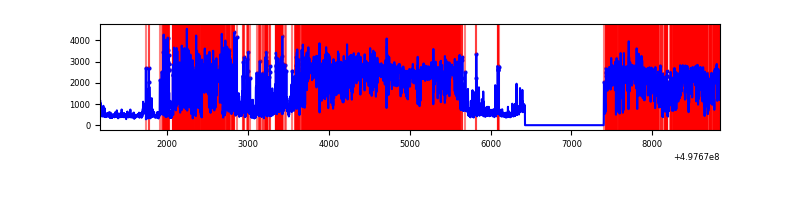 |
Top three noisy pixels from each quadrant. If the there are fewer than three noisy pixels in the level2.evt file, extra rows are filled as -1
| Pixel properties | Quadrant properties | ||||||
|---|---|---|---|---|---|---|---|
| Quadrant | DetID | PixID | Counts | Sigma | Mean | Median | Sigma |
| A | 7 | 29 | 2121883 | 12872.87 | 671 | 655 | 164.8 |
| A | 0 | 8 | 101842 | 614.06 | 671 | 655 | 164.8 |
| A | 3 | 14 | 31157 | 185.1 | 671 | 655 | 164.8 |
| B | 0 | 213 | 311915 | 2097.63 | 691 | 665 | 148.4 |
| B | 5 | 236 | 230331 | 1547.81 | 691 | 665 | 148.4 |
| B | 7 | 0 | 203051 | 1363.96 | 691 | 665 | 148.4 |
| C | 1 | 29 | 2576042 | 14701.65 | 642 | 640 | 175.2 |
| C | 15 | 215 | 232175 | 1321.71 | 642 | 640 | 175.2 |
| C | 14 | 254 | 212157 | 1207.44 | 642 | 640 | 175.2 |
| D | 8 | 176 | 9035244 | 71819.13 | 438 | 418 | 125.8 |
| D | 10 | 181 | 108780 | 861.39 | 438 | 418 | 125.8 |
| D | 3 | 12 | 61929 | 488.96 | 438 | 418 | 125.8 |
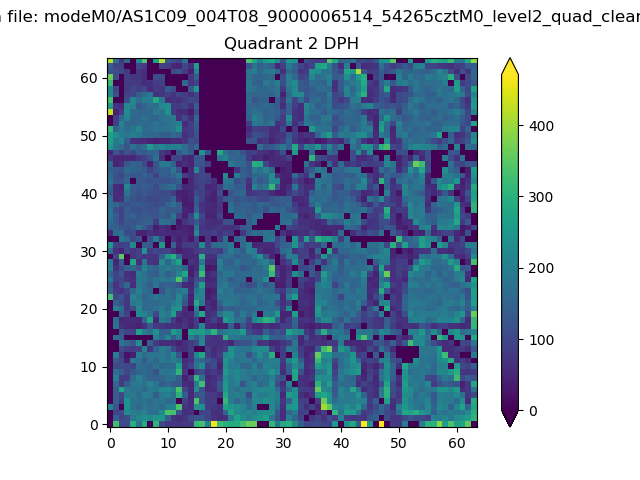
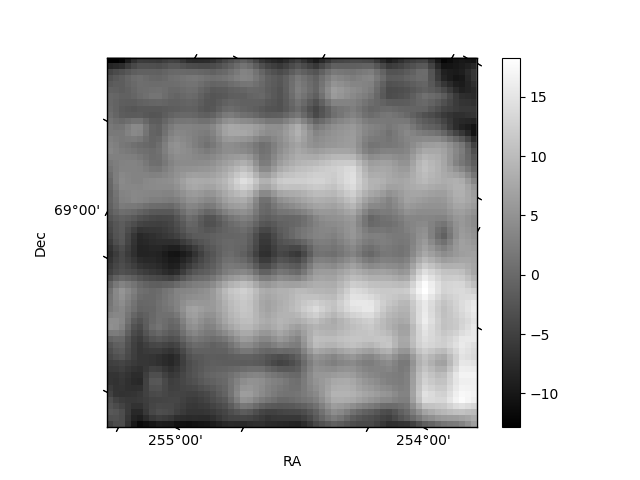
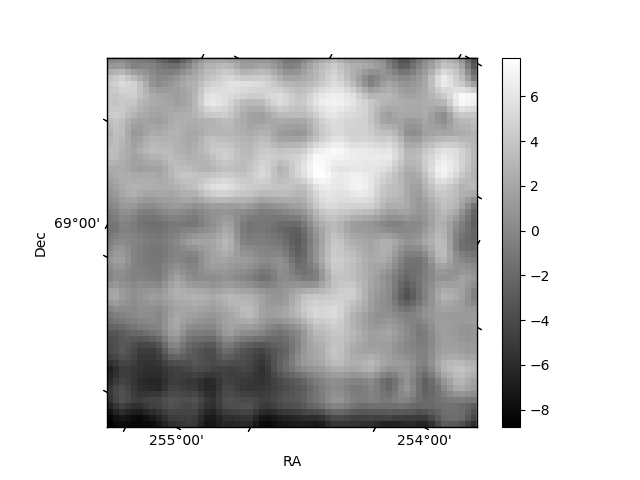
Histogram calculated using DETX and DETY for each event in the final _common_clean file
| Quadrant A |  |
 |
Quadrant B |
|---|---|---|---|
| Quadrant D | 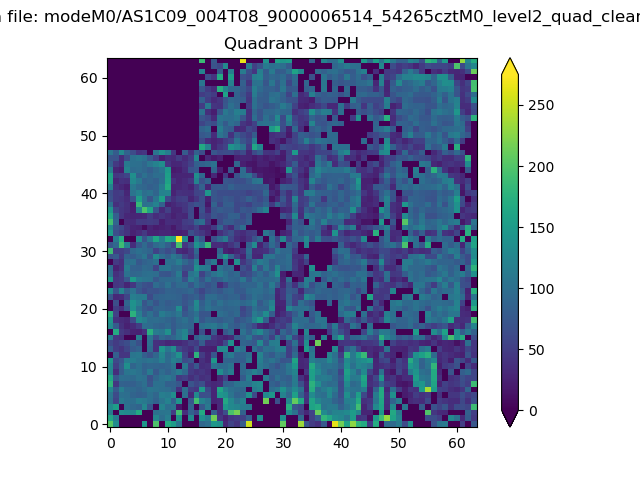 |
 |
Quadrant C |
| Plot type | Count rate plots | Images |
|---|---|---|
| Comparison with Poisson distribution Blue bars denote a histogram of data divided into 1 sec bins. Red curve is a Poisson curve with rate = median count rate of data. |
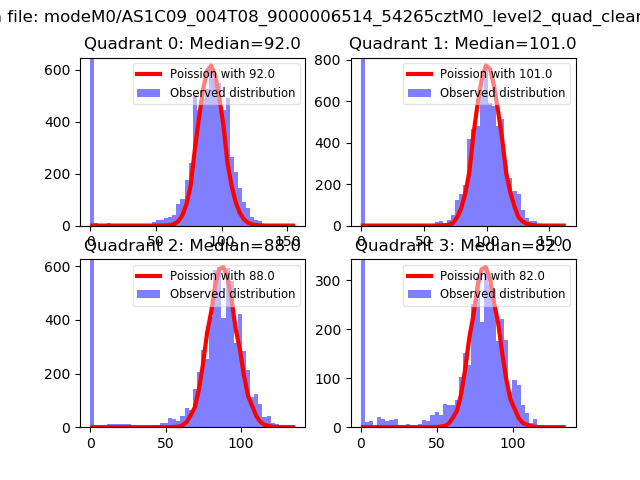 |
 |
| Quadrant-wise count rates Data is divided into 100 sec bins |
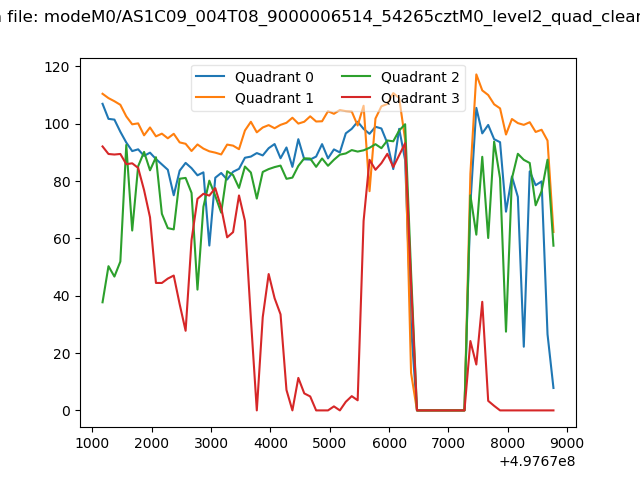 |
|
| Module-wise count rates for Quadrant A Data is divided into 100 sec bins |
 |
 |
| Module-wise count rates for Quadrant B Data is divided into 100 sec bins |
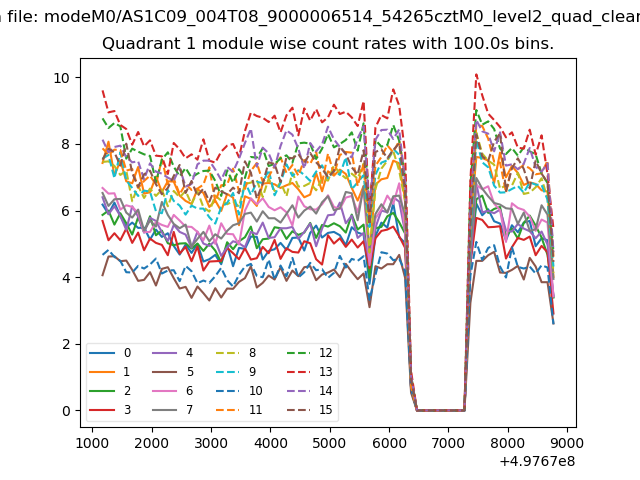 |
 |
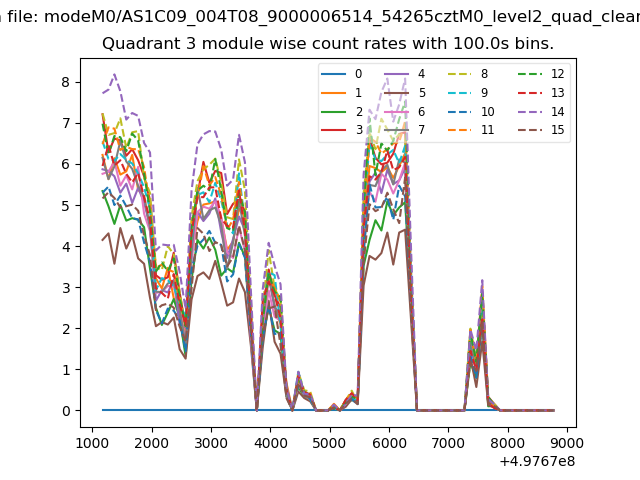
| Module-wise count rates for Quadrant C Data is divided into 100 sec bins |
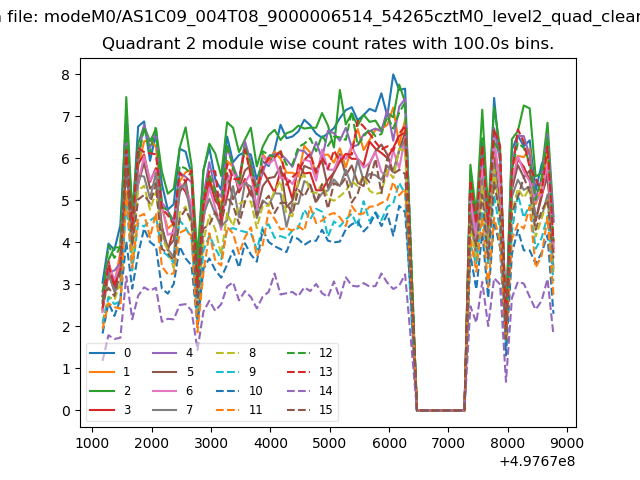 |
 |
| Module-wise count rates for Quadrant D Data is divided into 100 sec bins |
 |
 |
| Parameter | Plot |
|---|---|
| CZT HV Monitor | 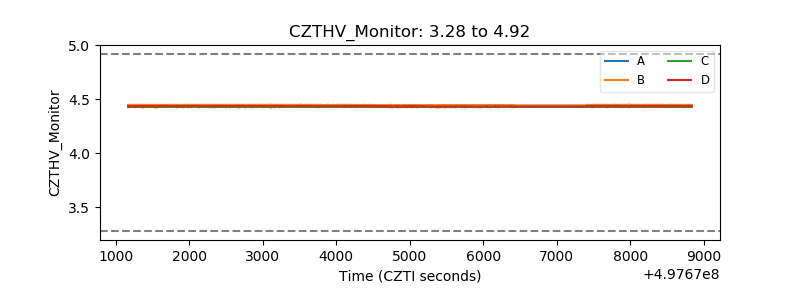 |
| D_VDD | 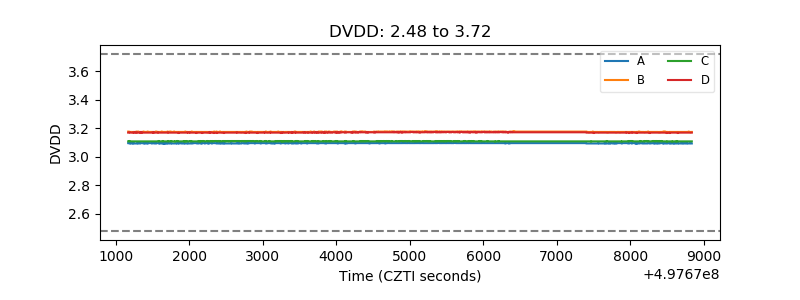 |
| Temperature 1 | 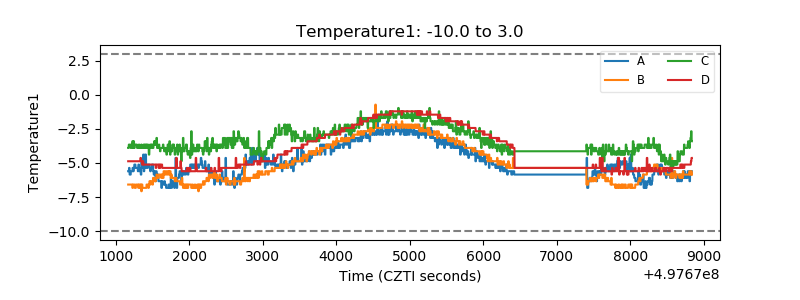 |
| Veto HV Monitor | 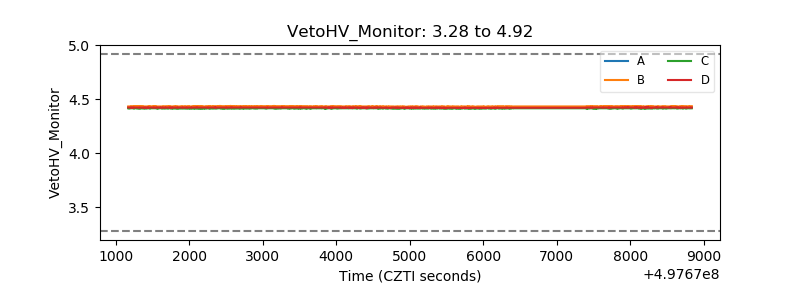 |
| Veto LLD | 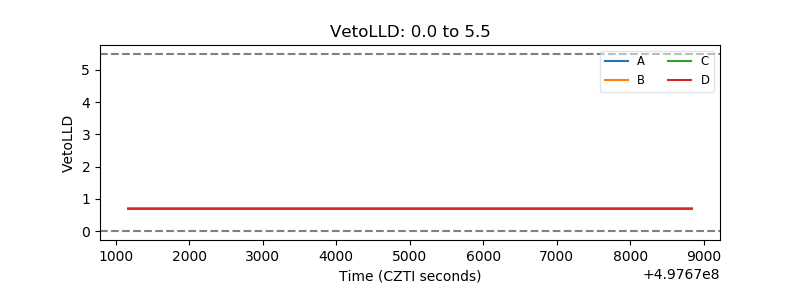 |
| Alpha Counter | 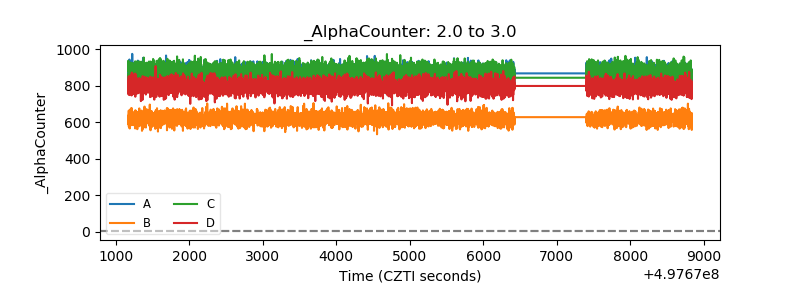 |
| _CPM_Rate | 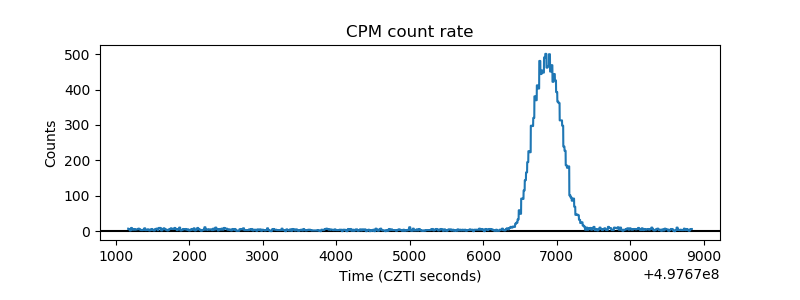 |
| CZT Counter | 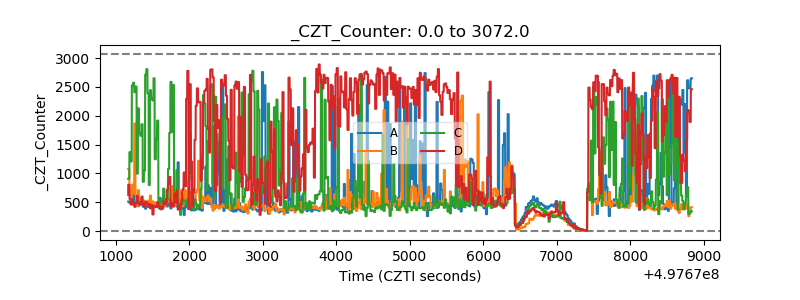 |
| +2.5 Volts monitor | 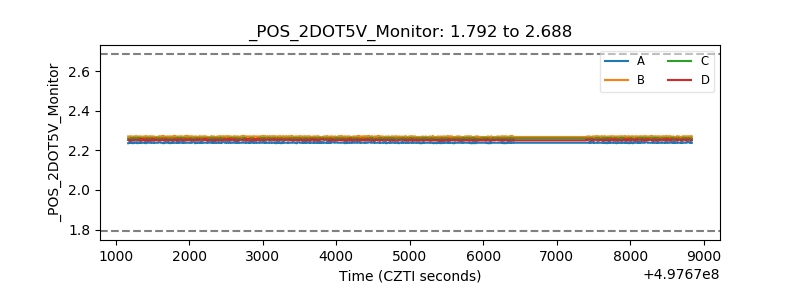 |
| +5 Volts monitor |  |
| _ROLL_ROT | 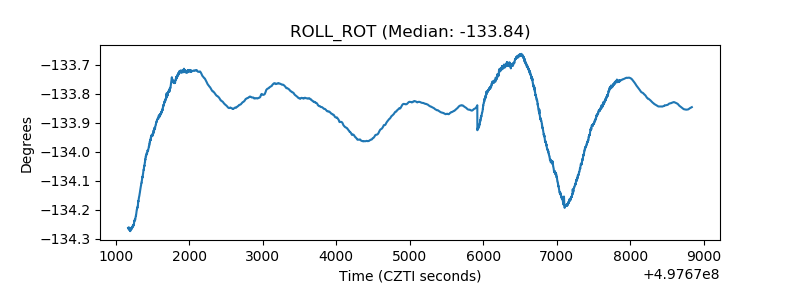 |
| _Roll_DEC | 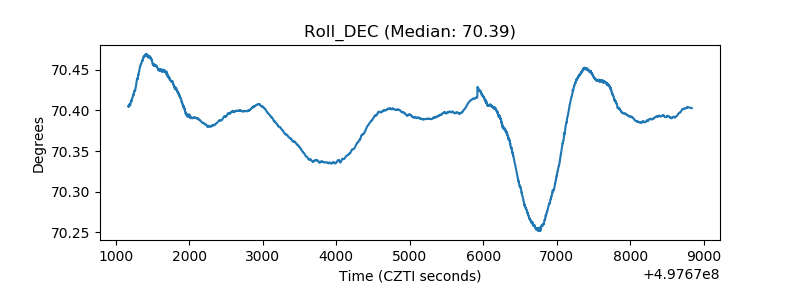 |
| _Roll_RA | 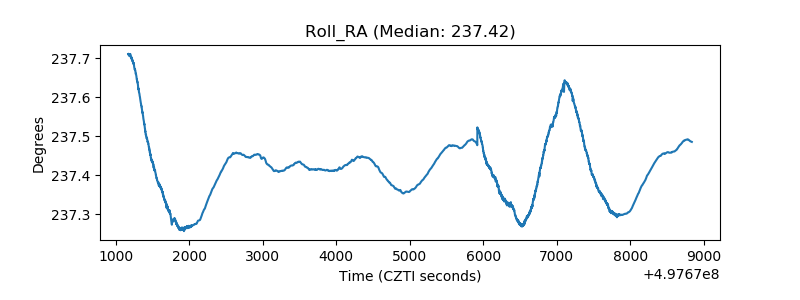 |
| Veto Counter | 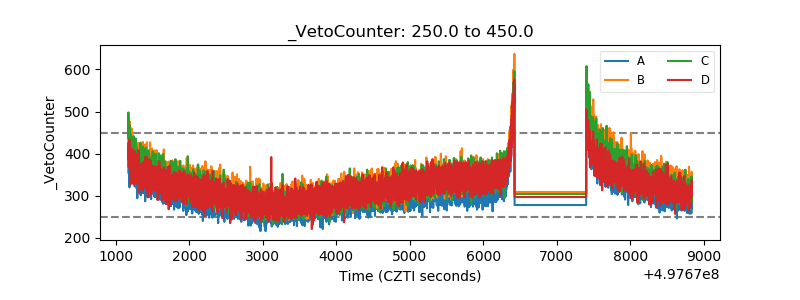 |