| Param | Original file | Final file |
|---|---|---|
| Filename | modeM0/AS1A14_126T15_9000006516cztM0_level2.fits | modeM0/AS1A14_126T15_9000006516cztM0_level2_quad_clean.evt |
| Size (bytes) | 4,231,944,000 | 2,230,246,080 |
| Size | 3.9 GB | 2.1 GB |
| Events in quadrant A | 26,779,388 | 9,180,203 |
| Events in quadrant B | 24,968,816 | 9,701,383 |
| Events in quadrant C | 23,800,348 | 7,528,108 |
| Events in quadrant D | 15,527,786 | 4,178,376 |
| Mode SS | |||
|---|---|---|---|
| Quadrant | BADHDUFLAG | Total packets | Discarded packets |
| A | 0 | 10948 | 0 |
| B | 0 | 10944 | 0 |
| C | 0 | 10941 | 0 |
| D | 0 | 10942 | 0 |
| Mode M0 | |||
|---|---|---|---|
| Quadrant | BADHDUFLAG | Total packets | Discarded packets |
| A | 0 | 1225806 | 0 |
| B | 0 | 1274742 | 0 |
| C | 0 | 1751826 | 0 |
| D | 0 | 2931742 | 0 |
| Mode M9 | |||
|---|---|---|---|
| Quadrant | BADHDUFLAG | Total packets | Discarded packets |
| A | 0 | 632 | 0 |
| B | 0 | 631 | 0 |
| C | 0 | 632 | 0 |
| D | 0 | 631 | 0 |
| Quadrant | Total seconds | Saturated seconds | Saturation percentage |
|---|---|---|---|
| A | 539295 | 14438 | 2.677199% |
| B | 539171 | 14994 | 2.780936% |
| C | 539120 | 75343 | 13.975182% |
| D | 539084 | 239319 | 44.393638% |
Noise dominated data is calculated using 1-second bins in cleaned event files. If a bin has >2000 counts, and if more than 50% of those come from <1% of pixels, then it is considered to be noise-dominated and hence unusable.
| Quadrant | # 1 sec bins | Bins with >0 counts | Bins with >2000 counts | High rate bins dominated by noise | Noise dominated (total time) | Noise dominated (detector-on time) | Marked lightcurve |
|---|---|---|---|---|---|---|---|
| A | 603739 | 539083 | 0 | 0 | 0.00% | 0.00% | 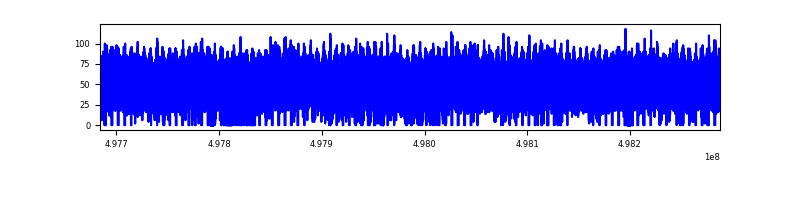 |
| B | 603739 | 538661 | 0 | 0 | 0.00% | 0.00% | 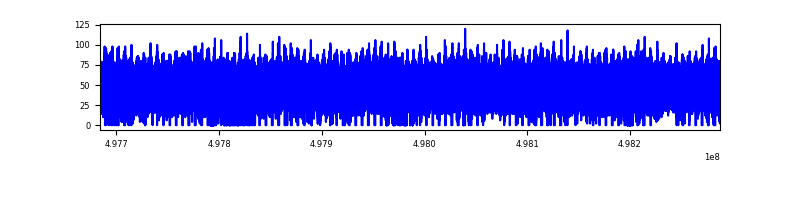 |
| C | 603739 | 537535 | 0 | 0 | 0.00% | 0.00% | 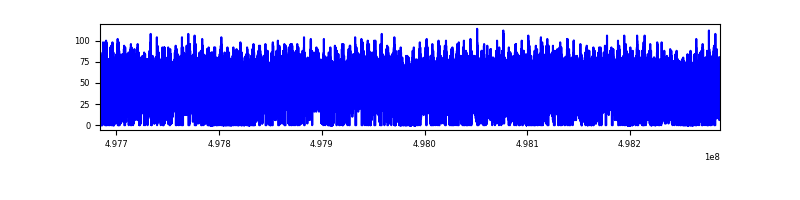 |
| D | 603739 | 504249 | 0 | 0 | 0.00% | 0.00% | 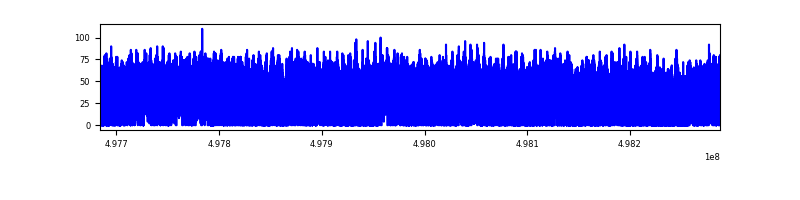 |
Top three noisy pixels from each quadrant. If the there are fewer than three noisy pixels in the level2.evt file, extra rows are filled as -1
| Pixel properties | Quadrant properties | ||||||
|---|---|---|---|---|---|---|---|
| Quadrant | DetID | PixID | Counts | Sigma | Mean | Median | Sigma |
| A | 14 | 188 | 30253 | 10.04 | 7046 | 6508 | 2366.0 |
| A | 9 | 255 | 27195 | 8.74 | 7046 | 6508 | 2366.0 |
| A | 14 | 204 | 24826 | 7.74 | 7046 | 6508 | 2366.0 |
| B | 2 | 9 | 29206 | 14.83 | 6623 | 6285 | 1546.0 |
| B | 2 | 8 | 26311 | 12.95 | 6623 | 6285 | 1546.0 |
| B | 9 | 173 | 20186 | 8.99 | 6623 | 6285 | 1546.0 |
| C | 2 | 31 | 18964 | 5.95 | 6366 | 5789 | 2212.5 |
| C | 15 | 127 | 18468 | 5.73 | 6366 | 5789 | 2212.5 |
| C | 7 | 221 | 18124 | 5.58 | 6366 | 5789 | 2212.5 |
| D | 6 | 218 | 19838 | 10.53 | 4437 | 3924 | 1510.5 |
| D | 15 | 11 | 14926 | 7.28 | 4437 | 3924 | 1510.5 |
| D | 6 | 159 | 14504 | 7.0 | 4437 | 3924 | 1510.5 |
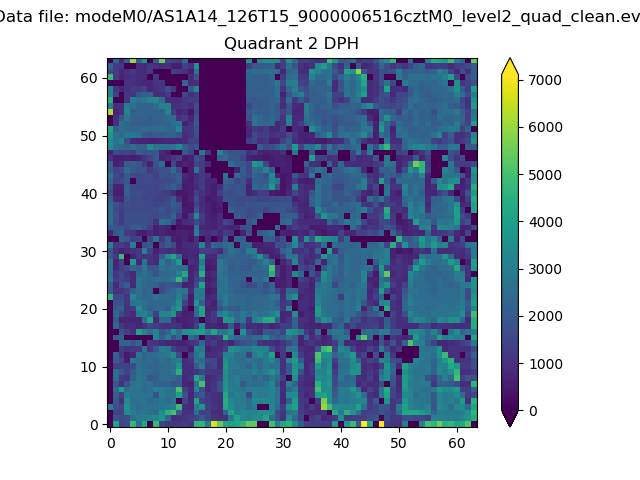
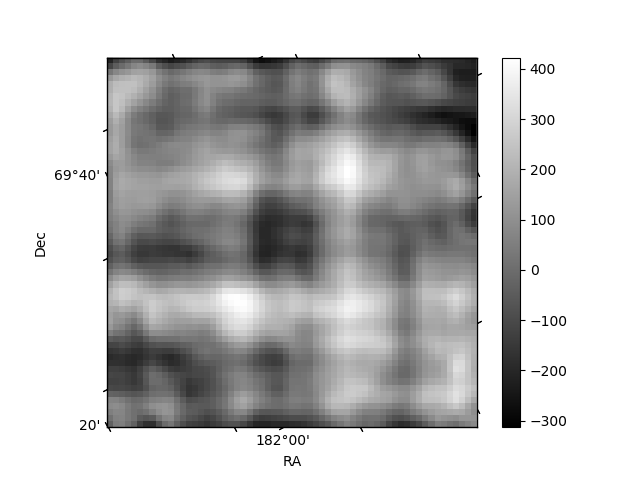
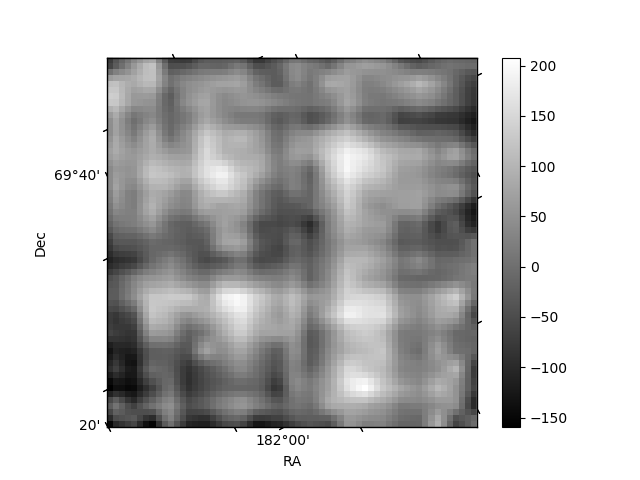
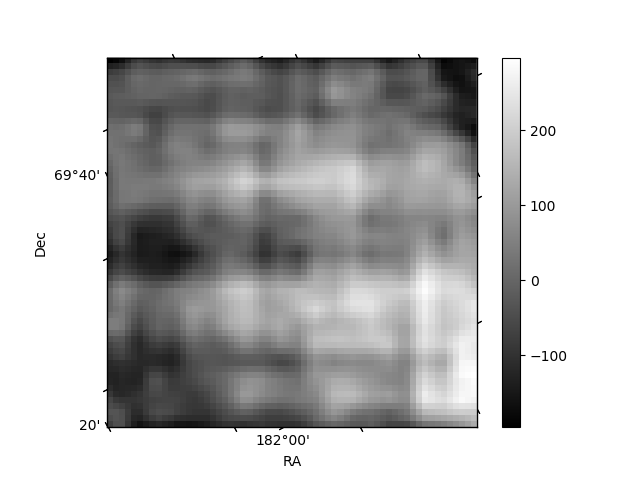
Histogram calculated using DETX and DETY for each event in the final _common_clean file
| Quadrant A | 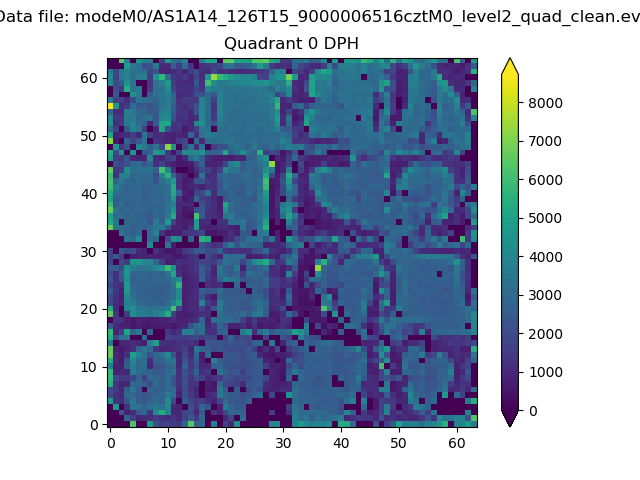 |
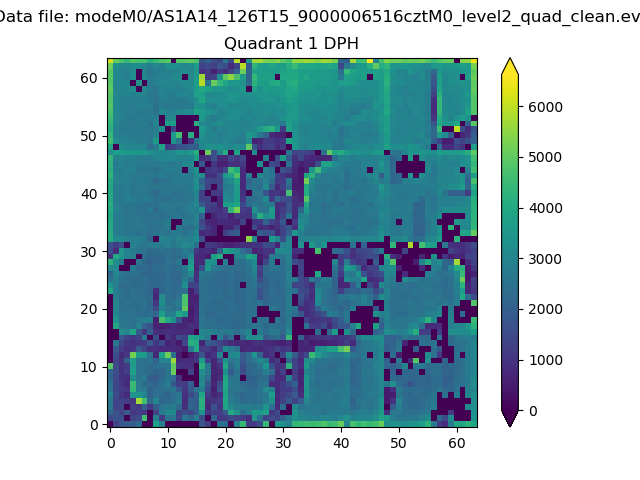 |
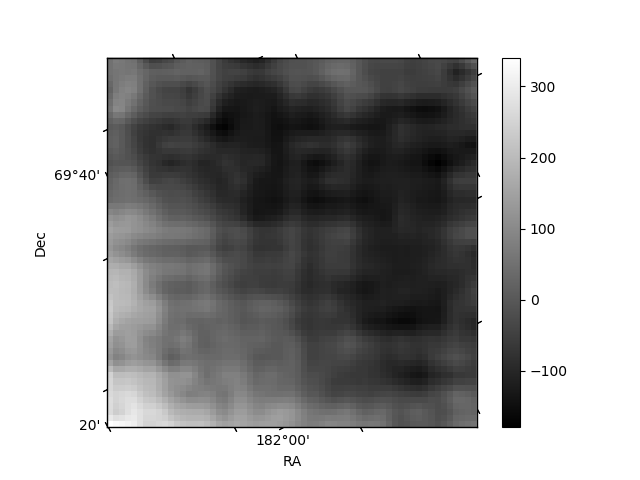
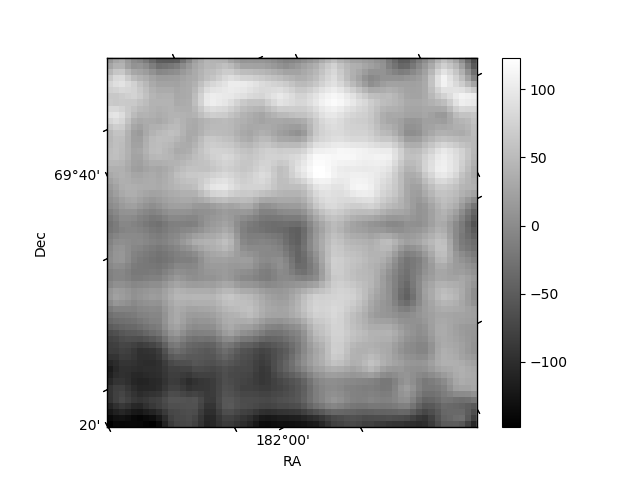
Quadrant B |
|---|---|---|---|
| Quadrant D | 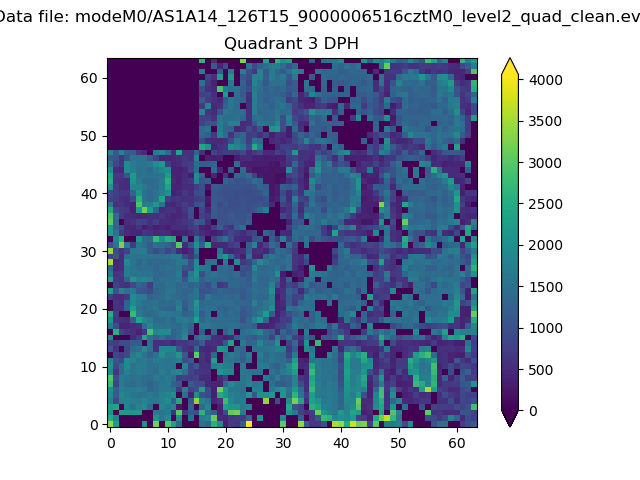 |
 |
Quadrant C |
| Plot type | Count rate plots | Images |
|---|---|---|
| Comparison with Poisson distribution Blue bars denote a histogram of data divided into 1 sec bins. Red curve is a Poisson curve with rate = median count rate of data. |
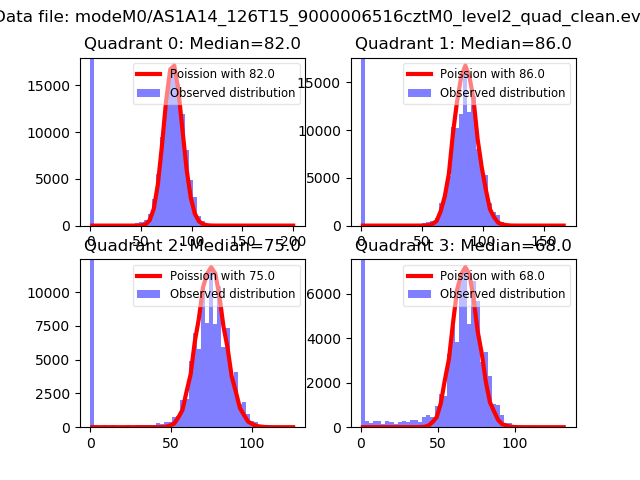 |
 |
| Quadrant-wise count rates Data is divided into 100 sec bins |
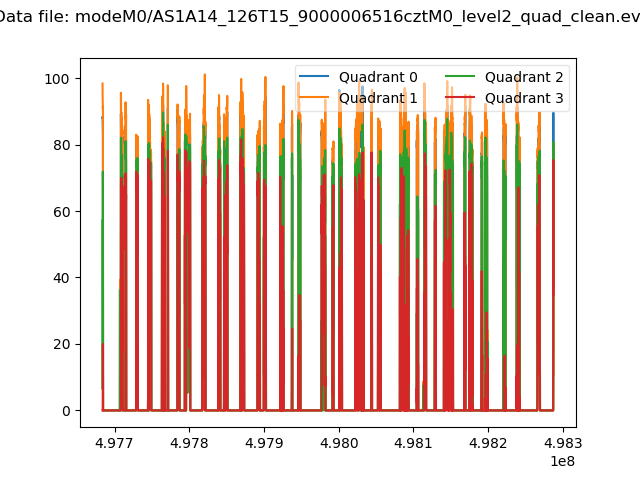 |
|
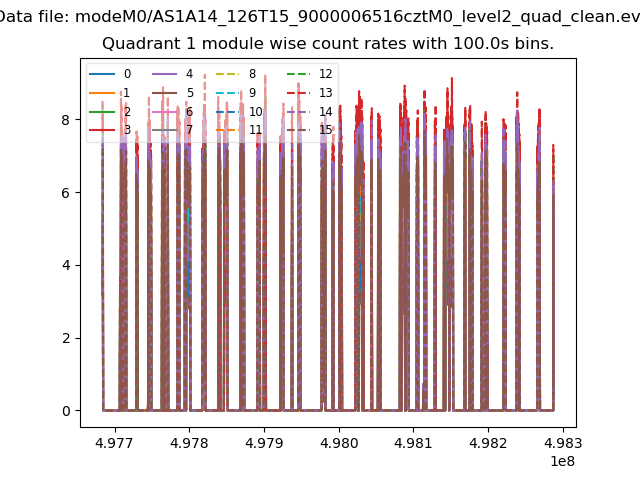
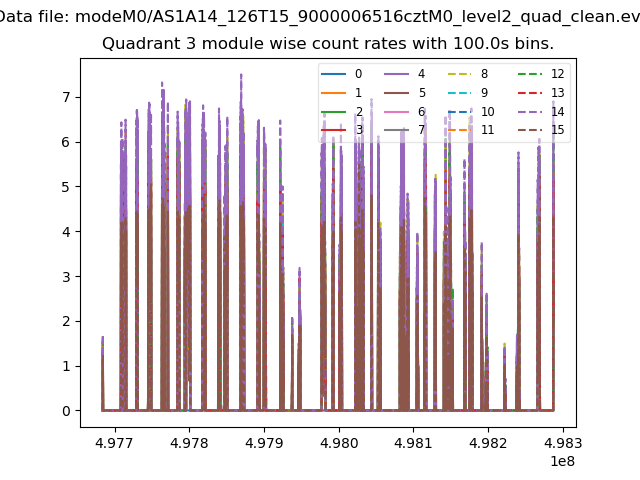
| Module-wise count rates for Quadrant A Data is divided into 100 sec bins |
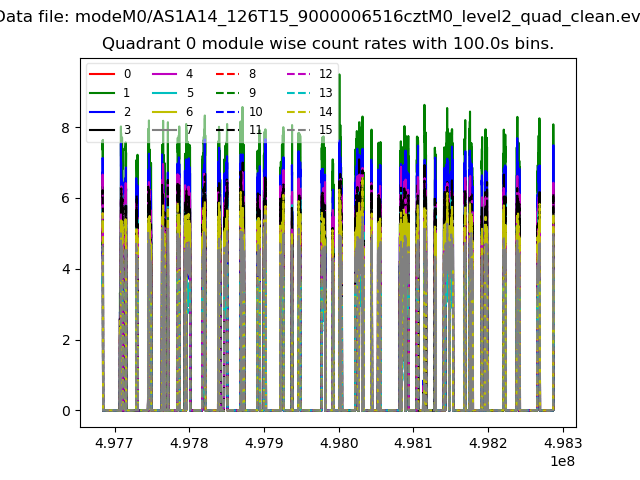 |
 |
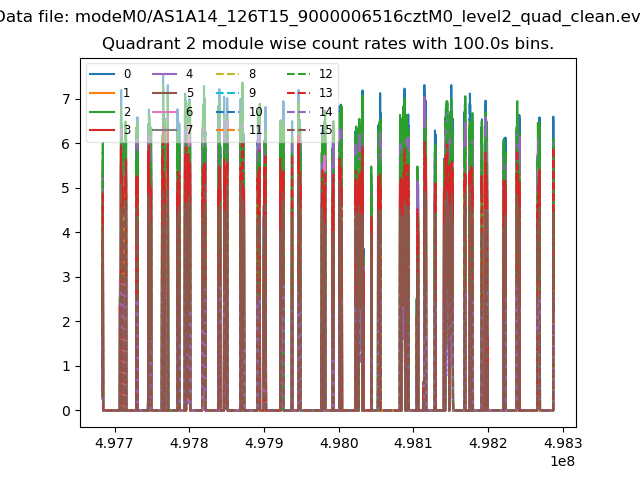
| Module-wise count rates for Quadrant B Data is divided into 100 sec bins |
 |
 |
| Module-wise count rates for Quadrant C Data is divided into 100 sec bins |
 |
 |
| Module-wise count rates for Quadrant D Data is divided into 100 sec bins |
 |
 |
| Parameter | Plot |
|---|---|
| CZT HV Monitor | 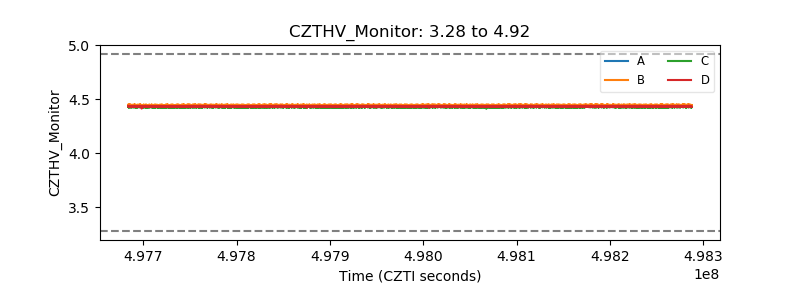 |
| D_VDD | 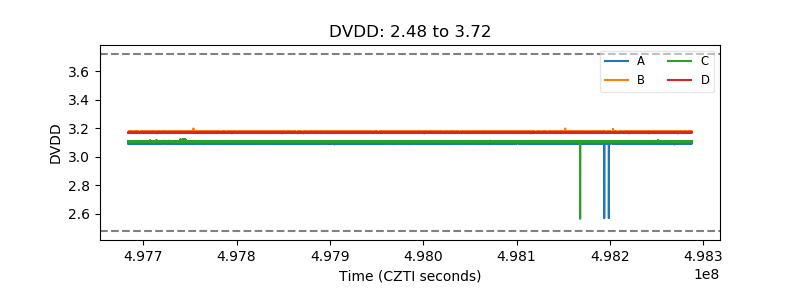 |
| Temperature 1 | 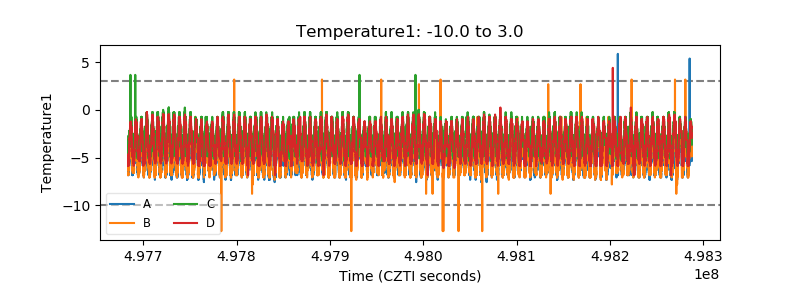 |
| Veto HV Monitor | 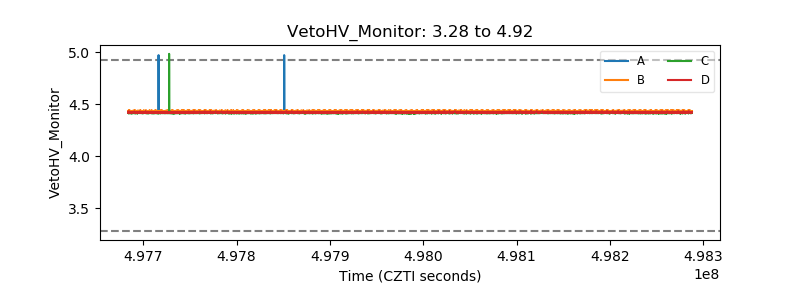 |
| Veto LLD | 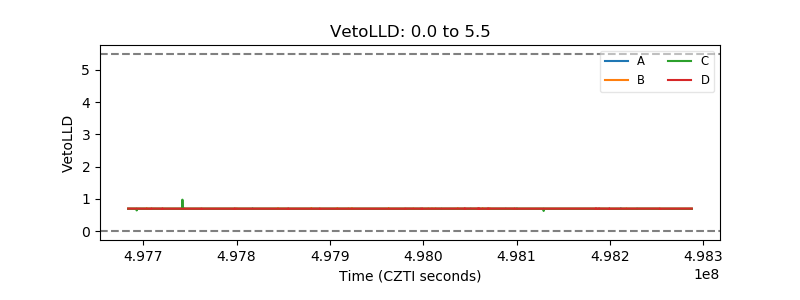 |
| Alpha Counter | 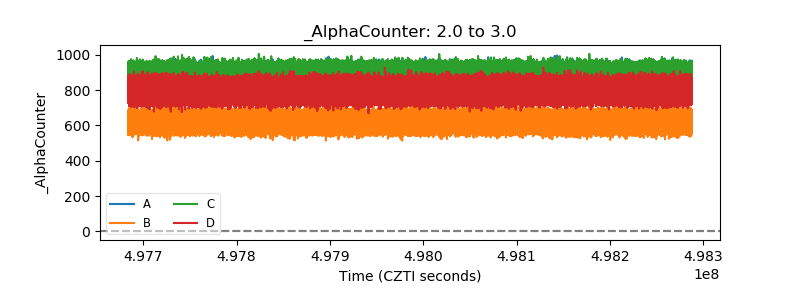 |
| _CPM_Rate | 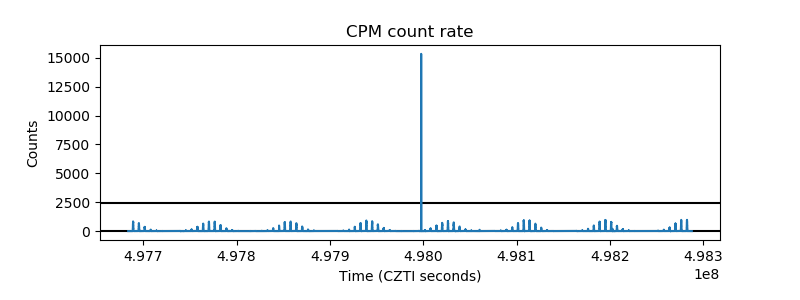 |
| CZT Counter | 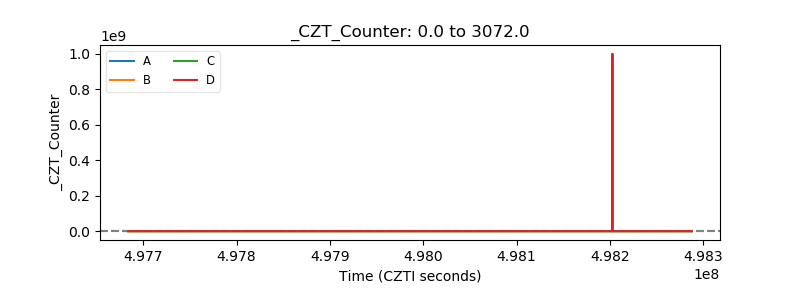 |
| +2.5 Volts monitor | 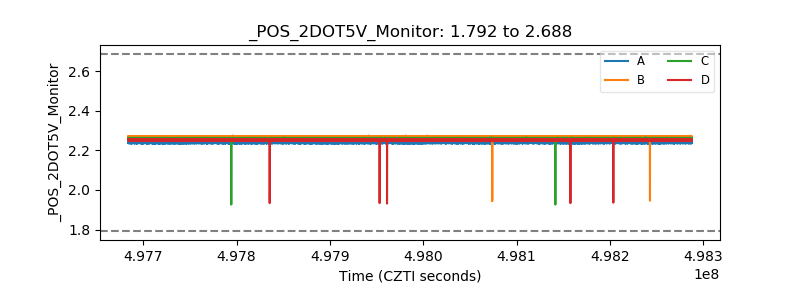 |
| +5 Volts monitor | 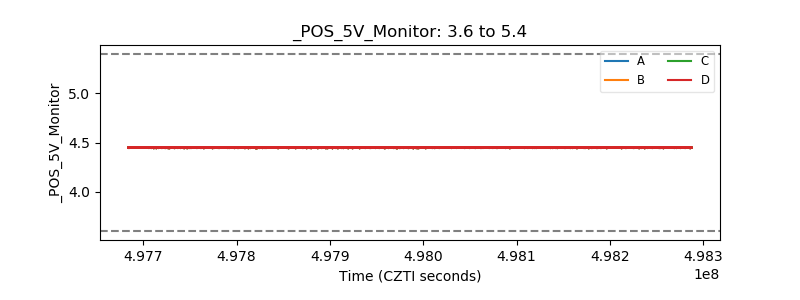 |
| _ROLL_ROT | 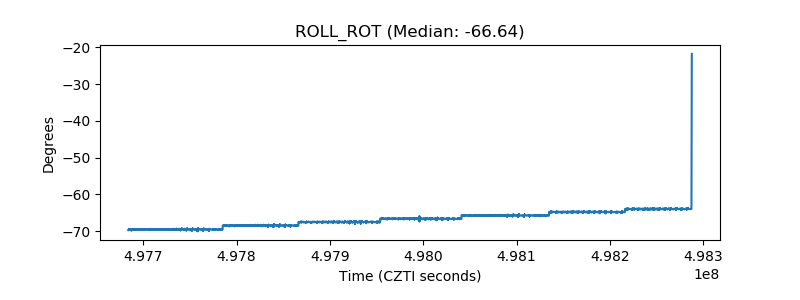 |
| _Roll_DEC | 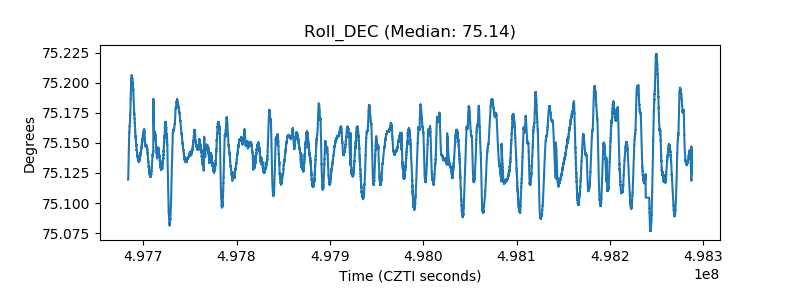 |
| _Roll_RA | 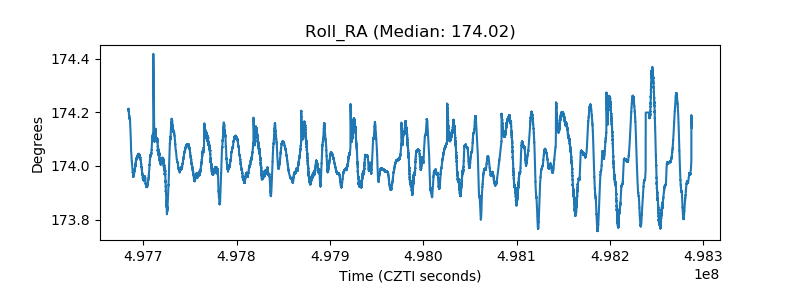 |
| Veto Counter | 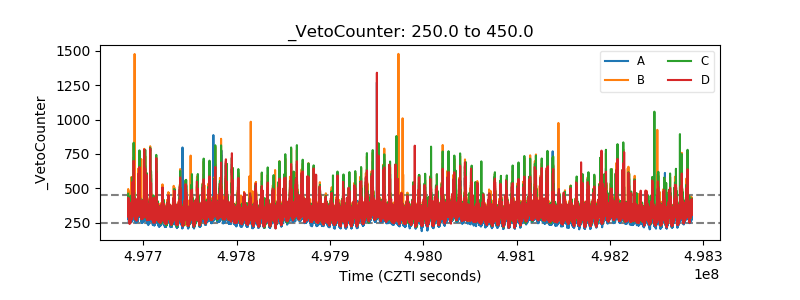 |