| Param | Original file | Final file |
|---|---|---|
| Filename | modeM0/AS1A14_126T15_9000006516_54268cztM0_level2.fits | modeM0/AS1A14_126T15_9000006516_54268cztM0_level2_quad_clean.evt |
| Size (bytes) | 722,790,720 | 77,181,120 |
| Size | 689.3 MB | 73.6 MB |
| Events in quadrant A | 3,593,835 | 587,447 |
| Events in quadrant B | 3,114,302 | 652,019 |
| Events in quadrant C | 6,326,903 | 485,467 |
| Events in quadrant D | 13,244,254 | 183,284 |
| Mode SS | |||
|---|---|---|---|
| Quadrant | BADHDUFLAG | Total packets | Discarded packets |
| A | 0 | 126 | 0 |
| B | 0 | 126 | 0 |
| C | 0 | 126 | 0 |
| D | 0 | 126 | 0 |
| Mode M0 | |||
|---|---|---|---|
| Quadrant | BADHDUFLAG | Total packets | Discarded packets |
| A | 0 | 15219 | 1 |
| B | 0 | 13430 | 1 |
| C | 0 | 23093 | 1 |
| D | 0 | 43632 | 1 |
| Mode M9 | |||
|---|---|---|---|
| Quadrant | BADHDUFLAG | Total packets | Discarded packets |
| A | 0 | 11 | 0 |
| B | 0 | 11 | 0 |
| C | 0 | 11 | 0 |
| D | 0 | 11 | 0 |
| Quadrant | Total seconds | Saturated seconds | Saturation percentage |
|---|---|---|---|
| A | 6132 | 306 | 4.990215% |
| B | 6132 | 47 | 0.766471% |
| C | 6132 | 1104 | 18.003914% |
| D | 6132 | 4350 | 70.939335% |
Noise dominated data is calculated using 1-second bins in cleaned event files. If a bin has >2000 counts, and if more than 50% of those come from <1% of pixels, then it is considered to be noise-dominated and hence unusable.
| Quadrant | # 1 sec bins | Bins with >0 counts | Bins with >2000 counts | High rate bins dominated by noise | Noise dominated (total time) | Noise dominated (detector-on time) | Marked lightcurve |
|---|---|---|---|---|---|---|---|
| A | 7267 | 6133 | 256 | 256 | 3.52% | 4.17% | 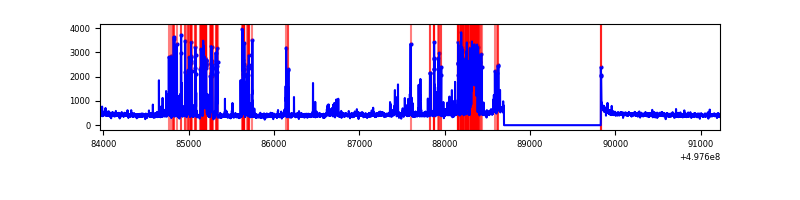 |
| B | 7267 | 6133 | 10 | 10 | 0.14% | 0.16% | 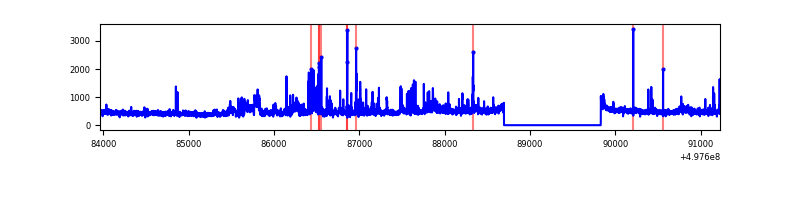 |
| C | 7267 | 6133 | 1056 | 1056 | 14.53% | 17.22% | 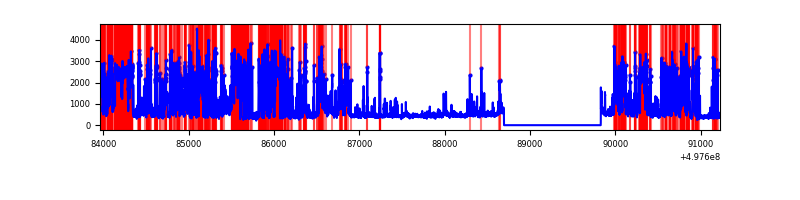 |
| D | 7267 | 6133 | 4123 | 4123 | 56.74% | 67.23% | 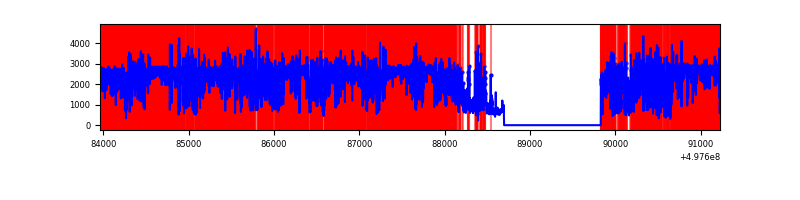 |
Top three noisy pixels from each quadrant. If the there are fewer than three noisy pixels in the level2.evt file, extra rows are filled as -1
| Pixel properties | Quadrant properties | ||||||
|---|---|---|---|---|---|---|---|
| Quadrant | DetID | PixID | Counts | Sigma | Mean | Median | Sigma |
| A | 7 | 29 | 1026653 | 6504.17 | 638 | 622 | 157.7 |
| A | 13 | 248 | 23109 | 142.55 | 638 | 622 | 157.7 |
| A | 8 | 6 | 16041 | 97.74 | 638 | 622 | 157.7 |
| B | 7 | 0 | 224560 | 1623.94 | 643 | 621 | 137.9 |
| B | 5 | 236 | 132344 | 955.22 | 643 | 621 | 137.9 |
| B | 0 | 213 | 96851 | 697.83 | 643 | 621 | 137.9 |
| C | 1 | 29 | 3615063 | 23057.66 | 569 | 564 | 156.8 |
| C | 14 | 254 | 219160 | 1394.47 | 569 | 564 | 156.8 |
| C | 15 | 215 | 87604 | 555.25 | 569 | 564 | 156.8 |
| D | 8 | 176 | 11036490 | 106694.88 | 358 | 341 | 103.4 |
| D | 2 | 62 | 282080 | 2723.79 | 358 | 341 | 103.4 |
| D | 10 | 199 | 170951 | 1649.42 | 358 | 341 | 103.4 |
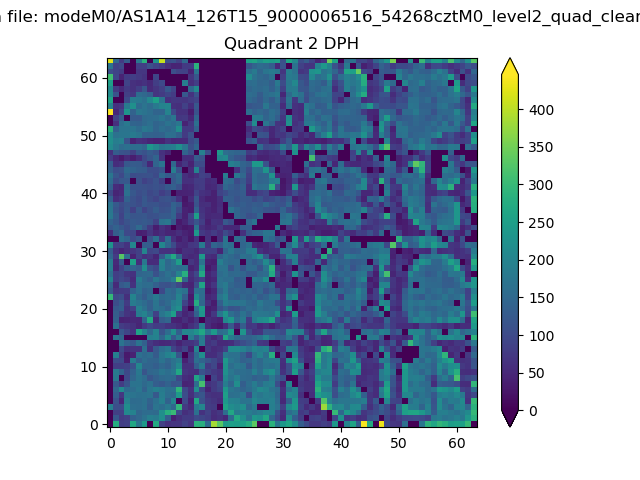
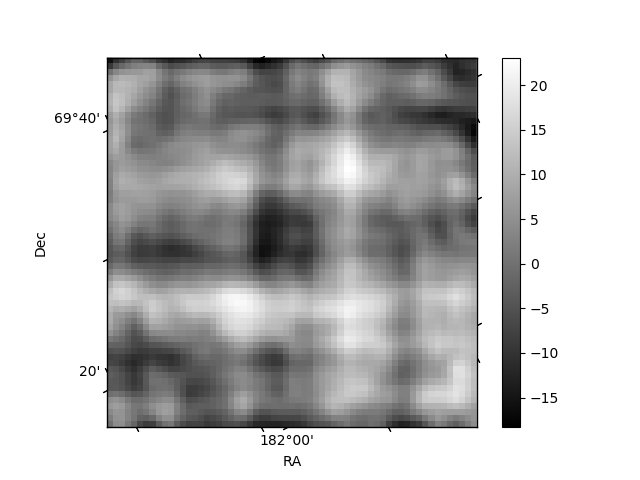
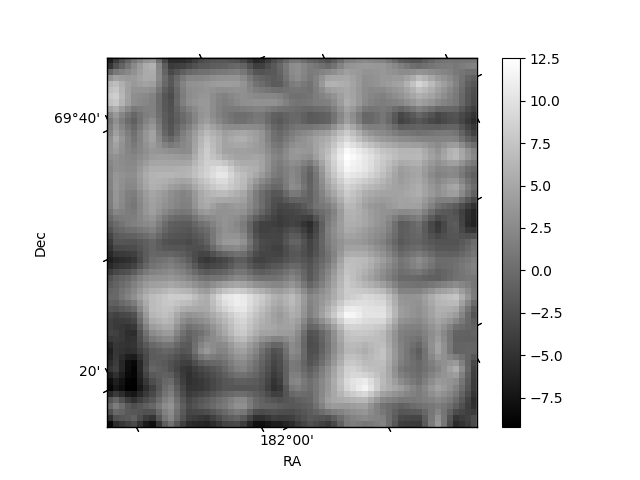
Histogram calculated using DETX and DETY for each event in the final _common_clean file
| Quadrant A | 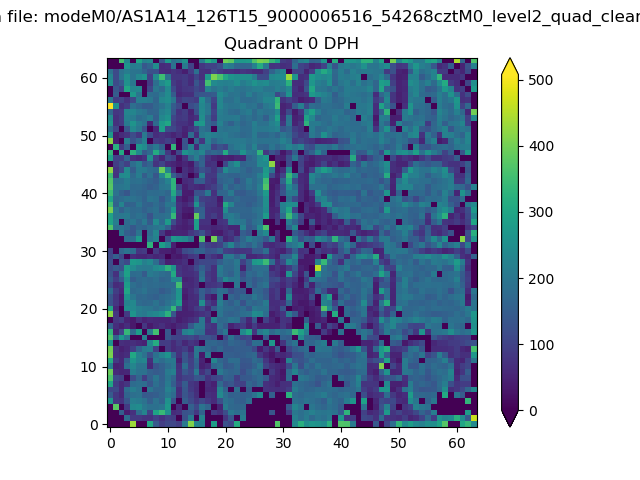 |
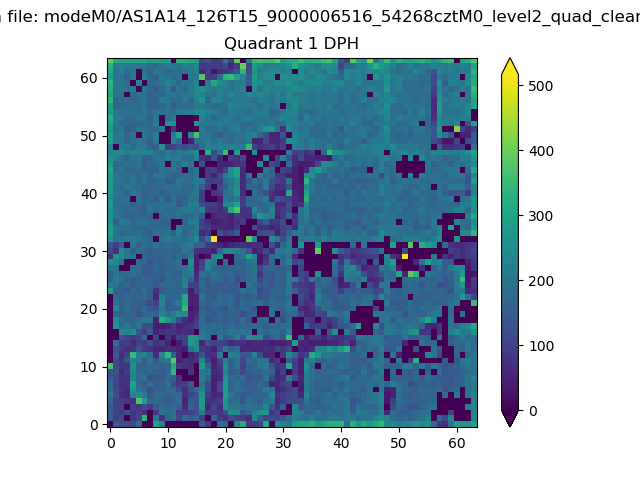 |
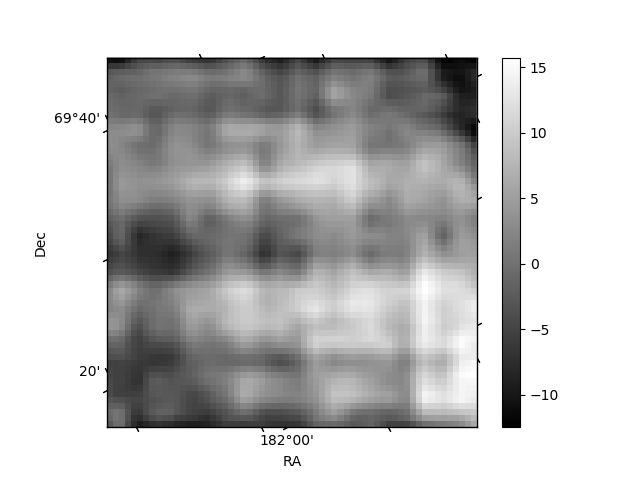
Quadrant B |
|---|---|---|---|
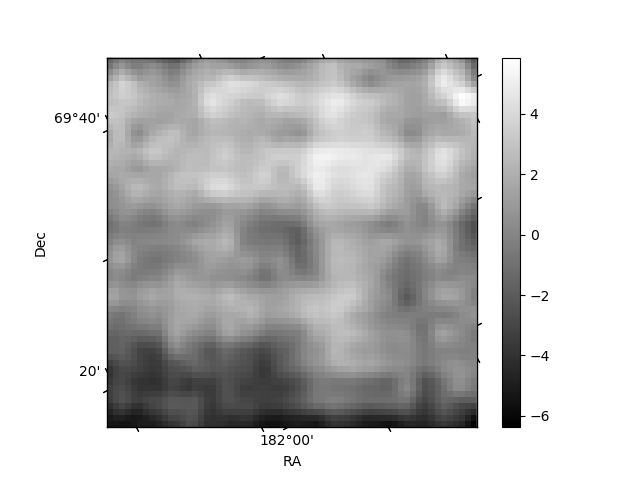
| Quadrant D | 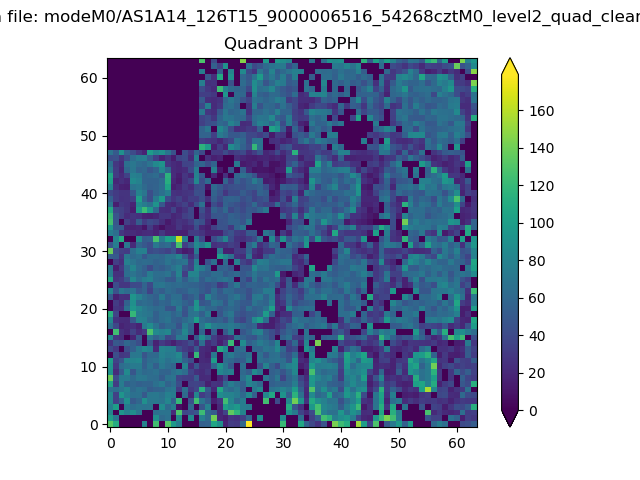 |
 |
Quadrant C |
| Plot type | Count rate plots | Images |
|---|---|---|
| Comparison with Poisson distribution Blue bars denote a histogram of data divided into 1 sec bins. Red curve is a Poisson curve with rate = median count rate of data. |
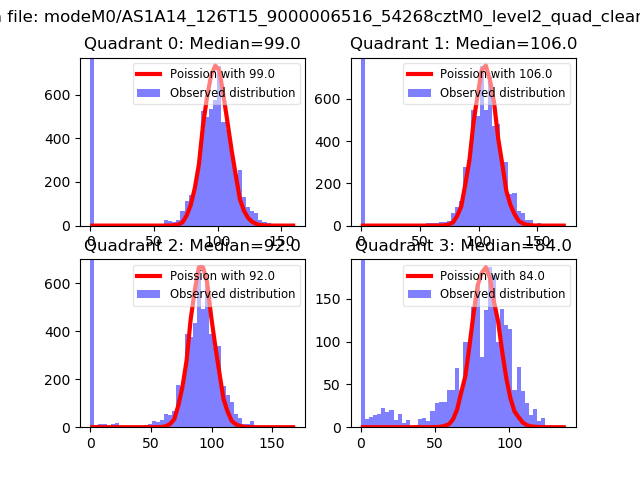 |
 |
| Quadrant-wise count rates Data is divided into 100 sec bins |
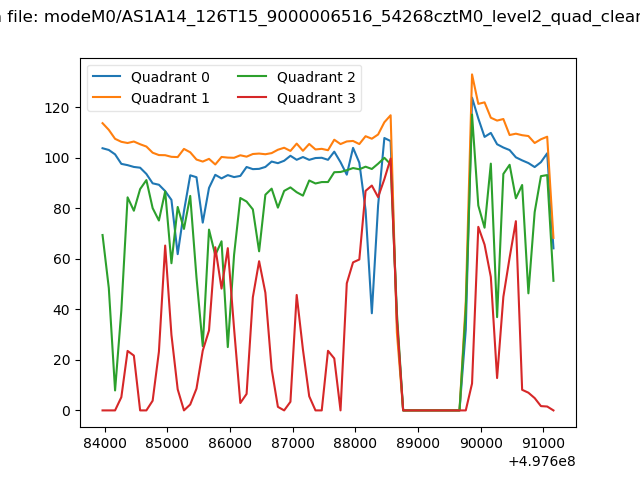 |
|
| Module-wise count rates for Quadrant A Data is divided into 100 sec bins |
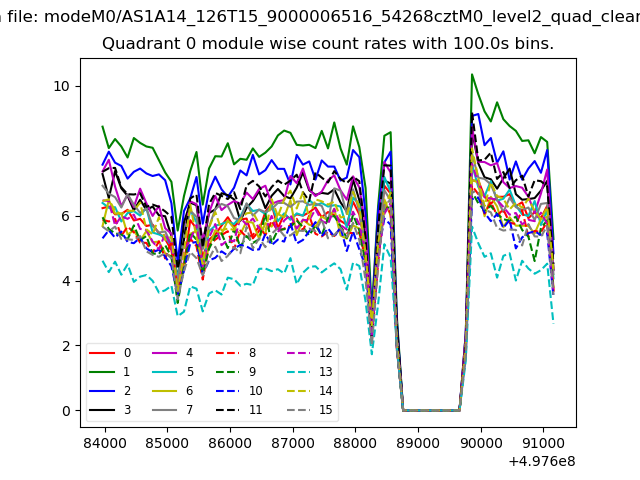 |
 |
| Module-wise count rates for Quadrant B Data is divided into 100 sec bins |
 |
 |
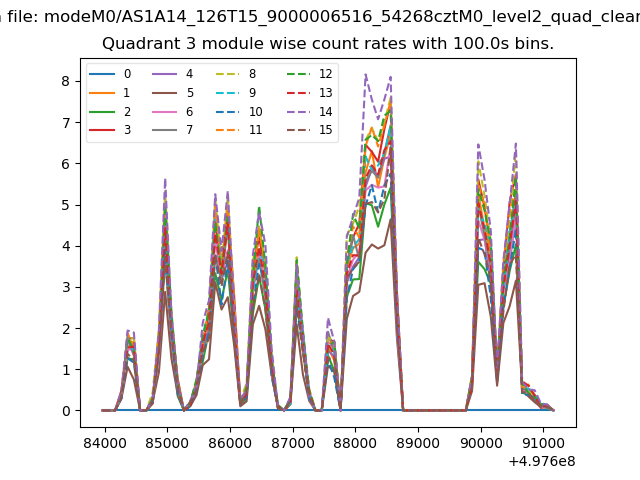
| Module-wise count rates for Quadrant C Data is divided into 100 sec bins |
 |
 |
| Module-wise count rates for Quadrant D Data is divided into 100 sec bins |
 |
 |
| Parameter | Plot |
|---|---|
| CZT HV Monitor | 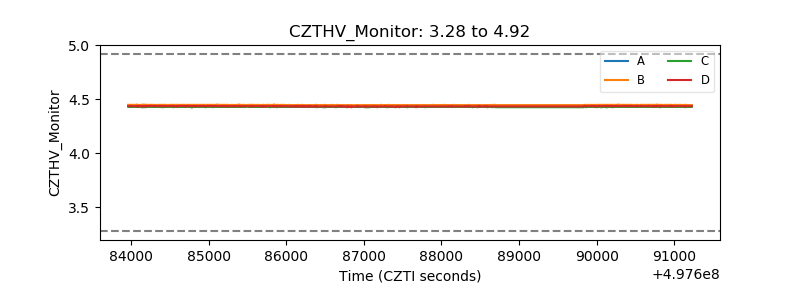 |
| D_VDD | 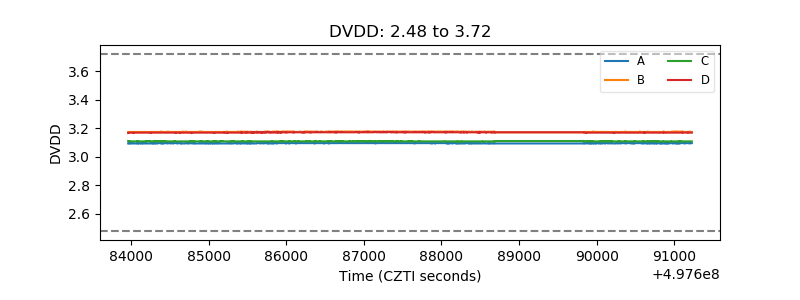 |
| Temperature 1 | 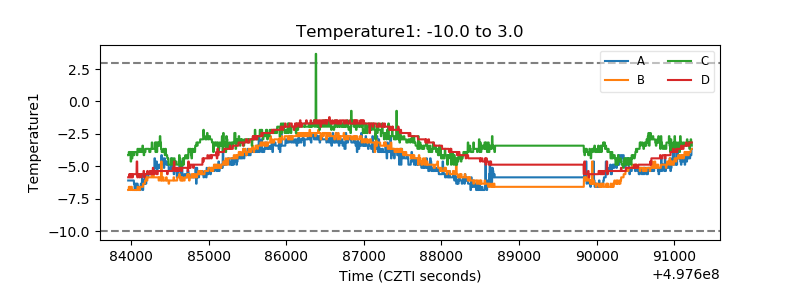 |
| Veto HV Monitor | 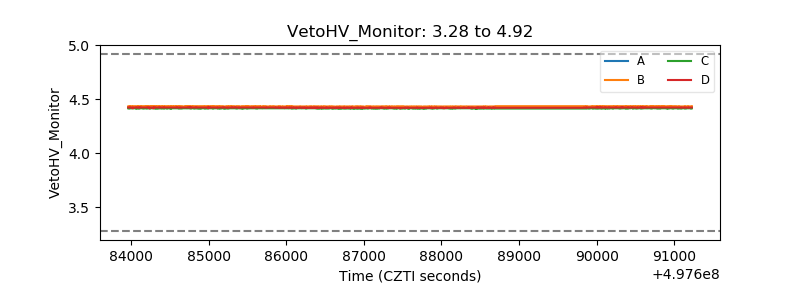 |
| Veto LLD | 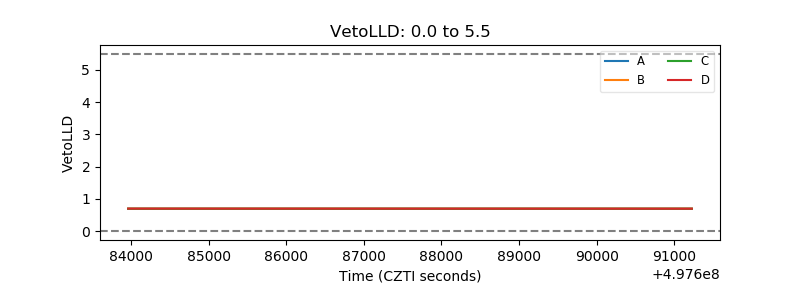 |
| Alpha Counter | 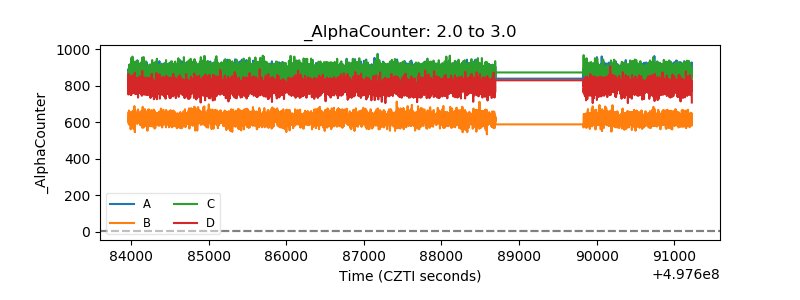 |
| _CPM_Rate | 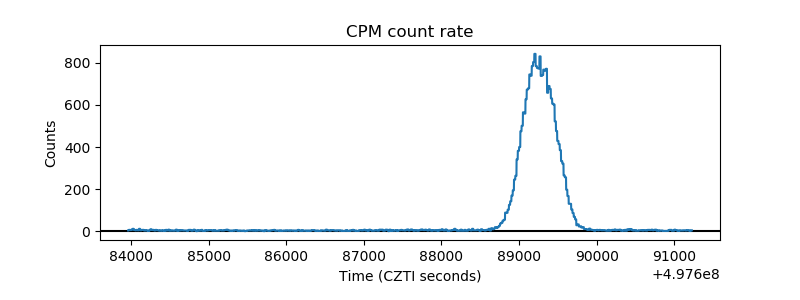 |
| CZT Counter | 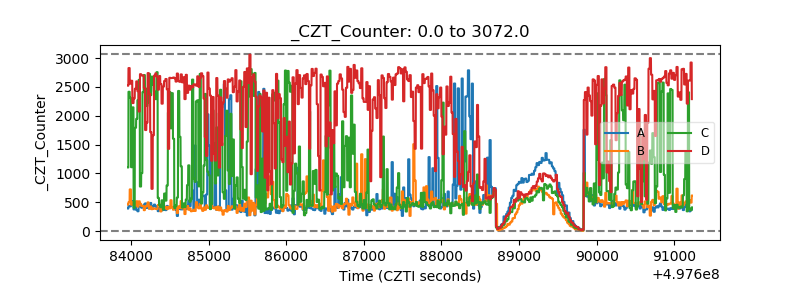 |
| +2.5 Volts monitor |  |
| +5 Volts monitor |  |
| _ROLL_ROT | 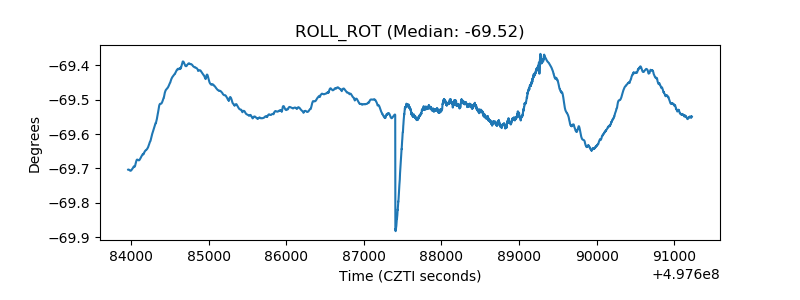 |
| _Roll_DEC | 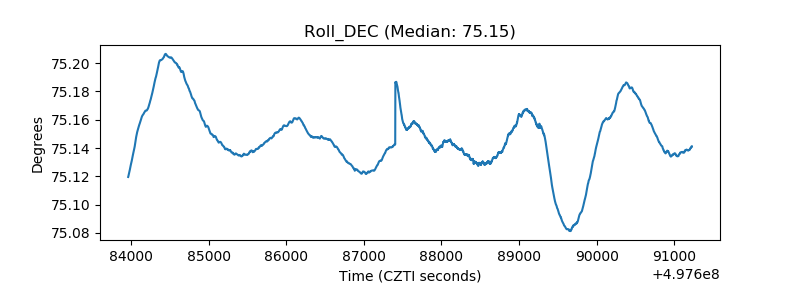 |
| _Roll_RA | 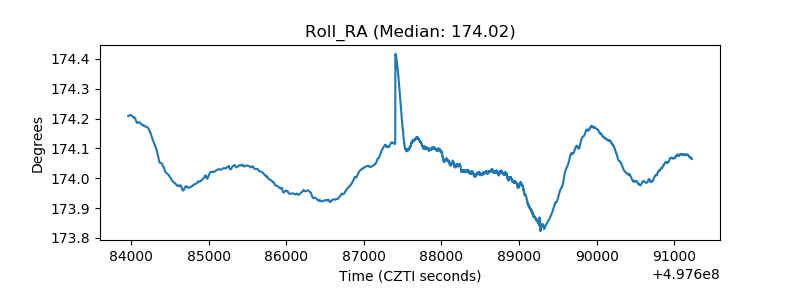 |
| Veto Counter | 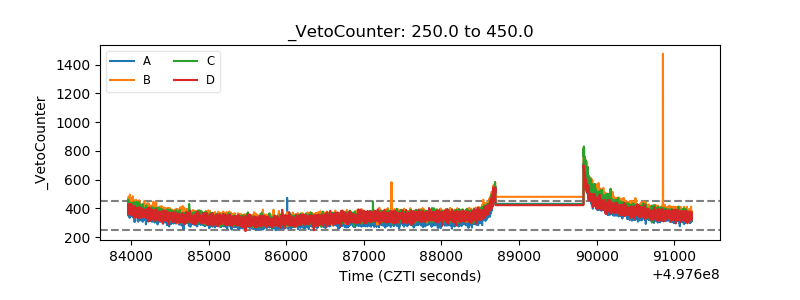 |