| Param | Original file | Final file |
|---|---|---|
| Filename | modeM0/AS1A14_126T15_9000006516_54269cztM0_level2.fits | modeM0/AS1A14_126T15_9000006516_54269cztM0_level2_quad_clean.evt |
| Size (bytes) | 681,681,600 | 83,001,600 |
| Size | 650.1 MB | 79.2 MB |
| Events in quadrant A | 2,790,446 | 633,914 |
| Events in quadrant B | 4,672,153 | 661,699 |
| Events in quadrant C | 4,826,942 | 544,617 |
| Events in quadrant D | 12,459,590 | 236,869 |
| Mode SS | |||
|---|---|---|---|
| Quadrant | BADHDUFLAG | Total packets | Discarded packets |
| A | 0 | 128 | 0 |
| B | 0 | 128 | 0 |
| C | 0 | 128 | 0 |
| D | 0 | 128 | 0 |
| Mode M0 | |||
|---|---|---|---|
| Quadrant | BADHDUFLAG | Total packets | Discarded packets |
| A | 0 | 12940 | 1 |
| B | 0 | 18193 | 1 |
| C | 0 | 18814 | 7 |
| D | 0 | 41274 | 1 |
| Mode M9 | |||
|---|---|---|---|
| Quadrant | BADHDUFLAG | Total packets | Discarded packets |
| A | 0 | 12 | 0 |
| B | 0 | 12 | 0 |
| C | 0 | 12 | 0 |
| D | 0 | 12 | 0 |
| Quadrant | Total seconds | Saturated seconds | Saturation percentage |
|---|---|---|---|
| A | 6242 | 62 | 0.993271% |
| B | 6243 | 254 | 4.068557% |
| C | 6242 | 610 | 9.772509% |
| D | 6242 | 3884 | 62.223646% |
Noise dominated data is calculated using 1-second bins in cleaned event files. If a bin has >2000 counts, and if more than 50% of those come from <1% of pixels, then it is considered to be noise-dominated and hence unusable.
| Quadrant | # 1 sec bins | Bins with >0 counts | Bins with >2000 counts | High rate bins dominated by noise | Noise dominated (total time) | Noise dominated (detector-on time) | Marked lightcurve |
|---|---|---|---|---|---|---|---|
| A | 7407 | 6243 | 29 | 29 | 0.39% | 0.46% | 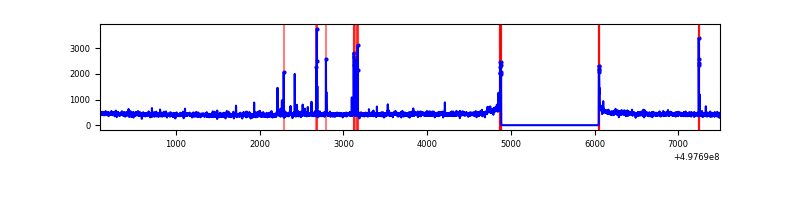 |
| B | 7408 | 6243 | 168 | 168 | 2.27% | 2.69% | 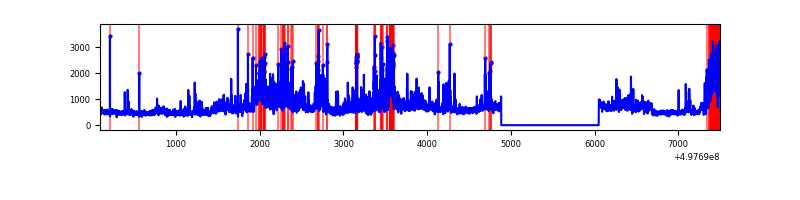 |
| C | 7406 | 6242 | 563 | 563 | 7.60% | 9.02% | 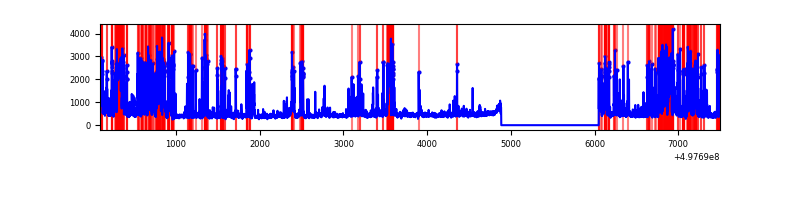 |
| D | 7407 | 6243 | 3754 | 3754 | 50.68% | 60.13% | 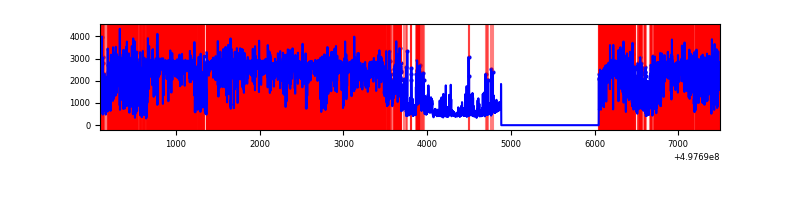 |
Top three noisy pixels from each quadrant. If the there are fewer than three noisy pixels in the level2.evt file, extra rows are filled as -1
| Pixel properties | Quadrant properties | ||||||
|---|---|---|---|---|---|---|---|
| Quadrant | DetID | PixID | Counts | Sigma | Mean | Median | Sigma |
| A | 0 | 8 | 67543 | 404.49 | 671 | 655 | 165.4 |
| A | 7 | 29 | 27198 | 160.51 | 671 | 655 | 165.4 |
| A | 11 | 3 | 19093 | 111.5 | 671 | 655 | 165.4 |
| B | 5 | 236 | 939324 | 6730.71 | 652 | 630 | 139.5 |
| B | 7 | 0 | 498397 | 3569.14 | 652 | 630 | 139.5 |
| B | 0 | 213 | 353678 | 2531.46 | 652 | 630 | 139.5 |
| C | 1 | 29 | 2148232 | 12731.01 | 609 | 603 | 168.7 |
| C | 14 | 254 | 117778 | 694.61 | 609 | 603 | 168.7 |
| C | 4 | 5 | 29418 | 170.81 | 609 | 603 | 168.7 |
| D | 8 | 176 | 9847716 | 81256.32 | 420 | 398 | 121.2 |
| D | 10 | 199 | 340537 | 2806.7 | 420 | 398 | 121.2 |
| D | 2 | 62 | 247712 | 2040.74 | 420 | 398 | 121.2 |
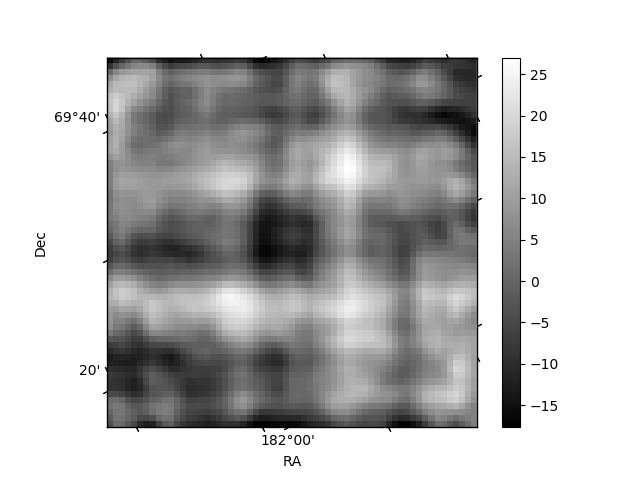
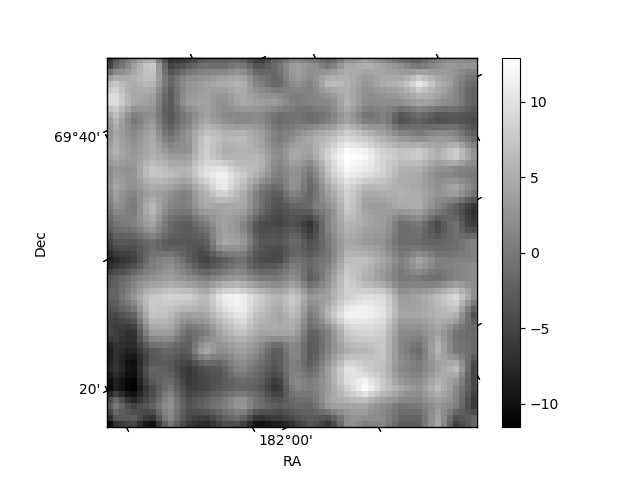
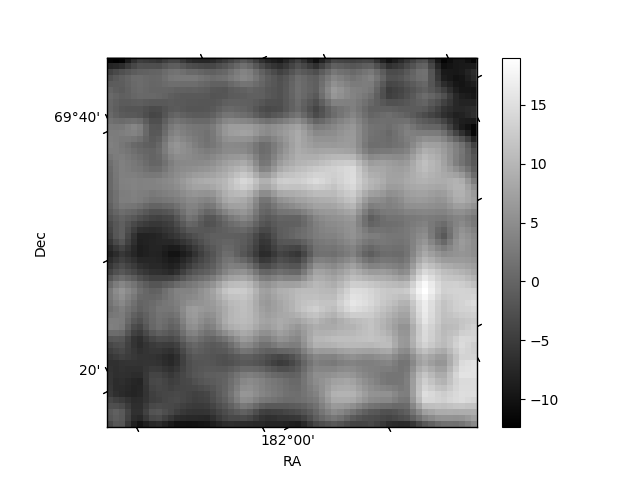
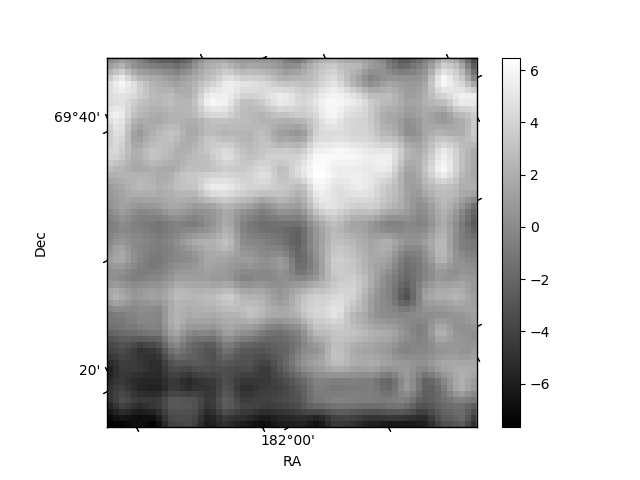
Histogram calculated using DETX and DETY for each event in the final _common_clean file
| Quadrant A | 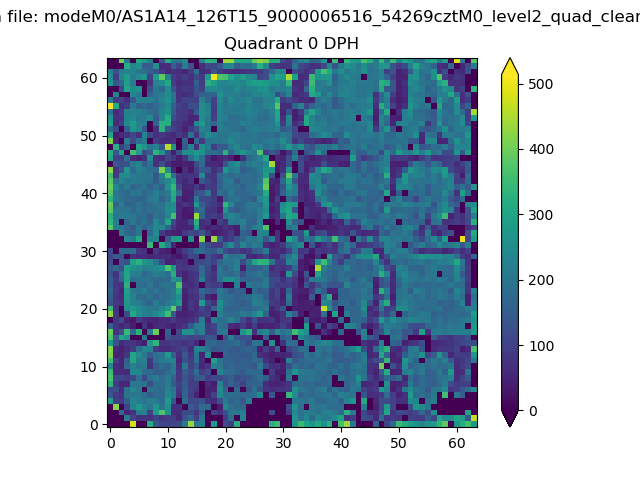 |
 |
Quadrant B |
|---|---|---|---|
| Quadrant D | 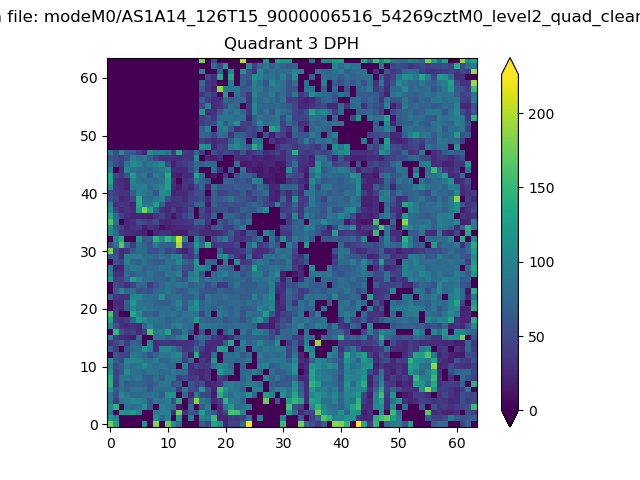 |
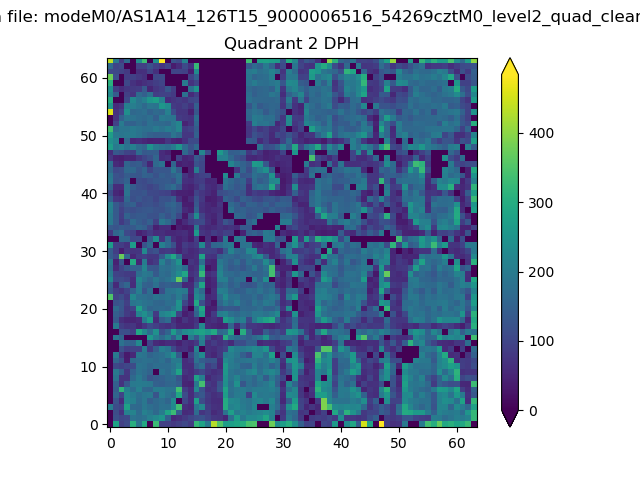 |
Quadrant C |
| Plot type | Count rate plots | Images |
|---|---|---|
| Comparison with Poisson distribution Blue bars denote a histogram of data divided into 1 sec bins. Red curve is a Poisson curve with rate = median count rate of data. |
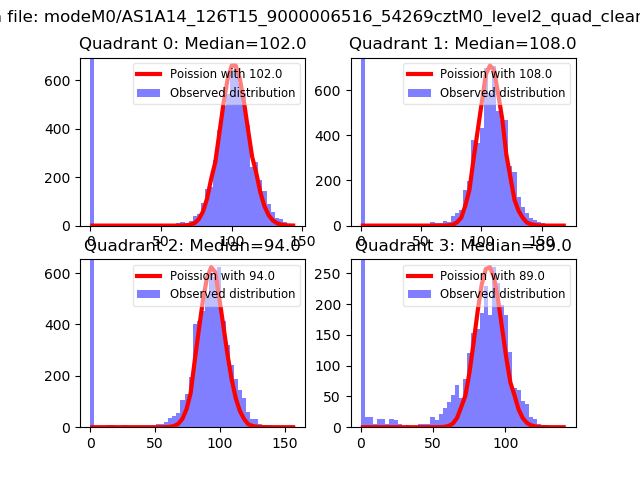 |
 |
| Quadrant-wise count rates Data is divided into 100 sec bins |
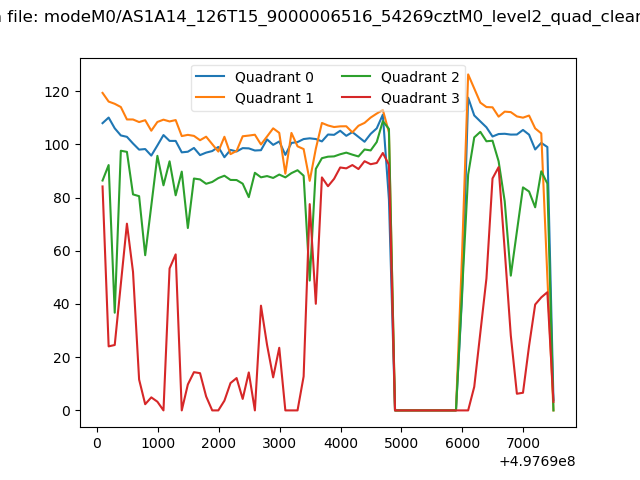 |
|
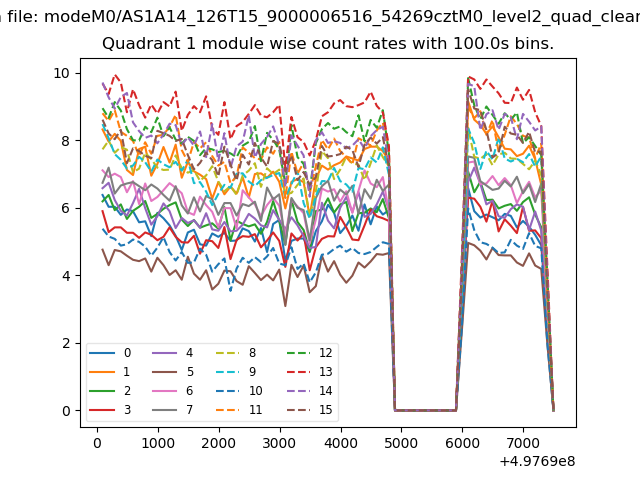
| Module-wise count rates for Quadrant A Data is divided into 100 sec bins |
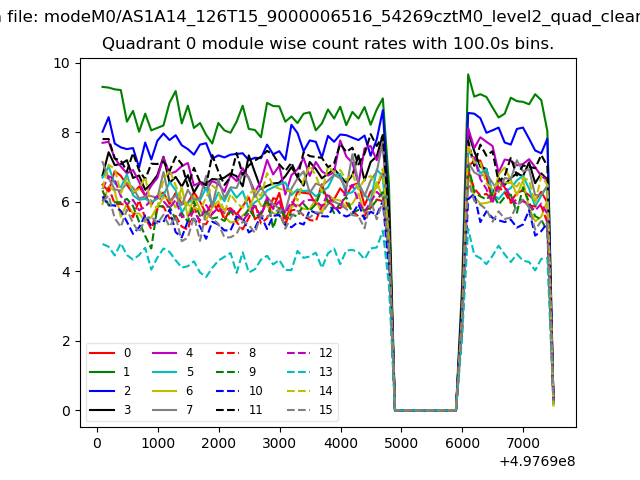 |
 |
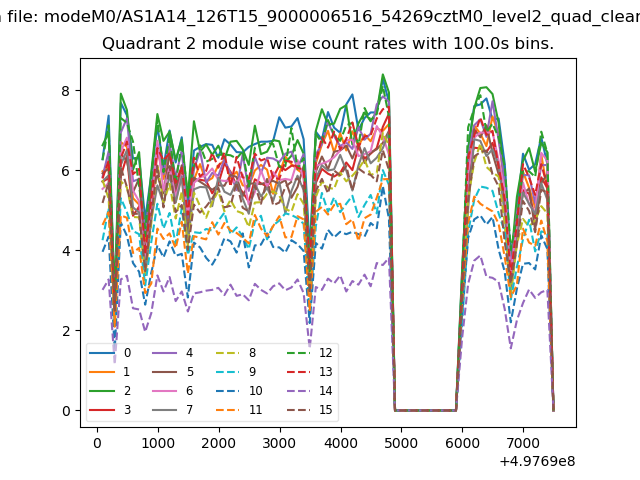
| Module-wise count rates for Quadrant B Data is divided into 100 sec bins |
 |
 |
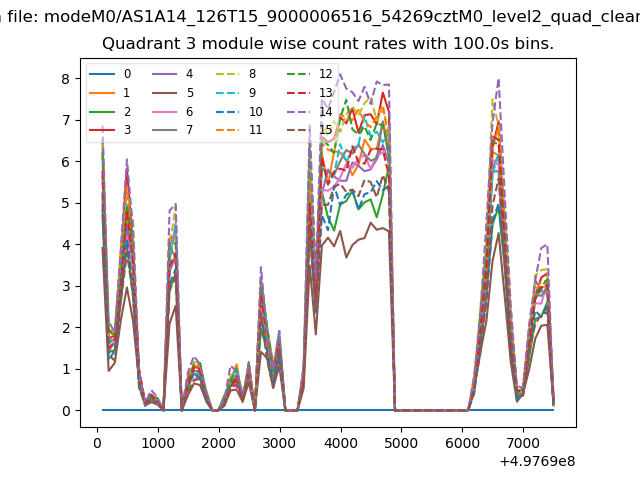
| Module-wise count rates for Quadrant C Data is divided into 100 sec bins |
 |
 |
| Module-wise count rates for Quadrant D Data is divided into 100 sec bins |
 |
 |
| Parameter | Plot |
|---|---|
| CZT HV Monitor | 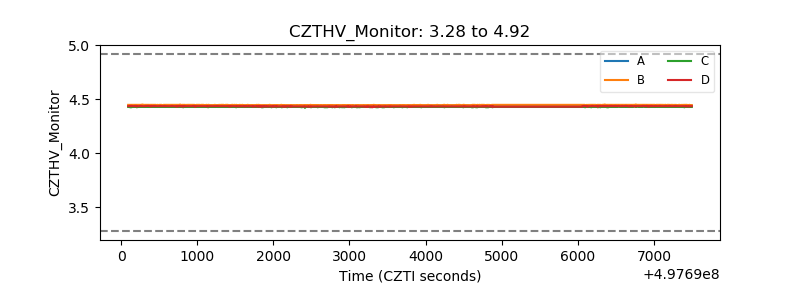 |
| D_VDD | 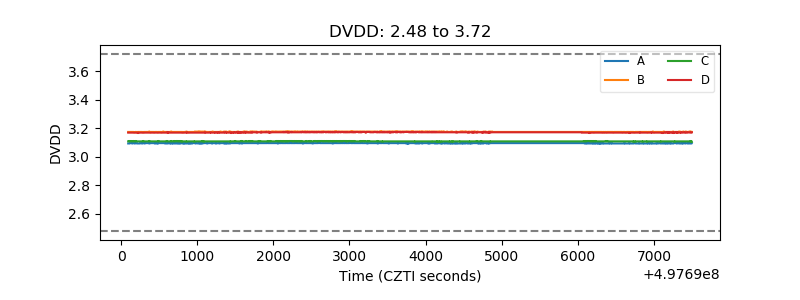 |
| Temperature 1 | 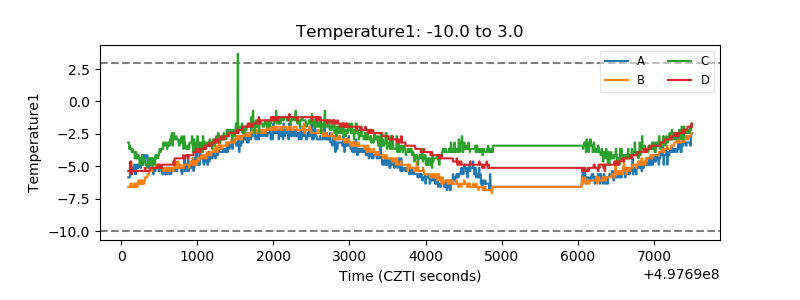 |
| Veto HV Monitor | 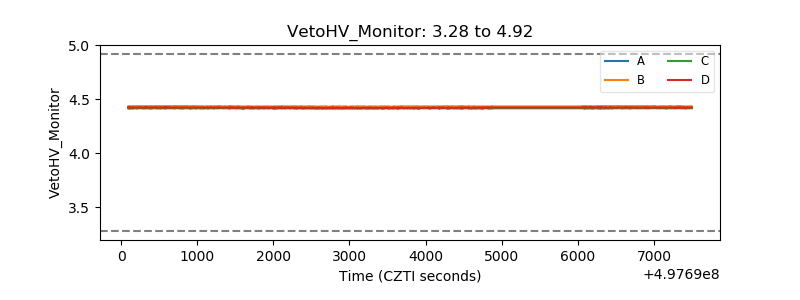 |
| Veto LLD | 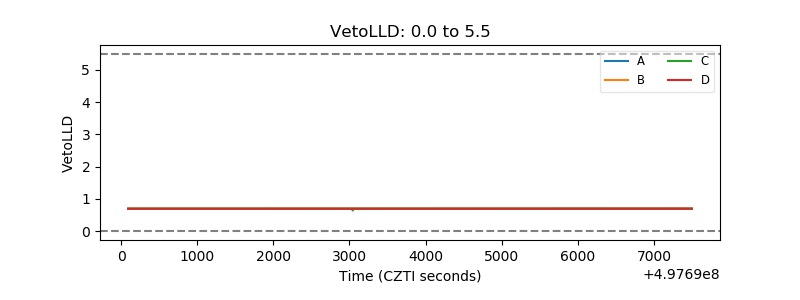 |
| Alpha Counter | 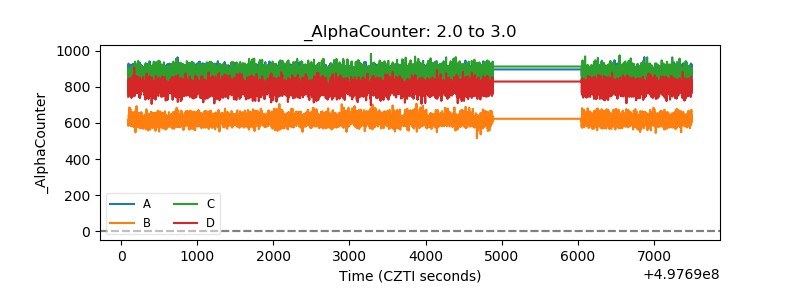 |
| _CPM_Rate | 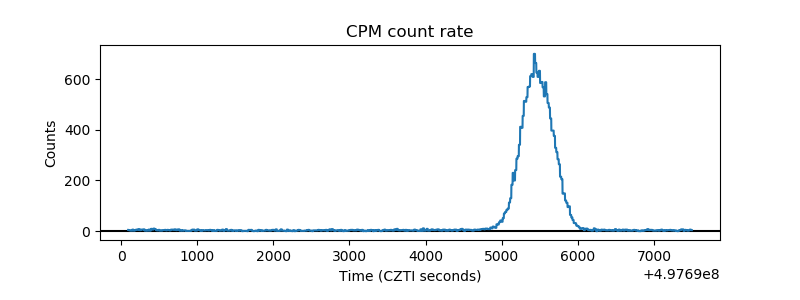 |
| CZT Counter | 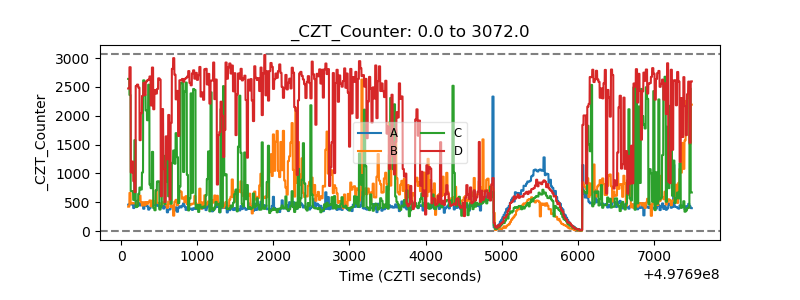 |
| +2.5 Volts monitor | 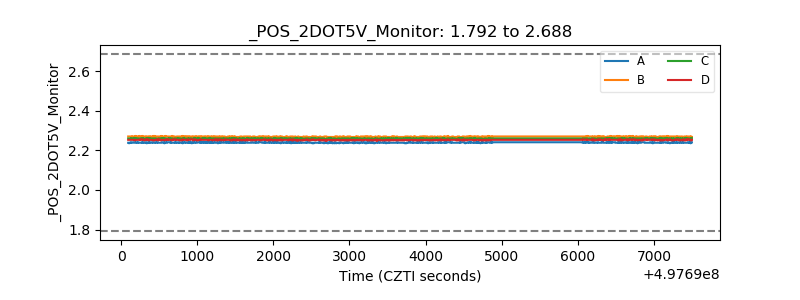 |
| +5 Volts monitor | 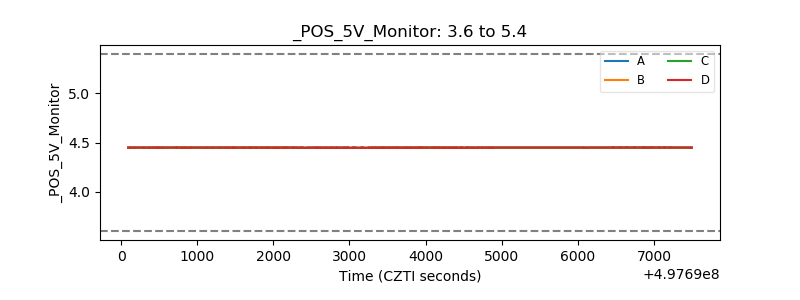 |
| _ROLL_ROT | 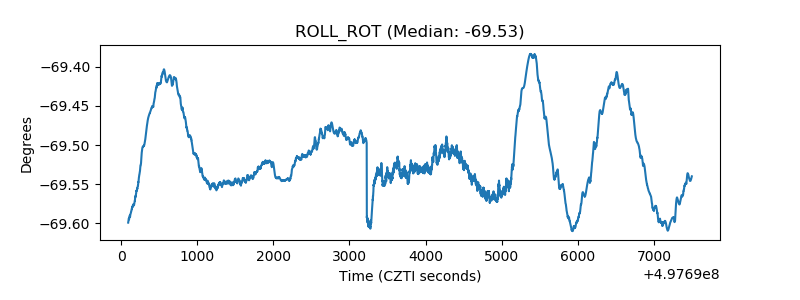 |
| _Roll_DEC | 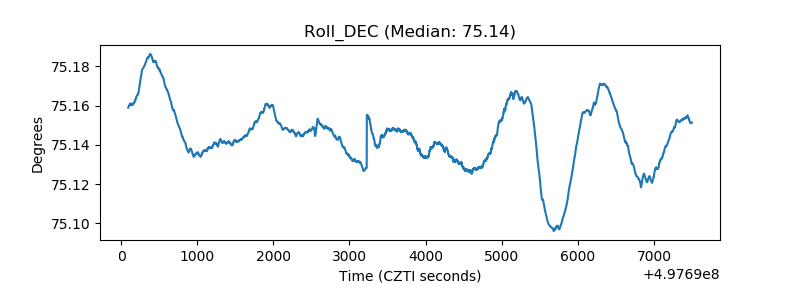 |
| _Roll_RA | 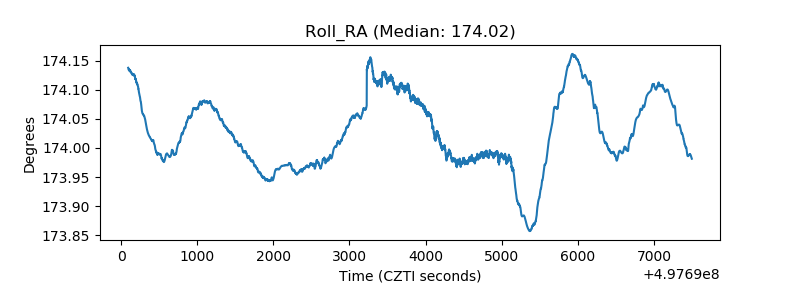 |
| Veto Counter | 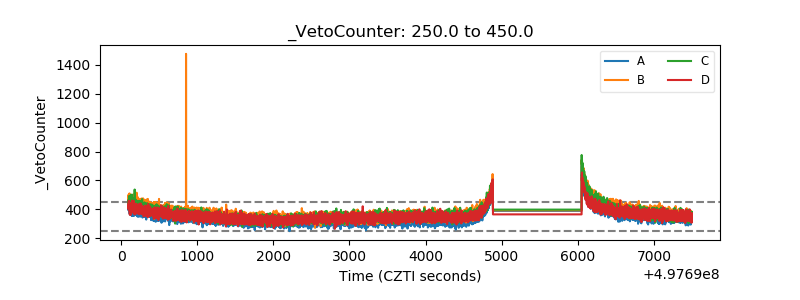 |