| Param | Original file | Final file |
|---|---|---|
| Filename | modeM0/AS1A14_126T15_9000006516_54270cztM0_level2.fits | modeM0/AS1A14_126T15_9000006516_54270cztM0_level2_quad_clean.evt |
| Size (bytes) | 684,714,240 | 76,818,240 |
| Size | 653.0 MB | 73.3 MB |
| Events in quadrant A | 2,715,697 | 602,177 |
| Events in quadrant B | 5,865,212 | 547,405 |
| Events in quadrant C | 5,078,049 | 509,633 |
| Events in quadrant D | 11,217,086 | 244,317 |
| Mode SS | |||
|---|---|---|---|
| Quadrant | BADHDUFLAG | Total packets | Discarded packets |
| A | 0 | 122 | 0 |
| B | 0 | 122 | 0 |
| C | 0 | 122 | 0 |
| D | 0 | 122 | 0 |
| Mode M0 | |||
|---|---|---|---|
| Quadrant | BADHDUFLAG | Total packets | Discarded packets |
| A | 0 | 12580 | 1 |
| B | 0 | 21593 | 1 |
| C | 0 | 19339 | 1 |
| D | 0 | 37494 | 4 |
| Mode M9 | |||
|---|---|---|---|
| Quadrant | BADHDUFLAG | Total packets | Discarded packets |
| A | 0 | 11 | 0 |
| B | 0 | 11 | 0 |
| C | 0 | 11 | 0 |
| D | 0 | 11 | 0 |
| Quadrant | Total seconds | Saturated seconds | Saturation percentage |
|---|---|---|---|
| A | 6049 | 114 | 1.884609% |
| B | 6050 | 1108 | 18.314050% |
| C | 6050 | 729 | 12.049587% |
| D | 6049 | 3509 | 58.009588% |
Noise dominated data is calculated using 1-second bins in cleaned event files. If a bin has >2000 counts, and if more than 50% of those come from <1% of pixels, then it is considered to be noise-dominated and hence unusable.
| Quadrant | # 1 sec bins | Bins with >0 counts | Bins with >2000 counts | High rate bins dominated by noise | Noise dominated (total time) | Noise dominated (detector-on time) | Marked lightcurve |
|---|---|---|---|---|---|---|---|
| A | 7109 | 6049 | 12 | 12 | 0.17% | 0.20% | 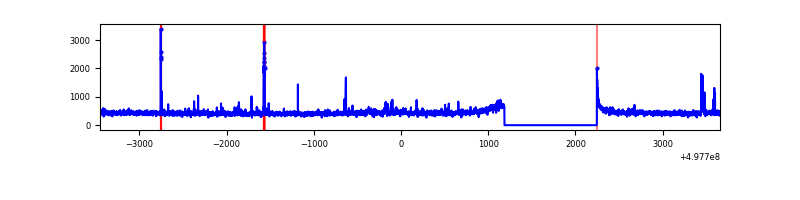 |
| B | 7110 | 6051 | 855 | 855 | 12.03% | 14.13% | 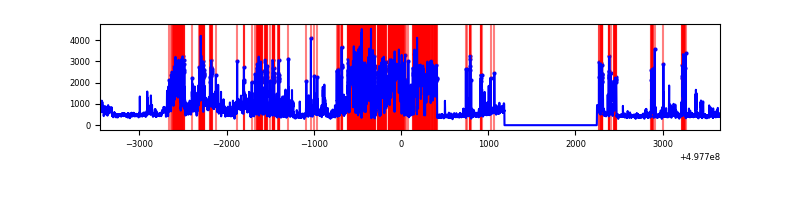 |
| C | 7110 | 6051 | 654 | 654 | 9.20% | 10.81% | 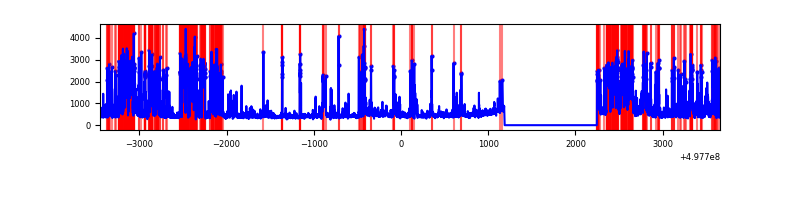 |
| D | 7109 | 6049 | 3222 | 3222 | 45.32% | 53.27% | 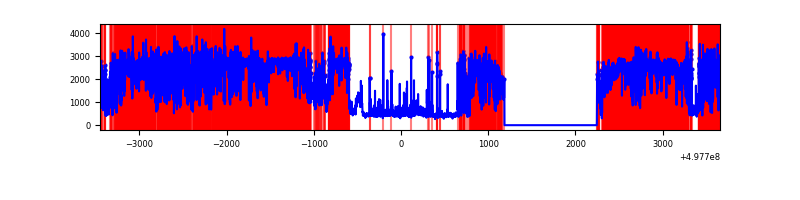 |
Top three noisy pixels from each quadrant. If the there are fewer than three noisy pixels in the level2.evt file, extra rows are filled as -1
| Pixel properties | Quadrant properties | ||||||
|---|---|---|---|---|---|---|---|
| Quadrant | DetID | PixID | Counts | Sigma | Mean | Median | Sigma |
| A | 11 | 3 | 52523 | 323.88 | 649 | 634 | 160.2 |
| A | 15 | 174 | 47801 | 294.4 | 649 | 634 | 160.2 |
| A | 13 | 254 | 14623 | 87.32 | 649 | 634 | 160.2 |
| B | 5 | 236 | 2268187 | 17755.31 | 592 | 572 | 127.7 |
| B | 0 | 213 | 352139 | 2752.75 | 592 | 572 | 127.7 |
| B | 7 | 0 | 249589 | 1949.79 | 592 | 572 | 127.7 |
| C | 1 | 29 | 2154048 | 13318.81 | 587 | 580 | 161.7 |
| C | 4 | 5 | 184890 | 1139.92 | 587 | 580 | 161.7 |
| C | 14 | 254 | 147399 | 908.05 | 587 | 580 | 161.7 |
| D | 8 | 176 | 9242032 | 79108.52 | 408 | 389 | 116.8 |
| D | 3 | 12 | 113269 | 966.25 | 408 | 389 | 116.8 |
| D | 2 | 120 | 59282 | 504.12 | 408 | 389 | 116.8 |
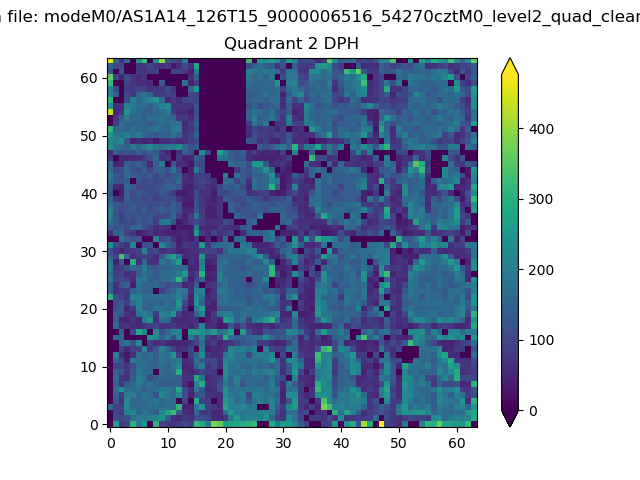
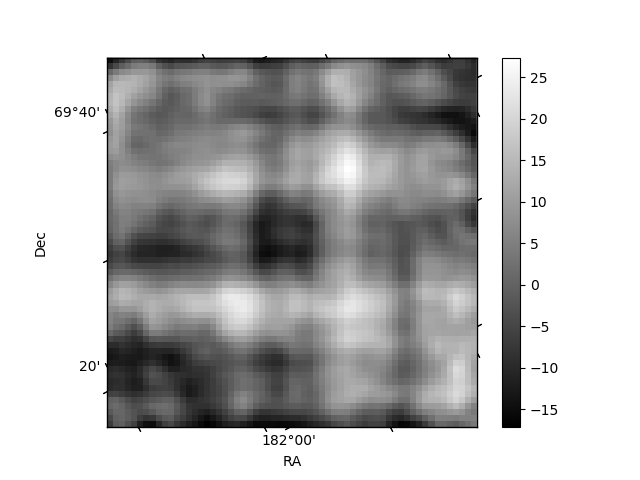
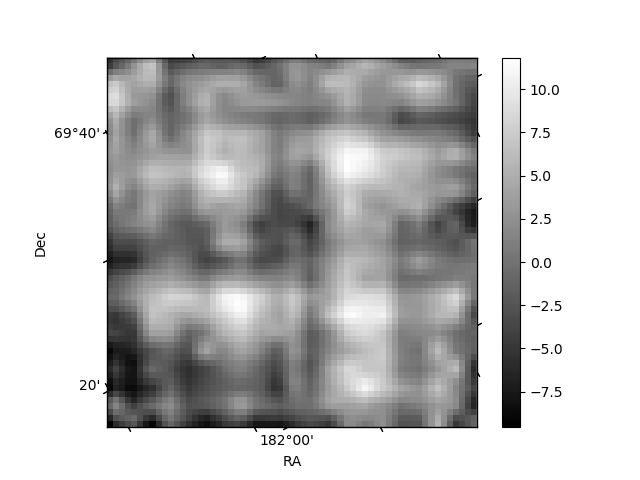
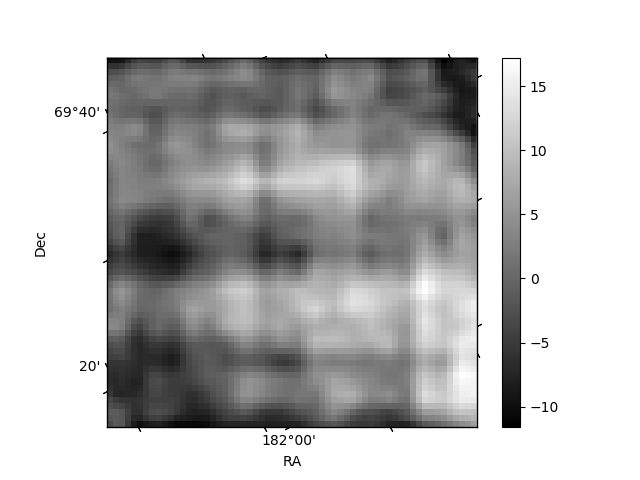
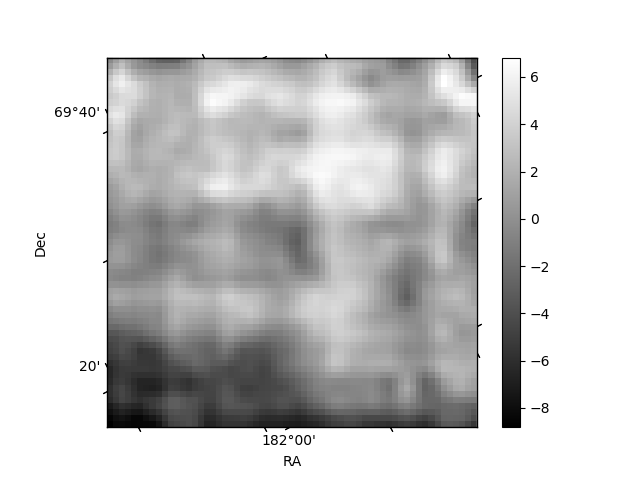
Histogram calculated using DETX and DETY for each event in the final _common_clean file
| Quadrant A | 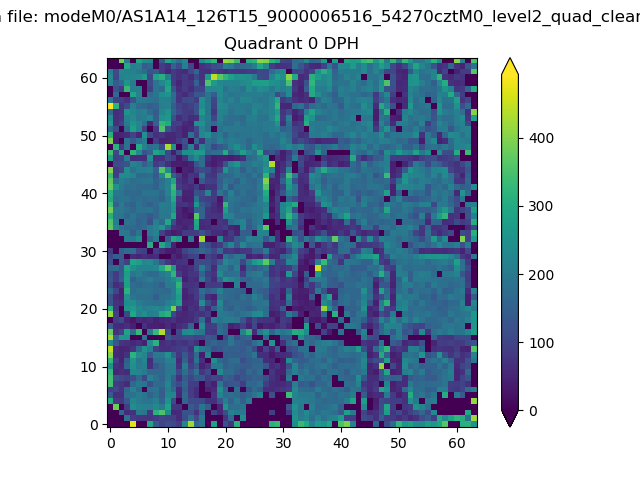 |
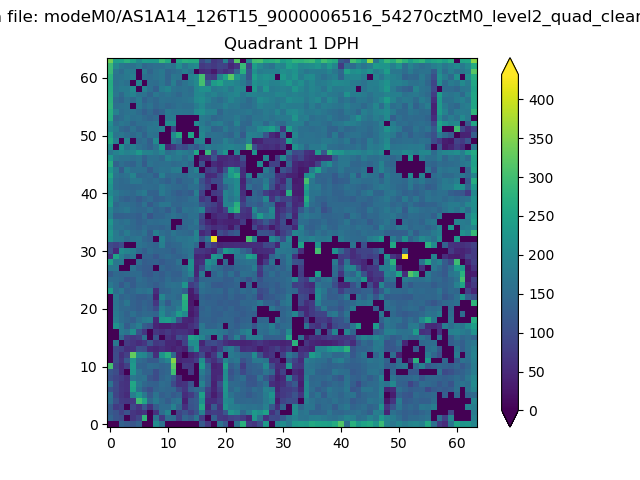 |
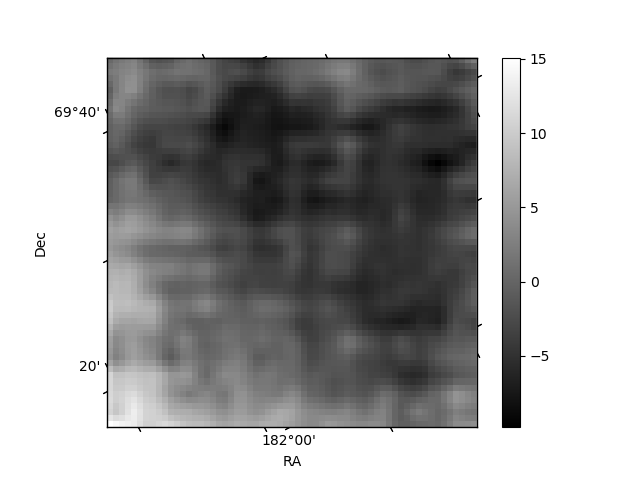
Quadrant B |
|---|---|---|---|
| Quadrant D | 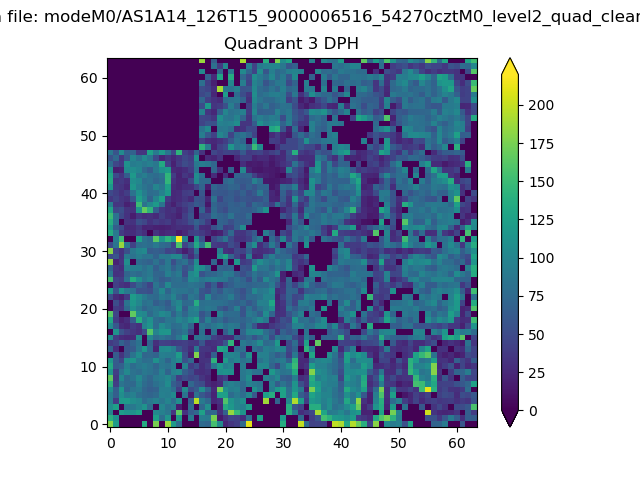 |
 |
Quadrant C |
| Plot type | Count rate plots | Images |
|---|---|---|
| Comparison with Poisson distribution Blue bars denote a histogram of data divided into 1 sec bins. Red curve is a Poisson curve with rate = median count rate of data. |
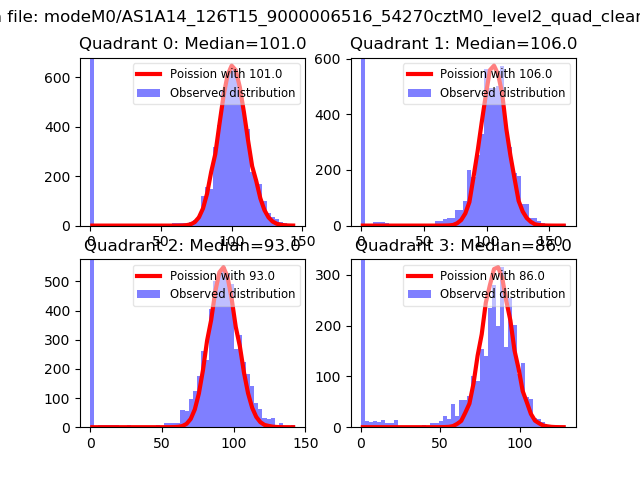 |
 |
| Quadrant-wise count rates Data is divided into 100 sec bins |
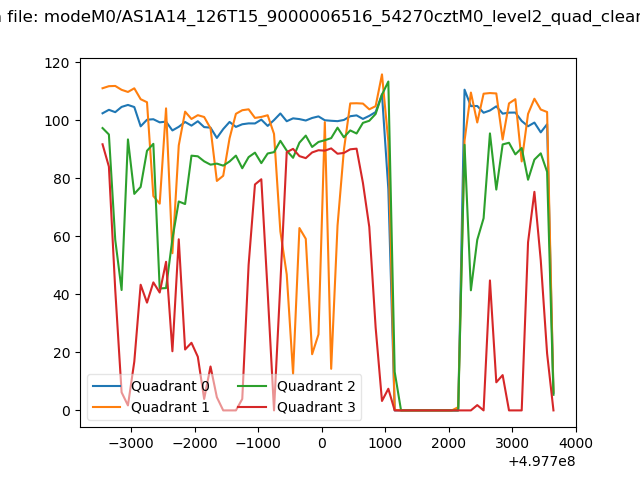 |
|
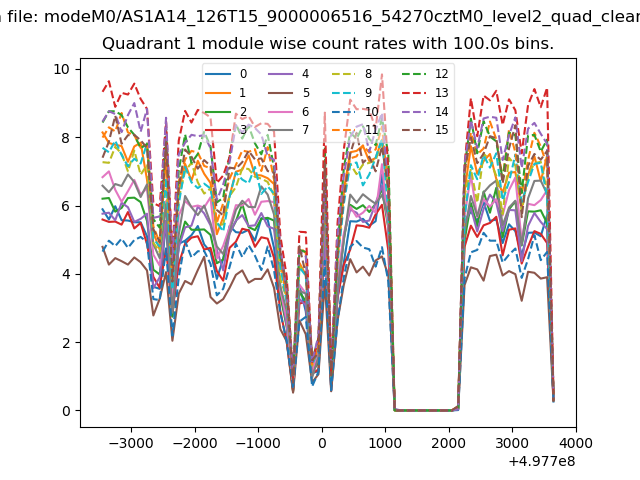
| Module-wise count rates for Quadrant A Data is divided into 100 sec bins |
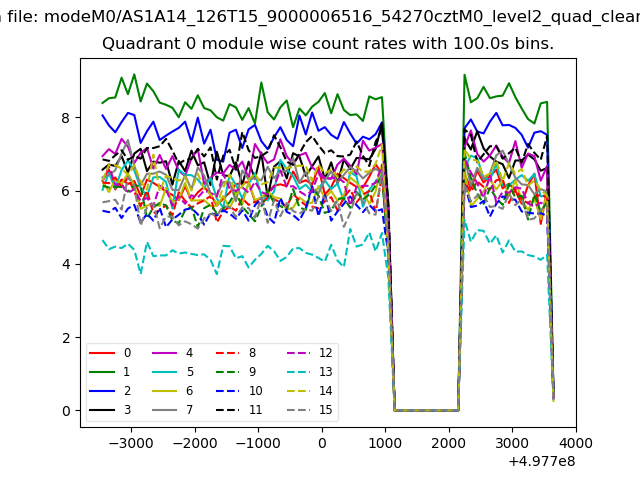 |
 |
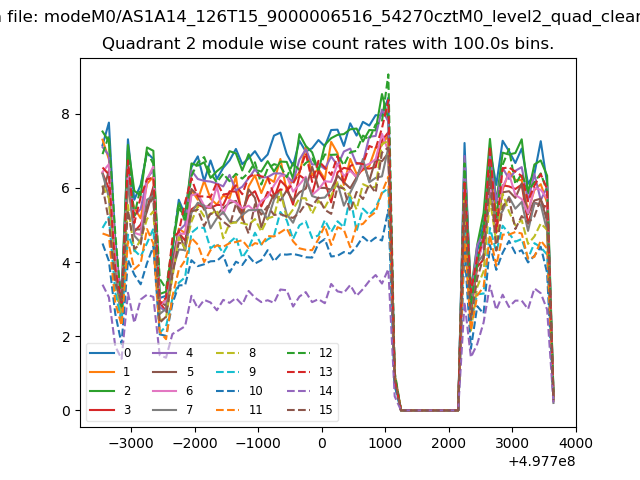
| Module-wise count rates for Quadrant B Data is divided into 100 sec bins |
 |
 |
| Module-wise count rates for Quadrant C Data is divided into 100 sec bins |
 |
 |
| Module-wise count rates for Quadrant D Data is divided into 100 sec bins |
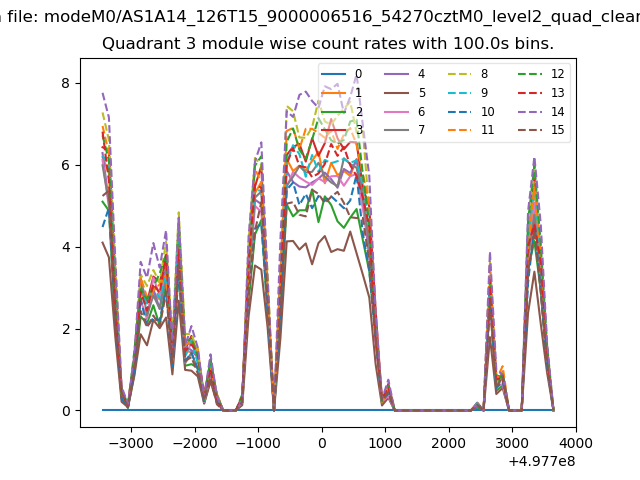 |
 |
| Parameter | Plot |
|---|---|
| CZT HV Monitor | 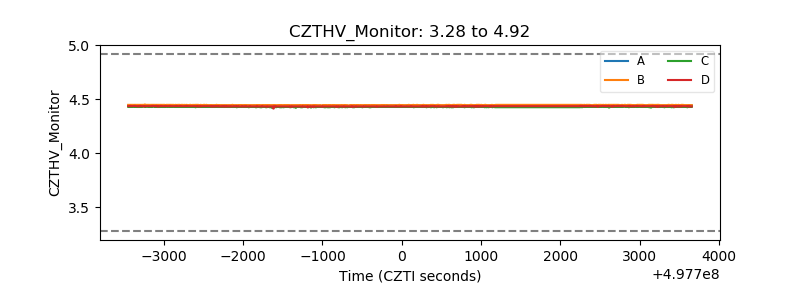 |
| D_VDD | 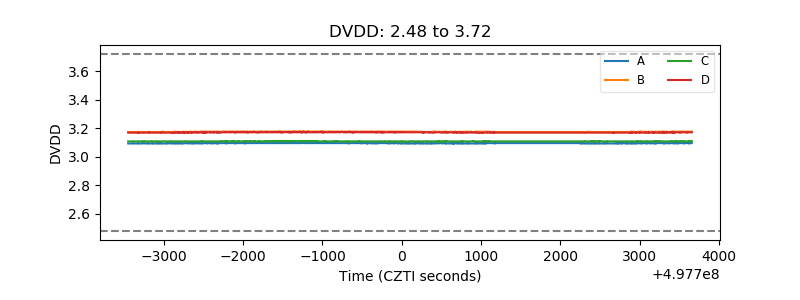 |
| Temperature 1 | 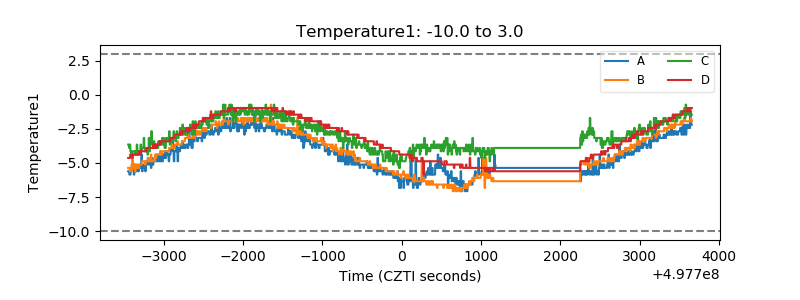 |
| Veto HV Monitor | 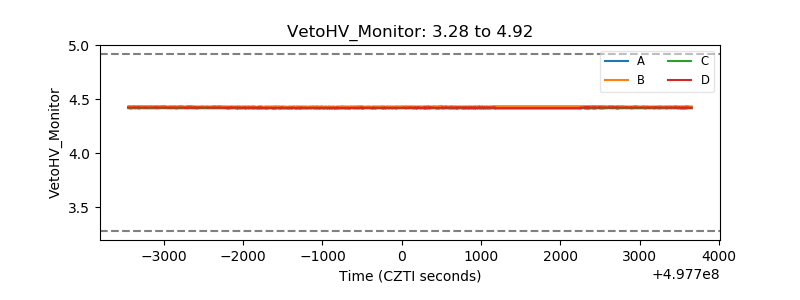 |
| Veto LLD | 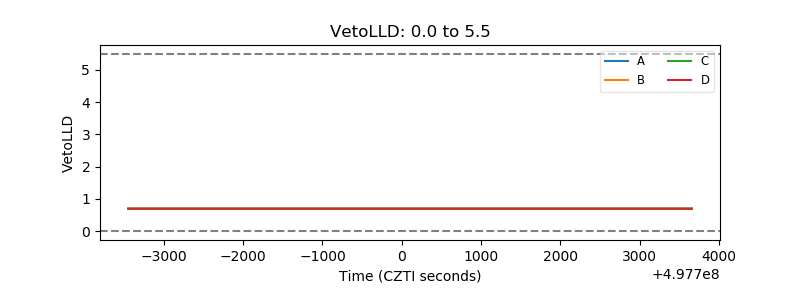 |
| Alpha Counter | 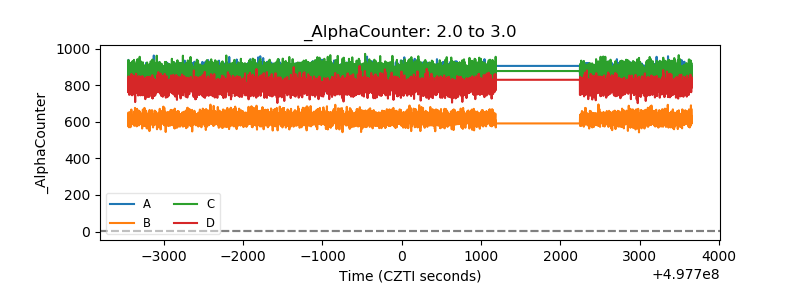 |
| _CPM_Rate | 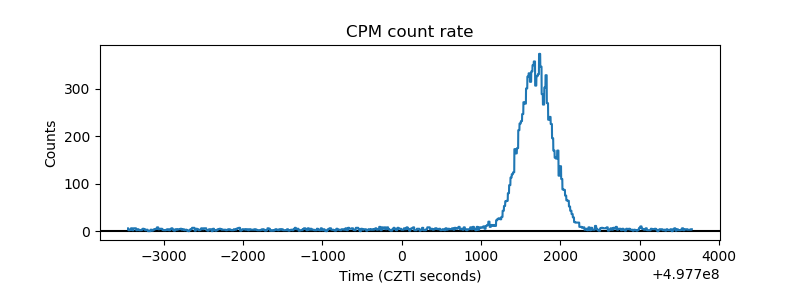 |
| CZT Counter | 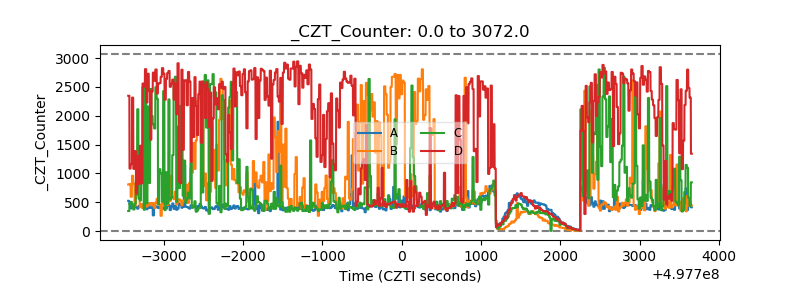 |
| +2.5 Volts monitor | 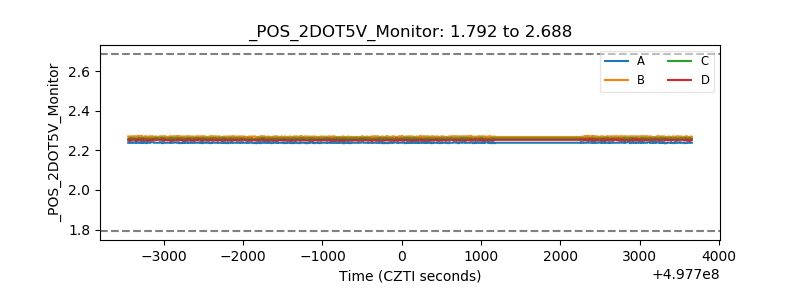 |
| +5 Volts monitor |  |
| _ROLL_ROT | 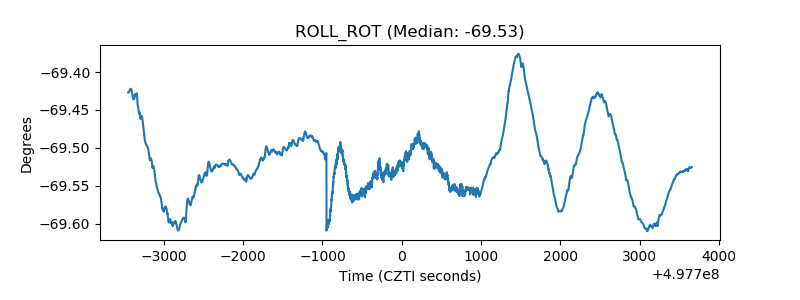 |
| _Roll_DEC | 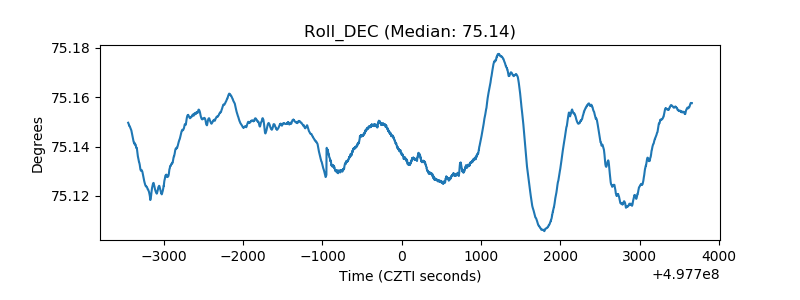 |
| _Roll_RA | 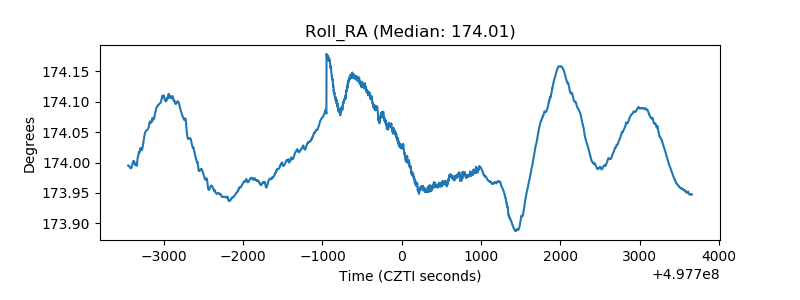 |
| Veto Counter | 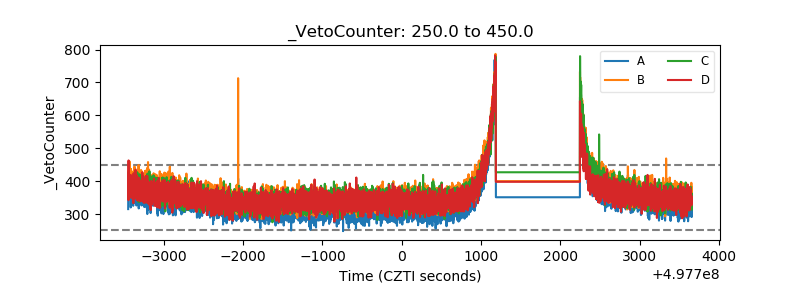 |