| Param | Original file | Final file |
|---|---|---|
| Filename | modeM0/AS1A14_126T15_9000006516_54271cztM0_level2.fits | modeM0/AS1A14_126T15_9000006516_54271cztM0_level2_quad_clean.evt |
| Size (bytes) | 496,434,240 | 82,255,680 |
| Size | 473.4 MB | 78.4 MB |
| Events in quadrant A | 2,645,659 | 586,440 |
| Events in quadrant B | 3,508,919 | 612,932 |
| Events in quadrant C | 3,398,931 | 537,240 |
| Events in quadrant D | 8,354,616 | 333,997 |
| Mode SS | |||
|---|---|---|---|
| Quadrant | BADHDUFLAG | Total packets | Discarded packets |
| A | 0 | 124 | 0 |
| B | 0 | 124 | 0 |
| C | 0 | 124 | 0 |
| D | 0 | 124 | 0 |
| Mode M0 | |||
|---|---|---|---|
| Quadrant | BADHDUFLAG | Total packets | Discarded packets |
| A | 0 | 12388 | 1 |
| B | 0 | 14597 | 1 |
| C | 0 | 14567 | 1 |
| D | 0 | 29081 | 1 |
| Mode M9 | |||
|---|---|---|---|
| Quadrant | BADHDUFLAG | Total packets | Discarded packets |
| A | 0 | 10 | 0 |
| B | 0 | 10 | 0 |
| C | 0 | 10 | 0 |
| D | 0 | 10 | 0 |
| Quadrant | Total seconds | Saturated seconds | Saturation percentage |
|---|---|---|---|
| A | 6014 | 61 | 1.014300% |
| B | 6015 | 197 | 3.275145% |
| C | 6015 | 166 | 2.759767% |
| D | 6015 | 2257 | 37.522860% |
Noise dominated data is calculated using 1-second bins in cleaned event files. If a bin has >2000 counts, and if more than 50% of those come from <1% of pixels, then it is considered to be noise-dominated and hence unusable.
| Quadrant | # 1 sec bins | Bins with >0 counts | Bins with >2000 counts | High rate bins dominated by noise | Noise dominated (total time) | Noise dominated (detector-on time) | Marked lightcurve |
|---|---|---|---|---|---|---|---|
| A | 6979 | 6014 | 8 | 8 | 0.11% | 0.13% | 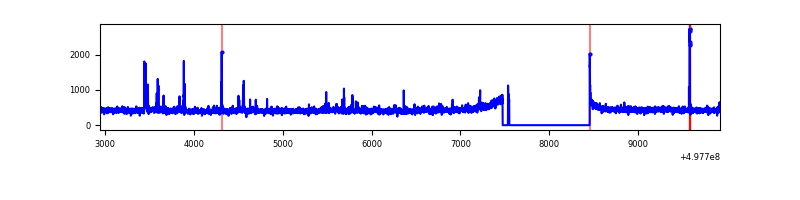 |
| B | 6980 | 6016 | 129 | 129 | 1.85% | 2.14% | 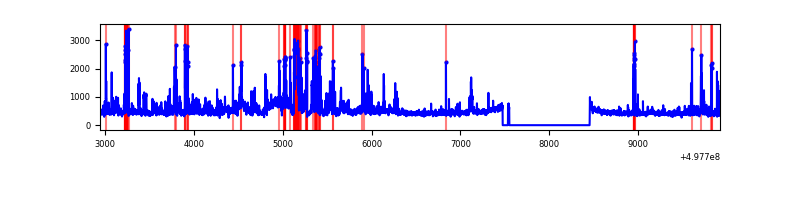 |
| C | 6980 | 6016 | 137 | 137 | 1.96% | 2.28% | 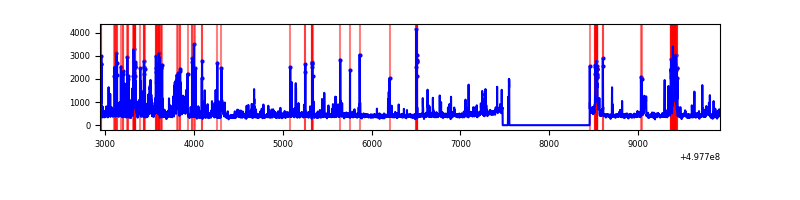 |
| D | 6980 | 6015 | 2114 | 2114 | 30.29% | 35.15% | 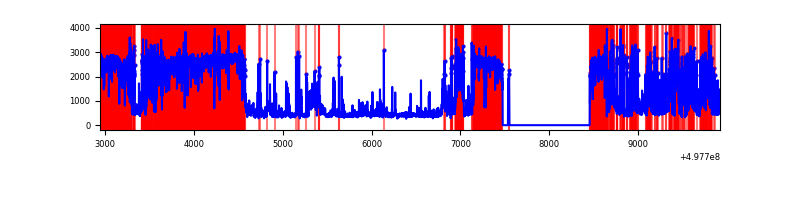 |
Top three noisy pixels from each quadrant. If the there are fewer than three noisy pixels in the level2.evt file, extra rows are filled as -1
| Pixel properties | Quadrant properties | ||||||
|---|---|---|---|---|---|---|---|
| Quadrant | DetID | PixID | Counts | Sigma | Mean | Median | Sigma |
| A | 15 | 174 | 49755 | 314.52 | 633 | 616 | 156.2 |
| A | 11 | 3 | 32567 | 204.51 | 633 | 616 | 156.2 |
| A | 4 | 3 | 24288 | 151.52 | 633 | 616 | 156.2 |
| B | 0 | 213 | 361446 | 2751.93 | 614 | 594 | 131.1 |
| B | 7 | 0 | 227206 | 1728.19 | 614 | 594 | 131.1 |
| B | 5 | 185 | 146098 | 1109.64 | 614 | 594 | 131.1 |
| C | 1 | 29 | 580954 | 3544.15 | 599 | 593 | 163.8 |
| C | 4 | 5 | 200262 | 1219.34 | 599 | 593 | 163.8 |
| C | 12 | 2 | 76870 | 465.81 | 599 | 593 | 163.8 |
| D | 8 | 176 | 5573722 | 42102.46 | 460 | 439 | 132.4 |
| D | 6 | 239 | 245975 | 1854.86 | 460 | 439 | 132.4 |
| D | 12 | 2 | 164689 | 1240.8 | 460 | 439 | 132.4 |
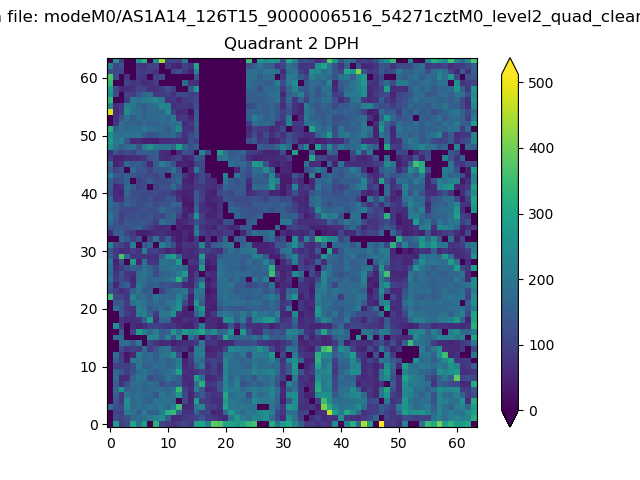
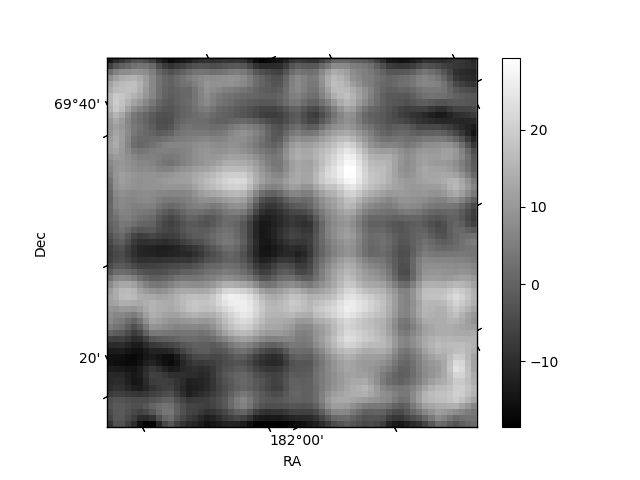
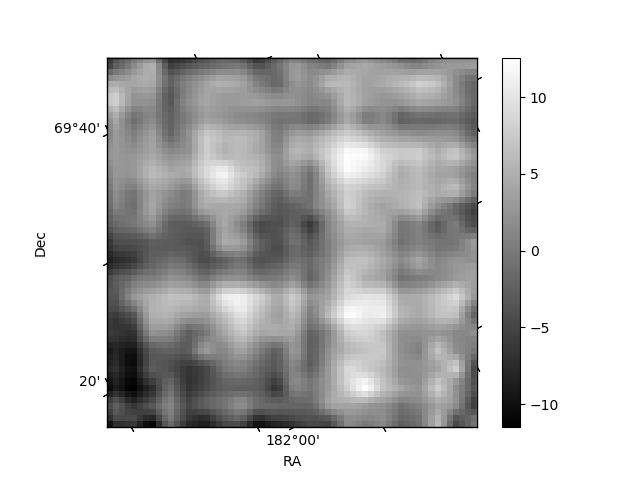
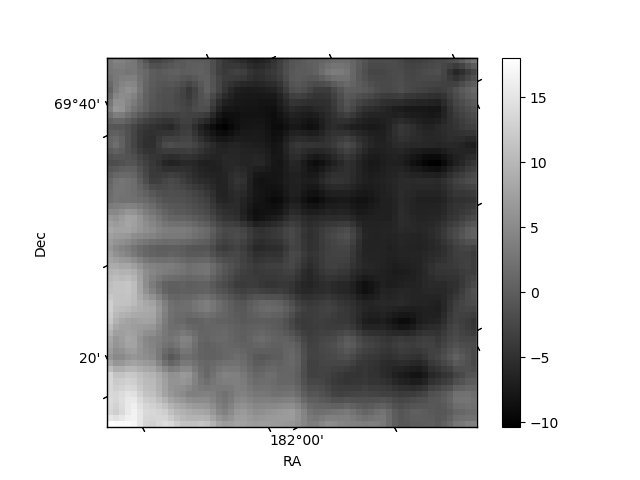
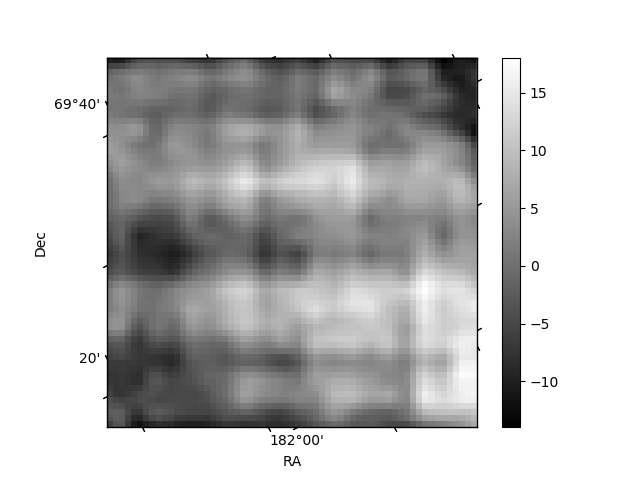
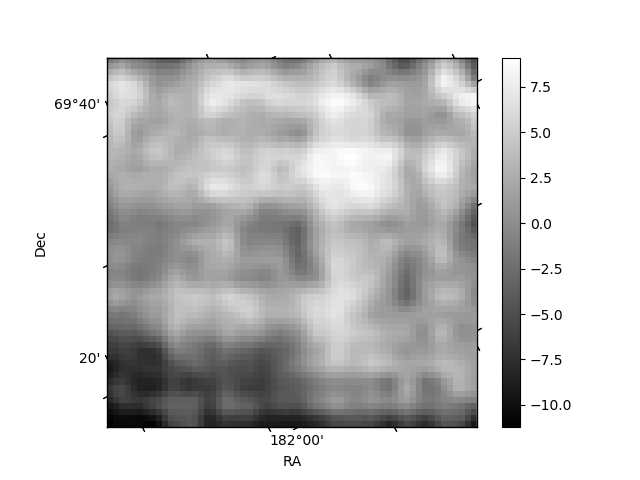
Histogram calculated using DETX and DETY for each event in the final _common_clean file
| Quadrant A | 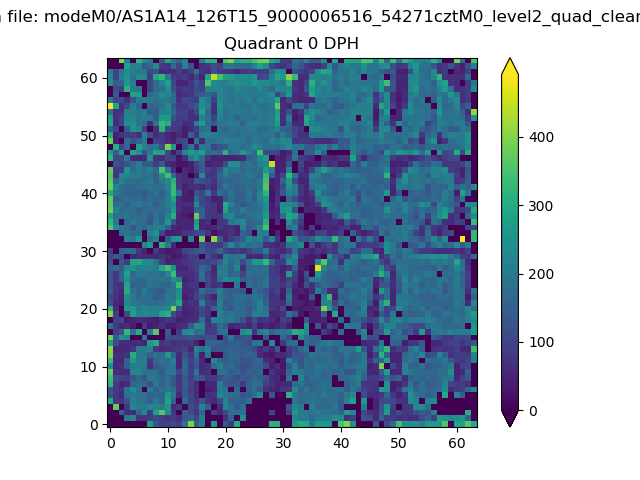 |
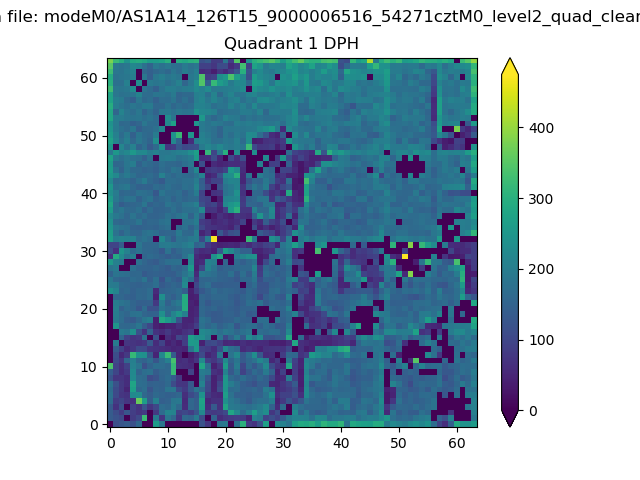 |
Quadrant B |
|---|---|---|---|
| Quadrant D | 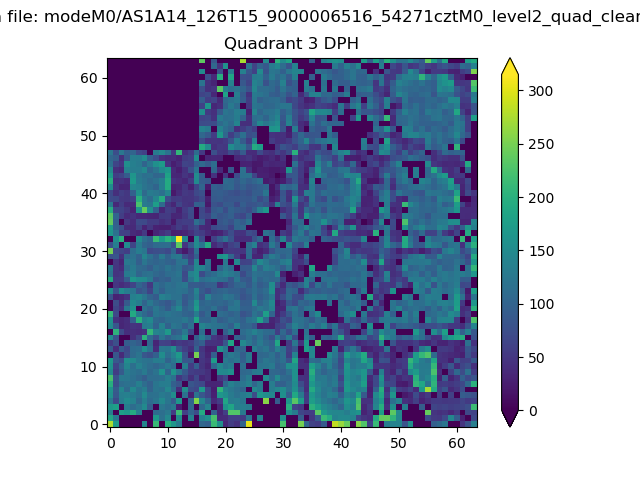 |
 |
Quadrant C |
| Plot type | Count rate plots | Images |
|---|---|---|
| Comparison with Poisson distribution Blue bars denote a histogram of data divided into 1 sec bins. Red curve is a Poisson curve with rate = median count rate of data. |
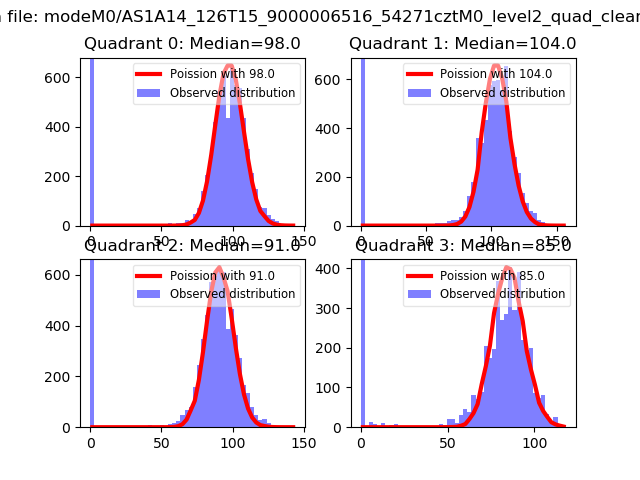 |
 |
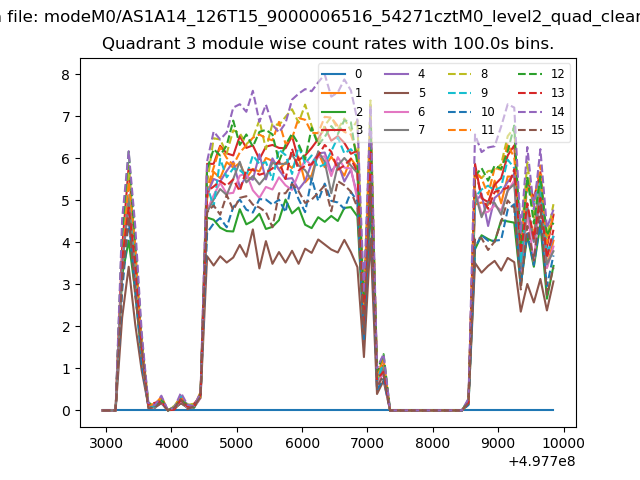
| Quadrant-wise count rates Data is divided into 100 sec bins |
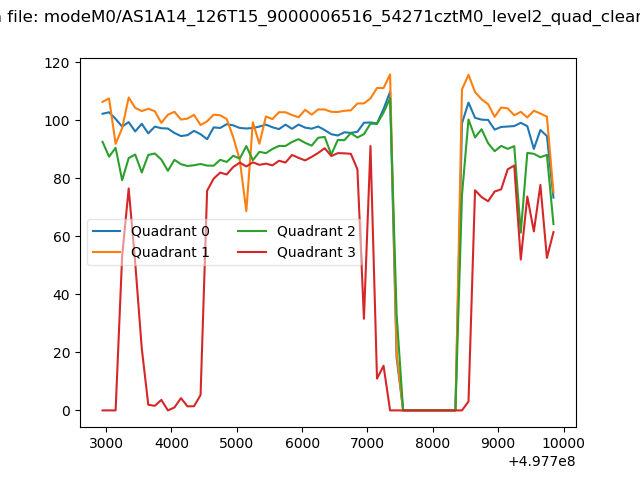 |
|
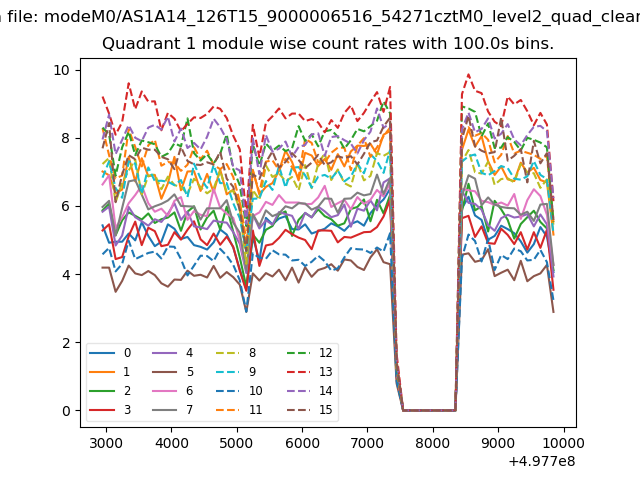
| Module-wise count rates for Quadrant A Data is divided into 100 sec bins |
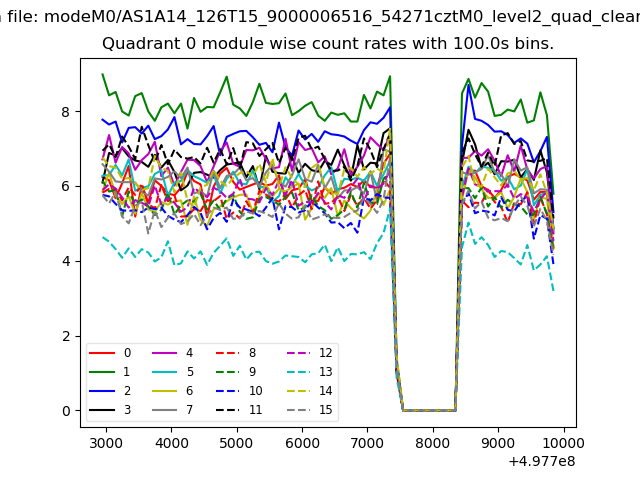 |
 |
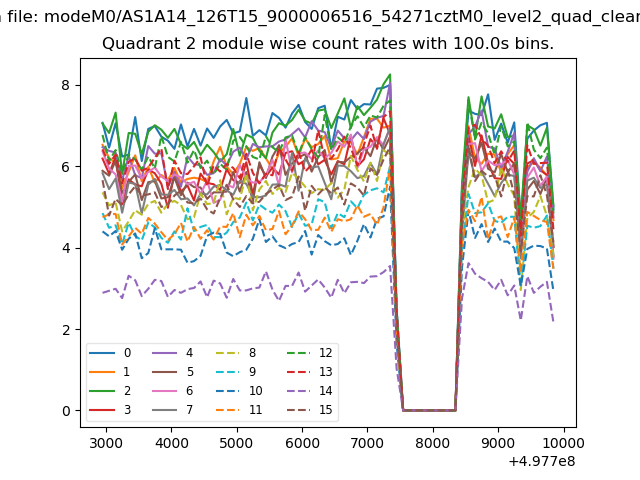
| Module-wise count rates for Quadrant B Data is divided into 100 sec bins |
 |
 |
| Module-wise count rates for Quadrant C Data is divided into 100 sec bins |
 |
 |
| Module-wise count rates for Quadrant D Data is divided into 100 sec bins |
 |
 |
| Parameter | Plot |
|---|---|
| CZT HV Monitor | 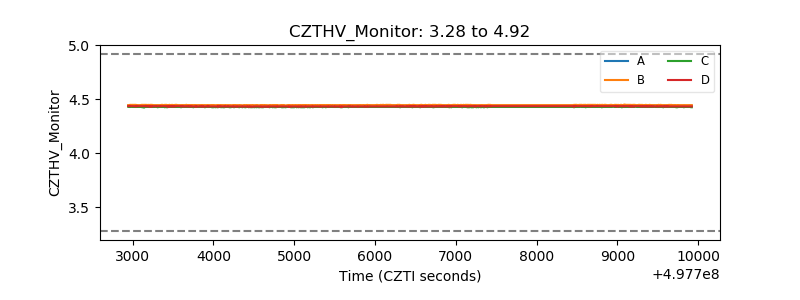 |
| D_VDD | 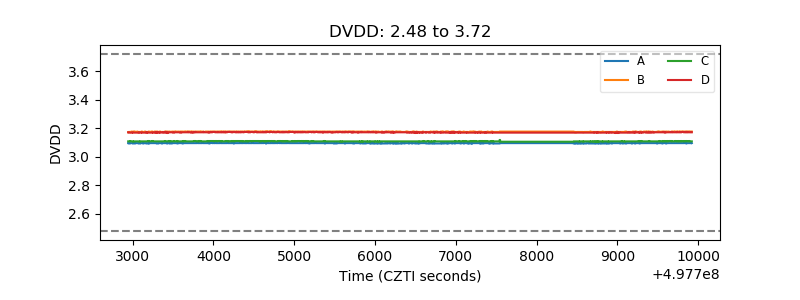 |
| Temperature 1 | 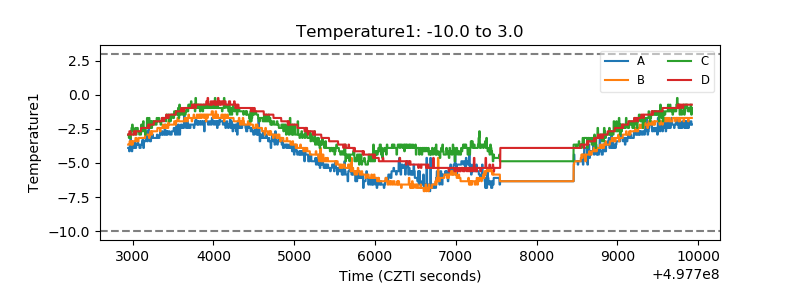 |
| Veto HV Monitor | 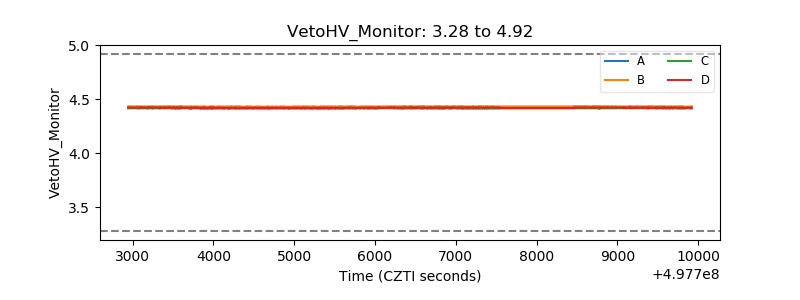 |
| Veto LLD | 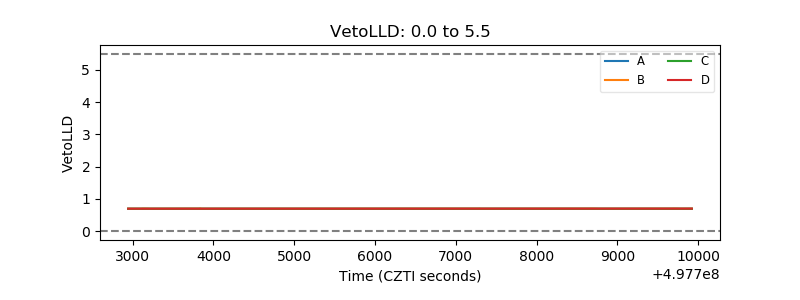 |
| Alpha Counter | 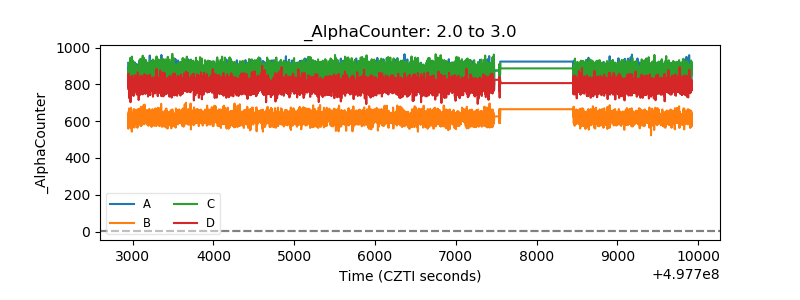 |
| _CPM_Rate | 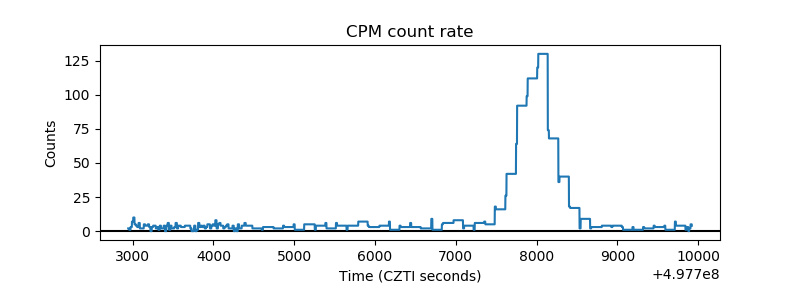 |
| CZT Counter | 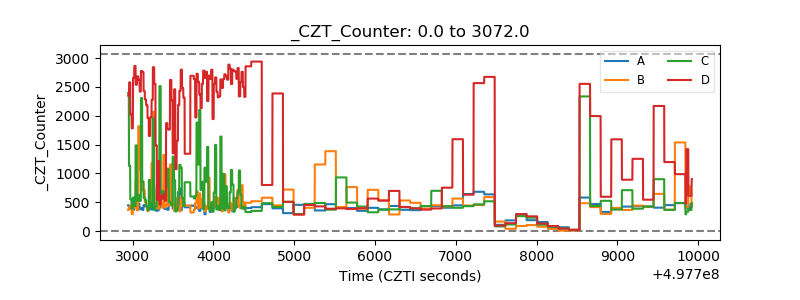 |
| +2.5 Volts monitor | 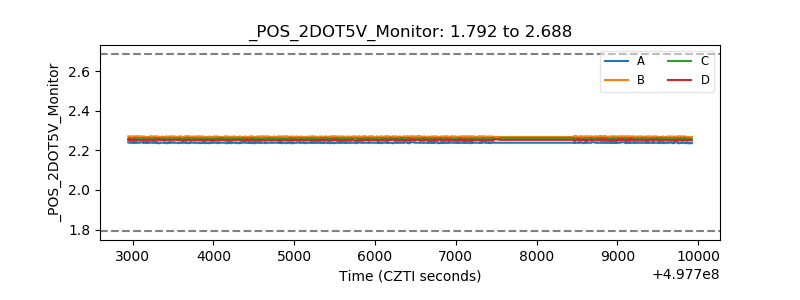 |
| +5 Volts monitor | 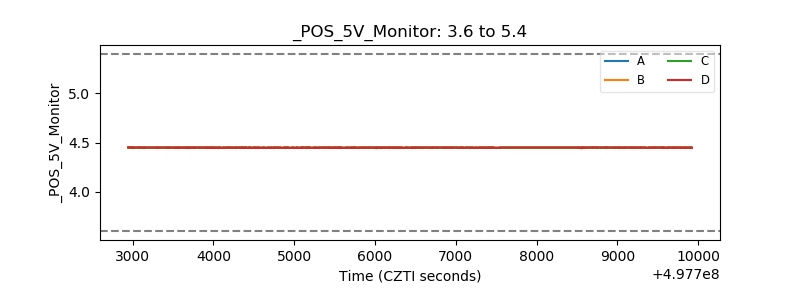 |
| _ROLL_ROT | 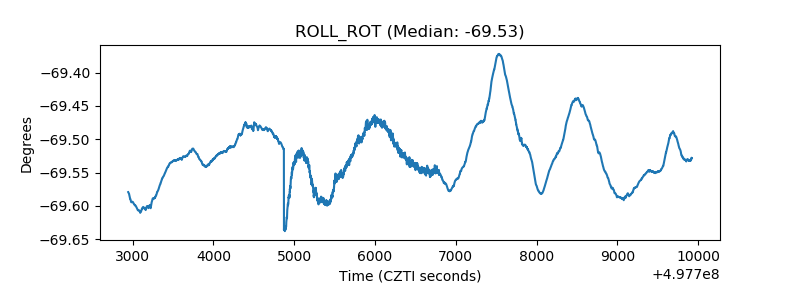 |
| _Roll_DEC | 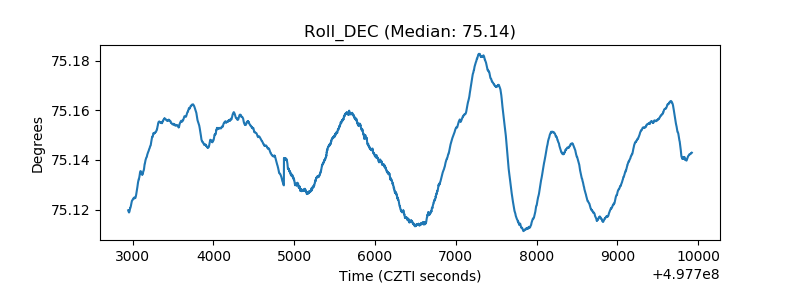 |
| _Roll_RA | 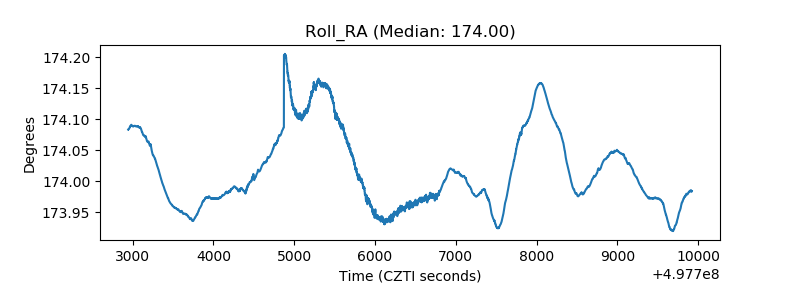 |
| Veto Counter | 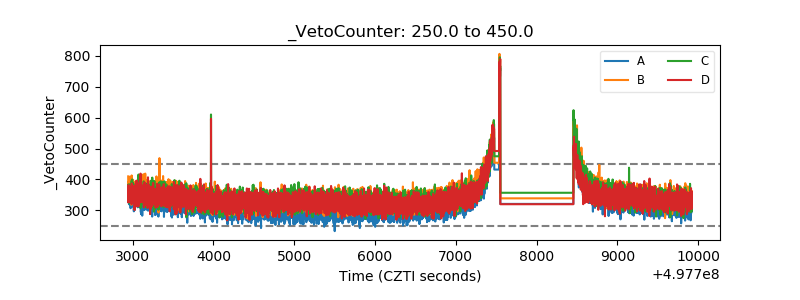 |