| Param | Original file | Final file |
|---|---|---|
| Filename | modeM0/AS1A14_126T15_9000006516_54272cztM0_level2.fits | modeM0/AS1A14_126T15_9000006516_54272cztM0_level2_quad_clean.evt |
| Size (bytes) | 476,884,800 | 93,133,440 |
| Size | 454.8 MB | 88.8 MB |
| Events in quadrant A | 2,990,908 | 630,207 |
| Events in quadrant B | 3,920,584 | 657,153 |
| Events in quadrant C | 3,334,625 | 585,982 |
| Events in quadrant D | 6,888,469 | 482,032 |
| Mode SS | |||
|---|---|---|---|
| Quadrant | BADHDUFLAG | Total packets | Discarded packets |
| A | 0 | 136 | 0 |
| B | 0 | 136 | 0 |
| C | 0 | 136 | 0 |
| D | 0 | 136 | 0 |
| Mode M0 | |||
|---|---|---|---|
| Quadrant | BADHDUFLAG | Total packets | Discarded packets |
| A | 0 | 13898 | 1 |
| B | 0 | 16326 | 1 |
| C | 0 | 15102 | 1 |
| D | 0 | 25075 | 1 |
| Mode M9 | |||
|---|---|---|---|
| Quadrant | BADHDUFLAG | Total packets | Discarded packets |
| A | 0 | 6 | 0 |
| B | 0 | 6 | 0 |
| C | 0 | 6 | 0 |
| D | 0 | 6 | 0 |
| Quadrant | Total seconds | Saturated seconds | Saturation percentage |
|---|---|---|---|
| A | 6660 | 97 | 1.456456% |
| B | 6661 | 301 | 4.518841% |
| C | 6661 | 168 | 2.522144% |
| D | 6661 | 1124 | 16.874343% |
Noise dominated data is calculated using 1-second bins in cleaned event files. If a bin has >2000 counts, and if more than 50% of those come from <1% of pixels, then it is considered to be noise-dominated and hence unusable.
| Quadrant | # 1 sec bins | Bins with >0 counts | Bins with >2000 counts | High rate bins dominated by noise | Noise dominated (total time) | Noise dominated (detector-on time) | Marked lightcurve |
|---|---|---|---|---|---|---|---|
| A | 7240 | 6661 | 10 | 10 | 0.14% | 0.15% | 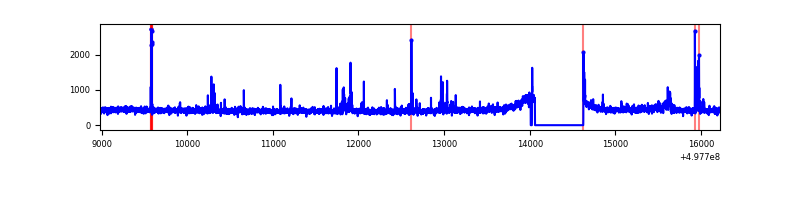 |
| B | 7241 | 6662 | 185 | 185 | 2.55% | 2.78% | 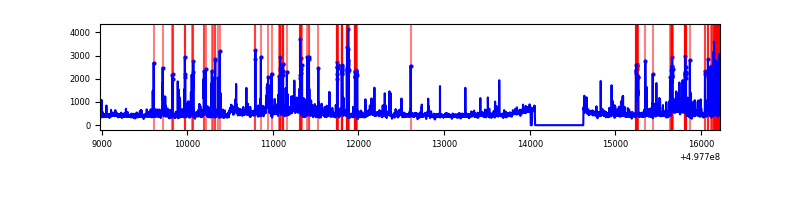 |
| C | 7241 | 6663 | 70 | 70 | 0.97% | 1.05% | 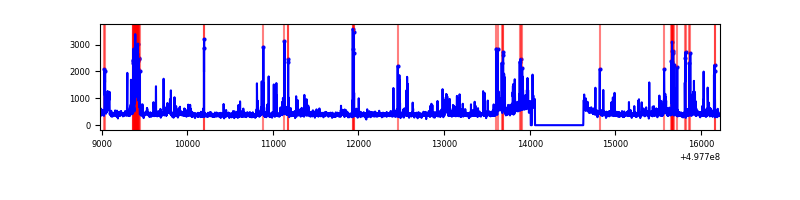 |
| D | 7241 | 6662 | 1016 | 1016 | 14.03% | 15.25% | 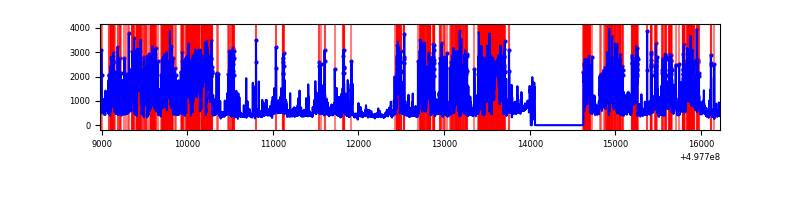 |
Top three noisy pixels from each quadrant. If the there are fewer than three noisy pixels in the level2.evt file, extra rows are filled as -1
| Pixel properties | Quadrant properties | ||||||
|---|---|---|---|---|---|---|---|
| Quadrant | DetID | PixID | Counts | Sigma | Mean | Median | Sigma |
| A | 15 | 174 | 50380 | 290.24 | 696 | 680 | 171.2 |
| A | 11 | 3 | 46333 | 266.6 | 696 | 680 | 171.2 |
| A | 10 | 253 | 40614 | 233.2 | 696 | 680 | 171.2 |
| B | 5 | 236 | 405881 | 2824.25 | 676 | 653 | 143.5 |
| B | 0 | 213 | 258260 | 1795.4 | 676 | 653 | 143.5 |
| B | 5 | 185 | 250781 | 1743.27 | 676 | 653 | 143.5 |
| C | 1 | 29 | 267511 | 1462.28 | 670 | 663 | 182.5 |
| C | 12 | 252 | 146849 | 801.07 | 670 | 663 | 182.5 |
| C | 14 | 254 | 124907 | 680.83 | 670 | 663 | 182.5 |
| D | 8 | 176 | 3186101 | 18018.23 | 626 | 598 | 176.8 |
| D | 3 | 12 | 700644 | 3959.69 | 626 | 598 | 176.8 |
| D | 10 | 181 | 177737 | 1001.96 | 626 | 598 | 176.8 |
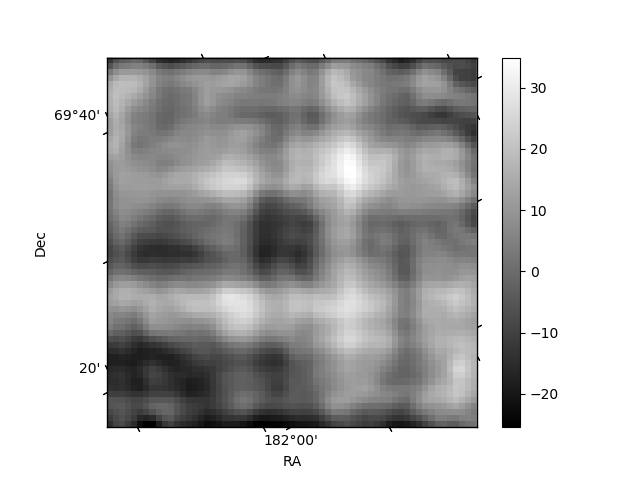
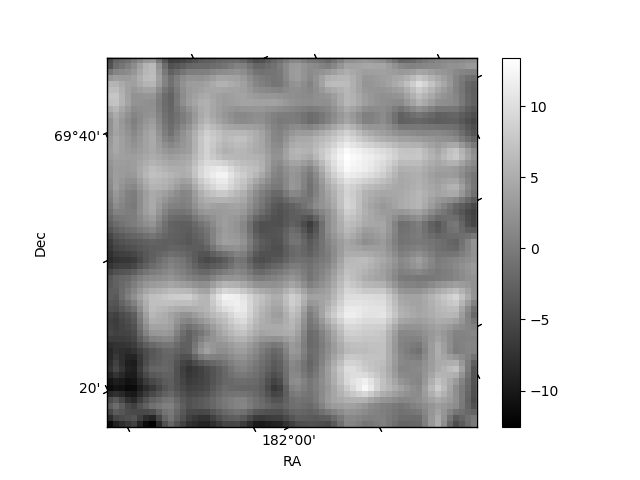
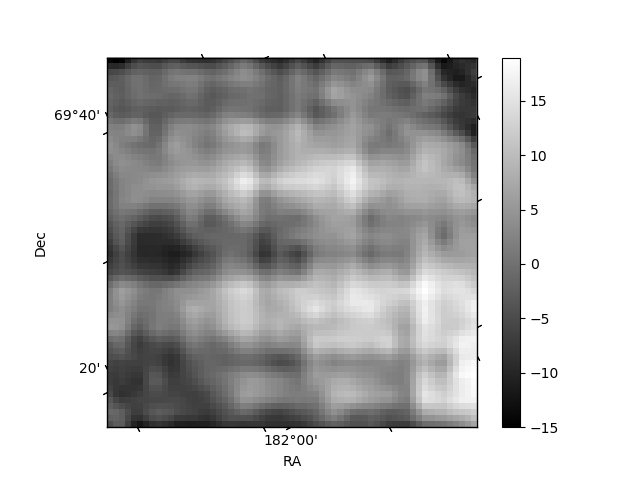
Histogram calculated using DETX and DETY for each event in the final _common_clean file
| Quadrant A | 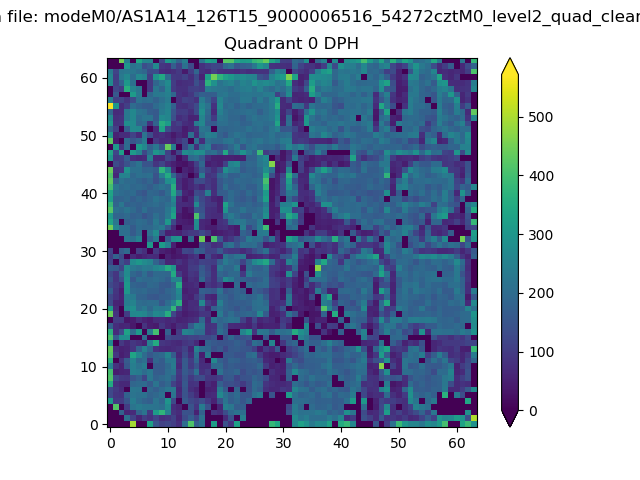 |
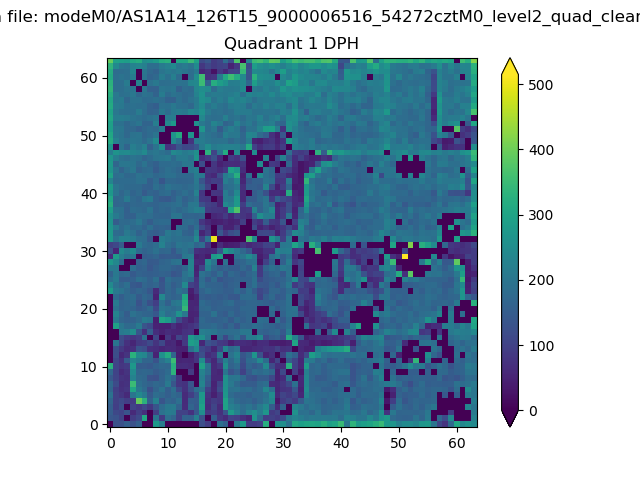 |
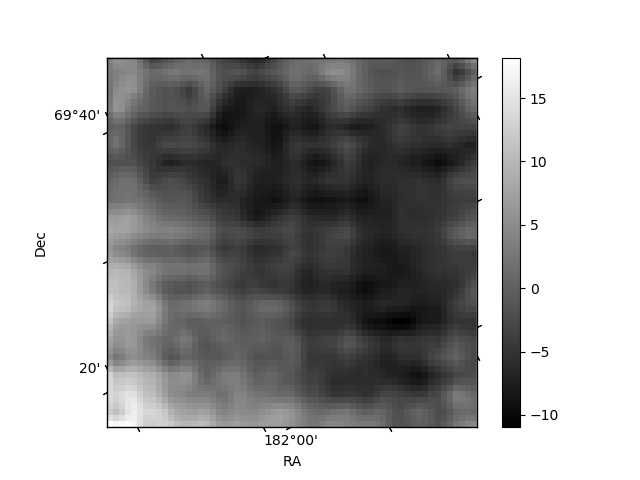
Quadrant B |
|---|---|---|---|
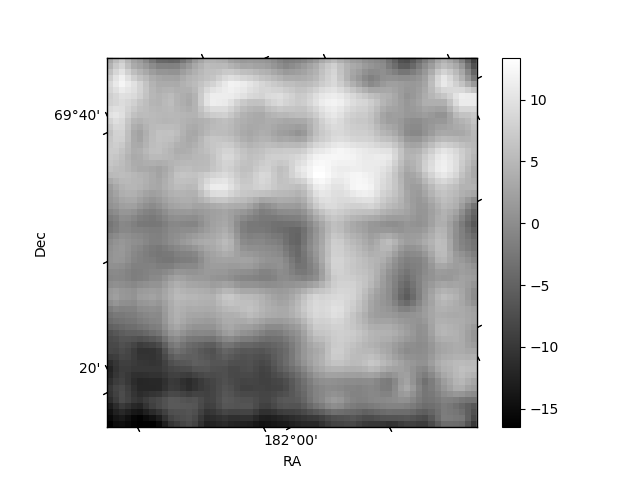
| Quadrant D | 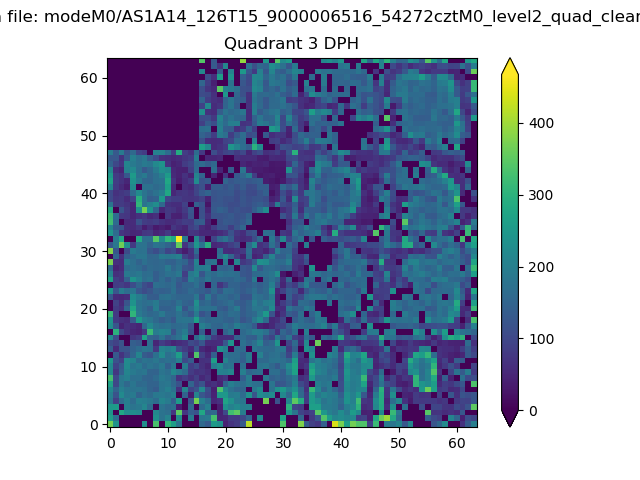 |
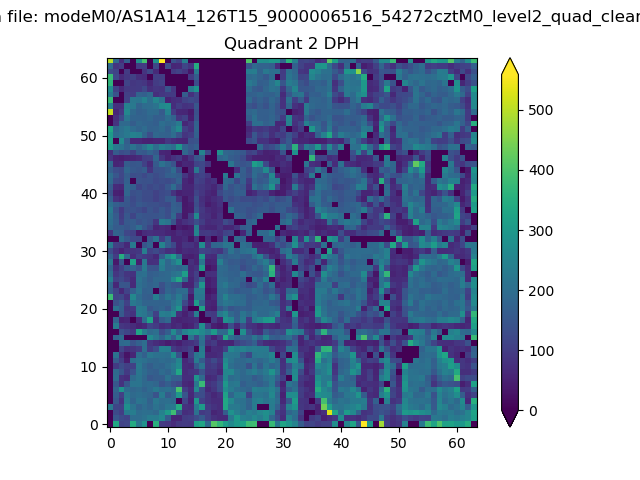 |
Quadrant C |
| Plot type | Count rate plots | Images |
|---|---|---|
| Comparison with Poisson distribution Blue bars denote a histogram of data divided into 1 sec bins. Red curve is a Poisson curve with rate = median count rate of data. |
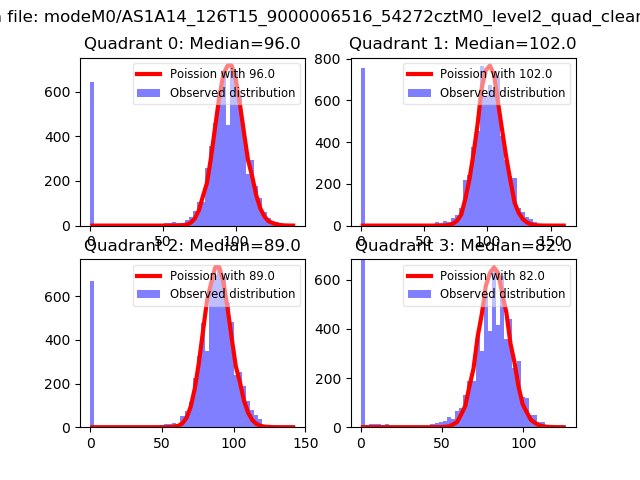 |
 |
| Quadrant-wise count rates Data is divided into 100 sec bins |
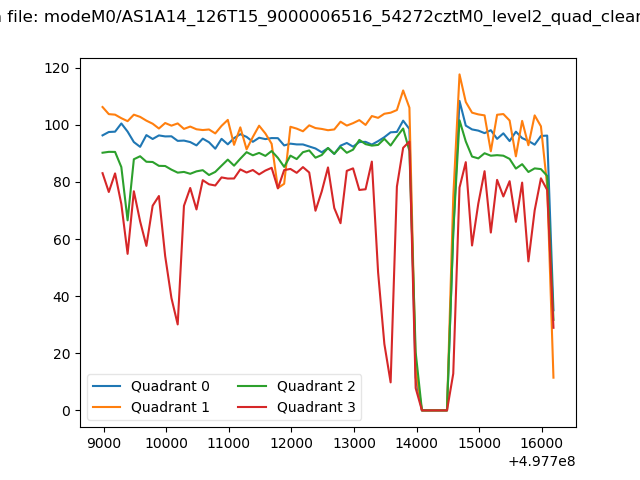 |
|
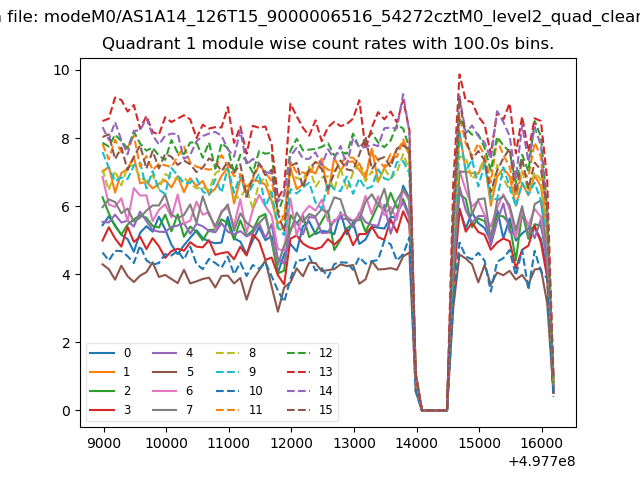
| Module-wise count rates for Quadrant A Data is divided into 100 sec bins |
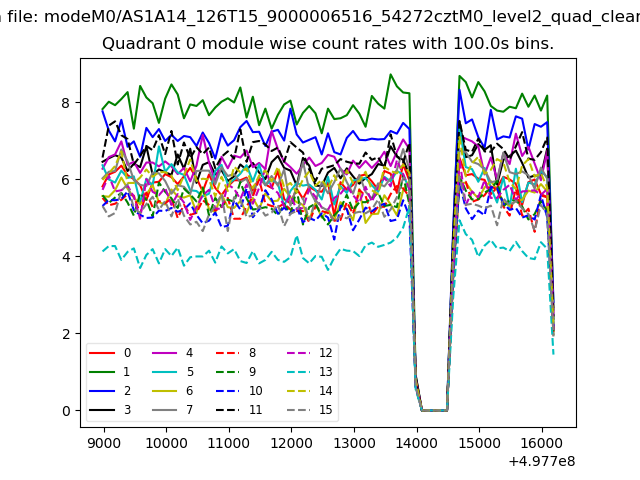 |
 |
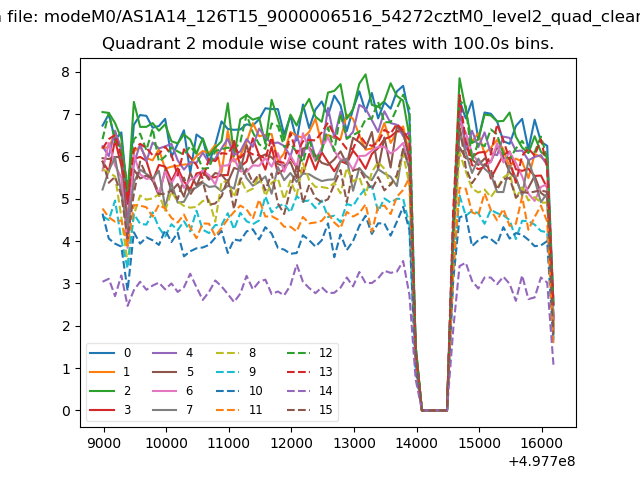
| Module-wise count rates for Quadrant B Data is divided into 100 sec bins |
 |
 |
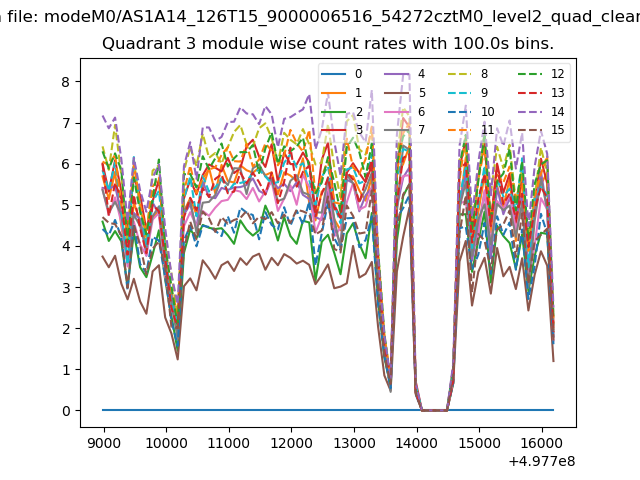
| Module-wise count rates for Quadrant C Data is divided into 100 sec bins |
 |
 |
| Module-wise count rates for Quadrant D Data is divided into 100 sec bins |
 |
 |
| Parameter | Plot |
|---|---|
| CZT HV Monitor | 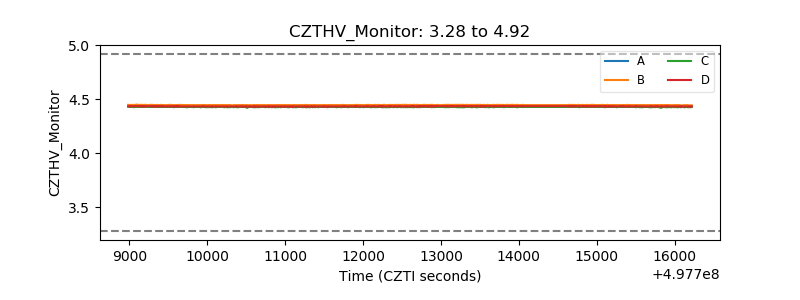 |
| D_VDD | 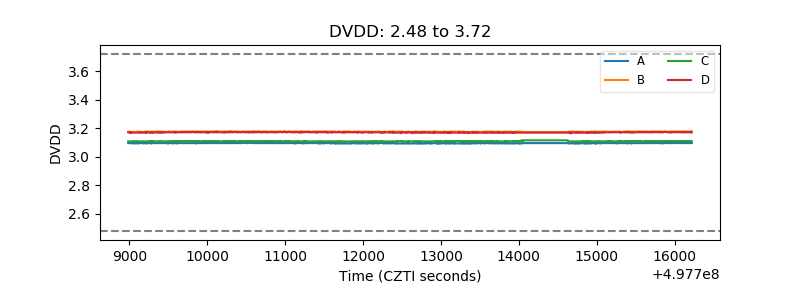 |
| Temperature 1 | 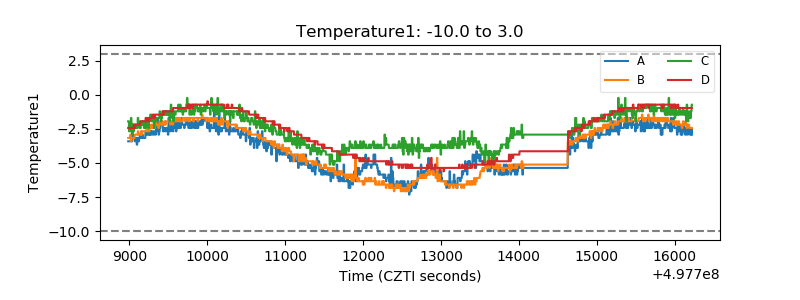 |
| Veto HV Monitor | 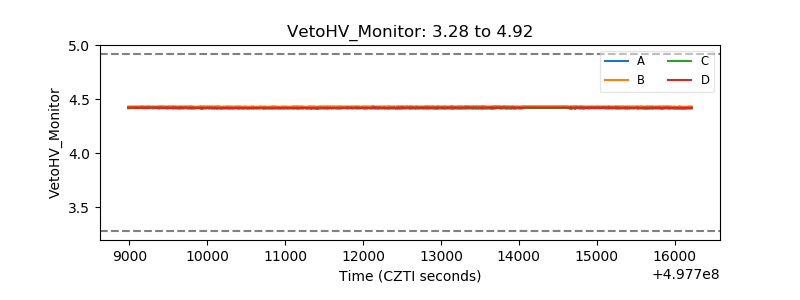 |
| Veto LLD | 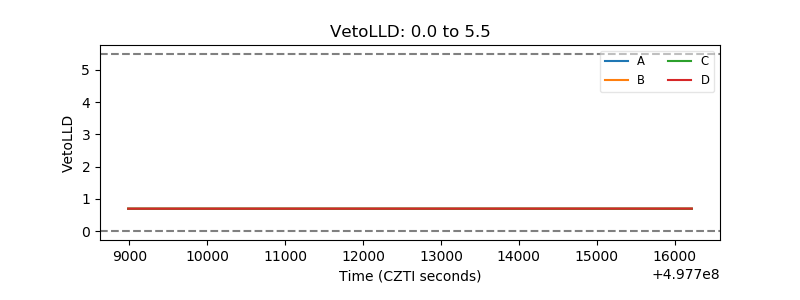 |
| Alpha Counter | 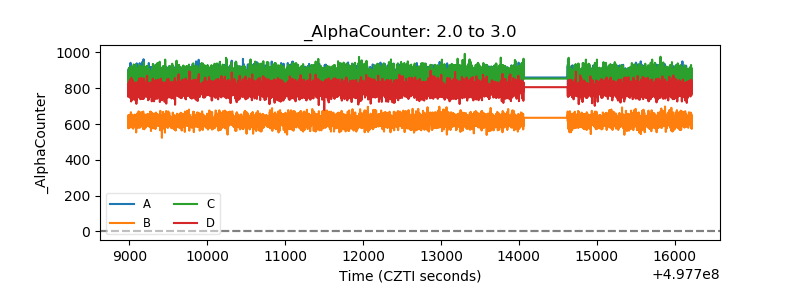 |
| _CPM_Rate | 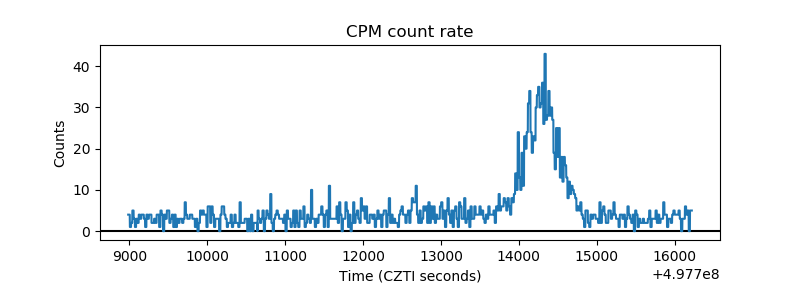 |
| CZT Counter | 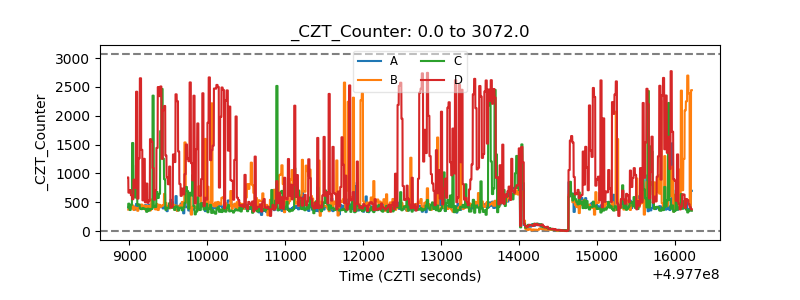 |
| +2.5 Volts monitor |  |
| +5 Volts monitor |  |
| _ROLL_ROT | 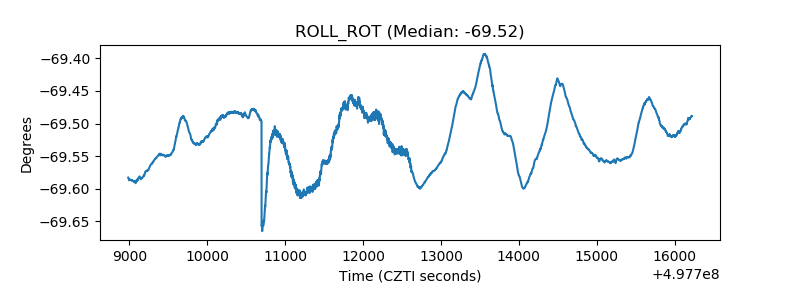 |
| _Roll_DEC | 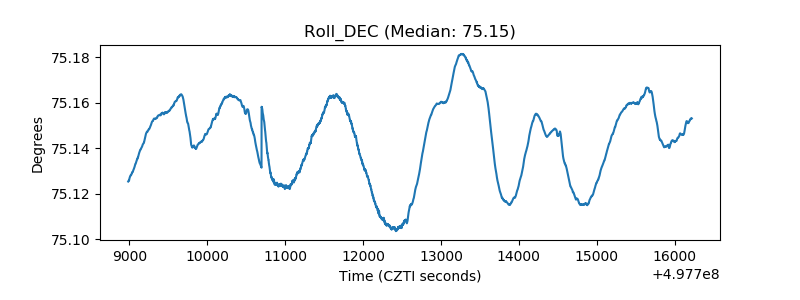 |
| _Roll_RA | 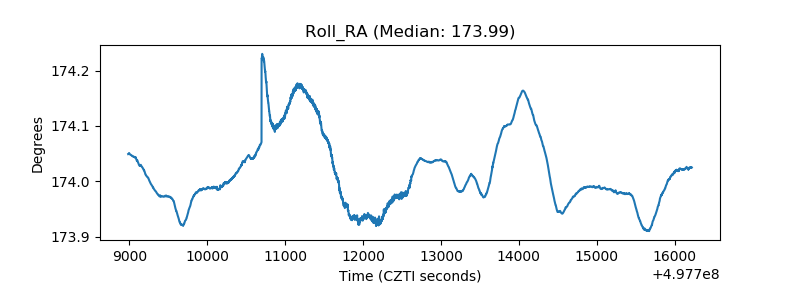 |
| Veto Counter | 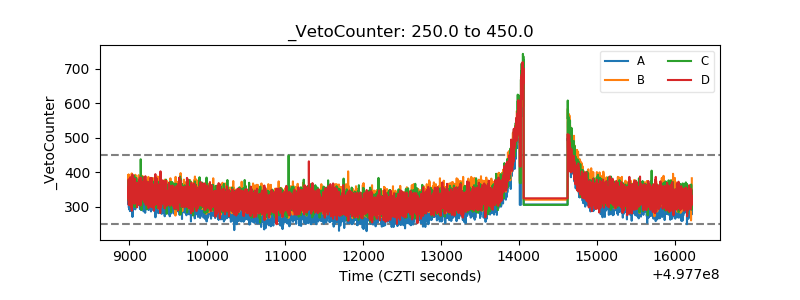 |