| Param | Original file | Final file |
|---|---|---|
| Filename | modeM0/AS1A14_126T15_9000006516_54273cztM0_level2.fits | modeM0/AS1A14_126T15_9000006516_54273cztM0_level2_quad_clean.evt |
| Size (bytes) | 532,609,920 | 107,331,840 |
| Size | 507.9 MB | 102.4 MB |
| Events in quadrant A | 3,658,711 | 718,928 |
| Events in quadrant B | 5,062,249 | 748,406 |
| Events in quadrant C | 4,384,110 | 658,128 |
| Events in quadrant D | 6,020,714 | 596,010 |
| Mode SS | |||
|---|---|---|---|
| Quadrant | BADHDUFLAG | Total packets | Discarded packets |
| A | 0 | 152 | 0 |
| B | 0 | 152 | 0 |
| C | 0 | 152 | 0 |
| D | 0 | 152 | 0 |
| Mode M0 | |||
|---|---|---|---|
| Quadrant | BADHDUFLAG | Total packets | Discarded packets |
| A | 0 | 16500 | 0 |
| B | 0 | 20399 | 1 |
| C | 0 | 18747 | 0 |
| D | 0 | 23180 | 0 |
| Quadrant | Total seconds | Saturated seconds | Saturation percentage |
|---|---|---|---|
| A | 7593 | 80 | 1.053602% |
| B | 7593 | 311 | 4.095878% |
| C | 7593 | 302 | 3.977348% |
| D | 7593 | 616 | 8.112735% |
Noise dominated data is calculated using 1-second bins in cleaned event files. If a bin has >2000 counts, and if more than 50% of those come from <1% of pixels, then it is considered to be noise-dominated and hence unusable.
| Quadrant | # 1 sec bins | Bins with >0 counts | Bins with >2000 counts | High rate bins dominated by noise | Noise dominated (total time) | Noise dominated (detector-on time) | Marked lightcurve |
|---|---|---|---|---|---|---|---|
| A | 7593 | 7593 | 47 | 47 | 0.62% | 0.62% | 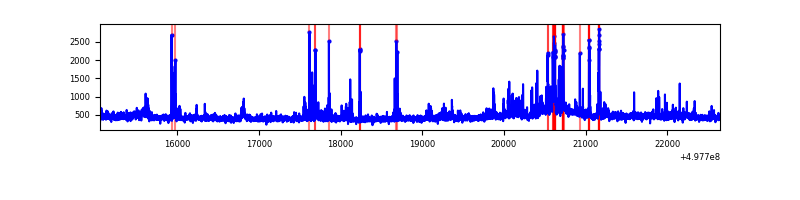 |
| B | 7593 | 7593 | 258 | 258 | 3.40% | 3.40% | 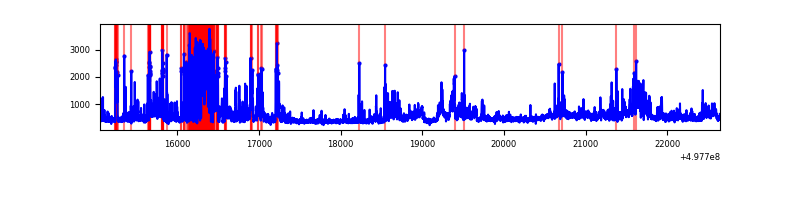 |
| C | 7593 | 7593 | 257 | 257 | 3.38% | 3.38% | 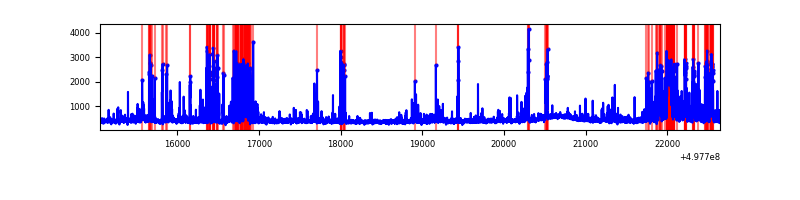 |
| D | 7593 | 7593 | 520 | 520 | 6.85% | 6.85% | 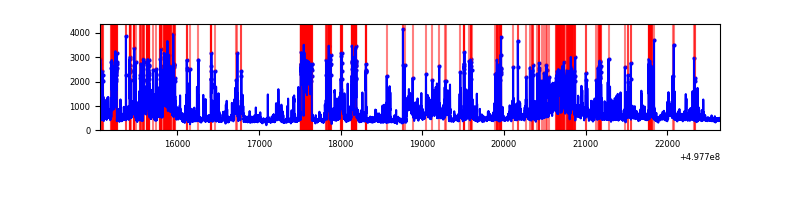 |
Top three noisy pixels from each quadrant. If the there are fewer than three noisy pixels in the level2.evt file, extra rows are filled as -1
| Pixel properties | Quadrant properties | ||||||
|---|---|---|---|---|---|---|---|
| Quadrant | DetID | PixID | Counts | Sigma | Mean | Median | Sigma |
| A | 15 | 174 | 107195 | 548.4 | 791 | 772 | 194.1 |
| A | 3 | 130 | 103182 | 527.72 | 791 | 772 | 194.1 |
| A | 4 | 5 | 79297 | 404.64 | 791 | 772 | 194.1 |
| B | 5 | 185 | 833992 | 5052.9 | 775 | 748 | 164.9 |
| B | 5 | 172 | 462282 | 2798.8 | 775 | 748 | 164.9 |
| B | 5 | 236 | 217316 | 1313.3 | 775 | 748 | 164.9 |
| C | 1 | 29 | 685823 | 3331.73 | 758 | 748 | 205.6 |
| C | 13 | 16 | 183443 | 888.5 | 758 | 748 | 205.6 |
| C | 14 | 254 | 168698 | 816.79 | 758 | 748 | 205.6 |
| D | 8 | 176 | 1359914 | 6529.58 | 743 | 708 | 208.2 |
| D | 3 | 12 | 1071012 | 5141.71 | 743 | 708 | 208.2 |
| D | 10 | 181 | 271961 | 1303.09 | 743 | 708 | 208.2 |
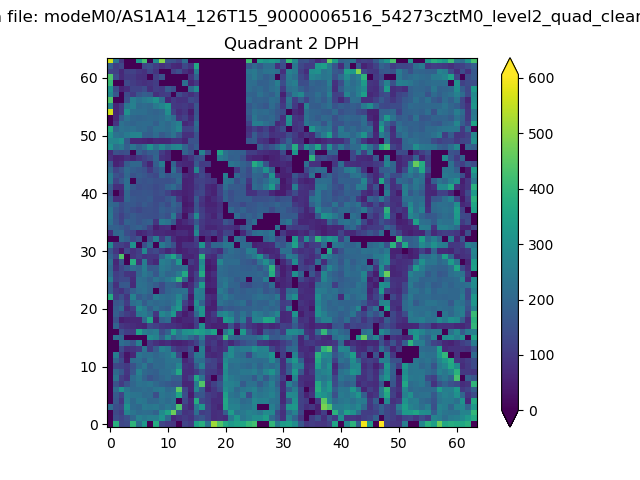
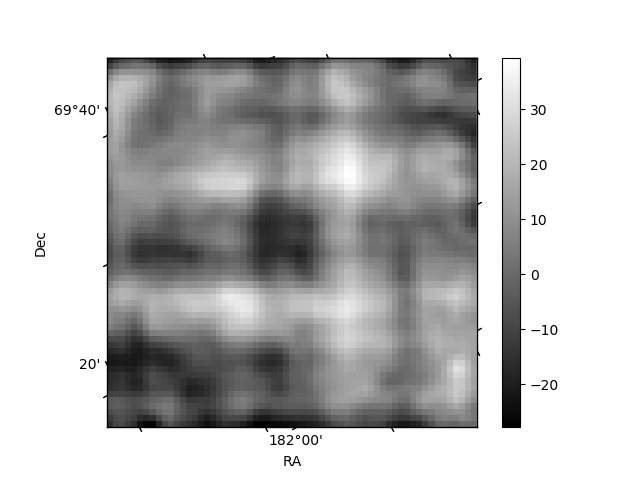
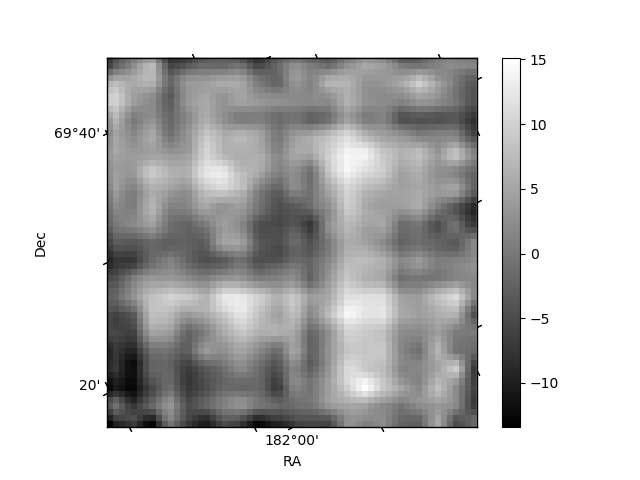
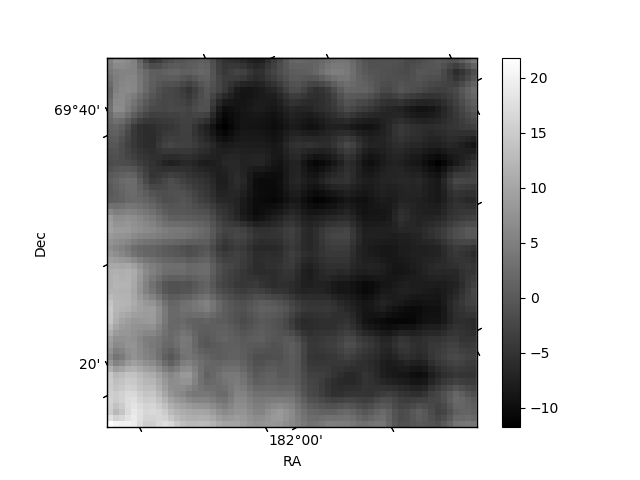
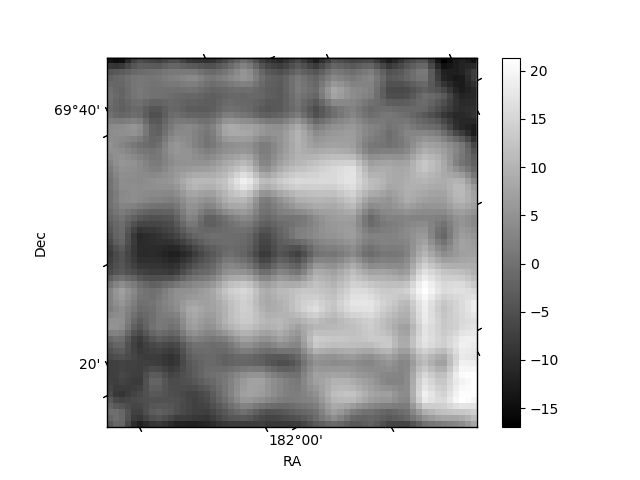
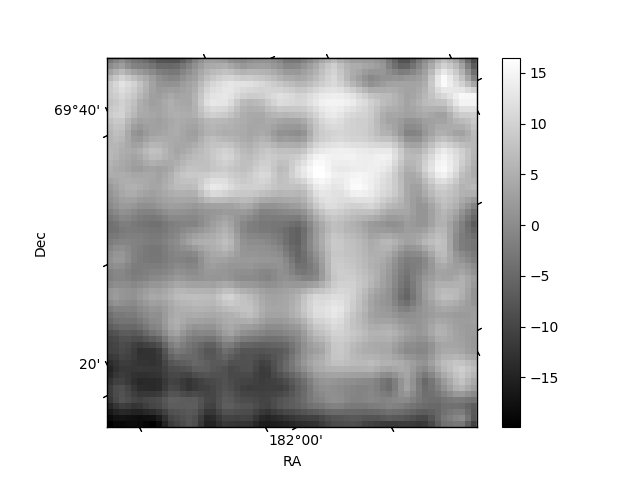
Histogram calculated using DETX and DETY for each event in the final _common_clean file
| Quadrant A | 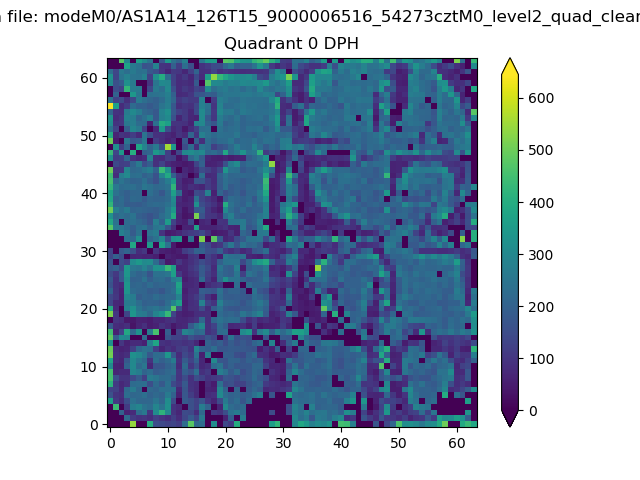 |
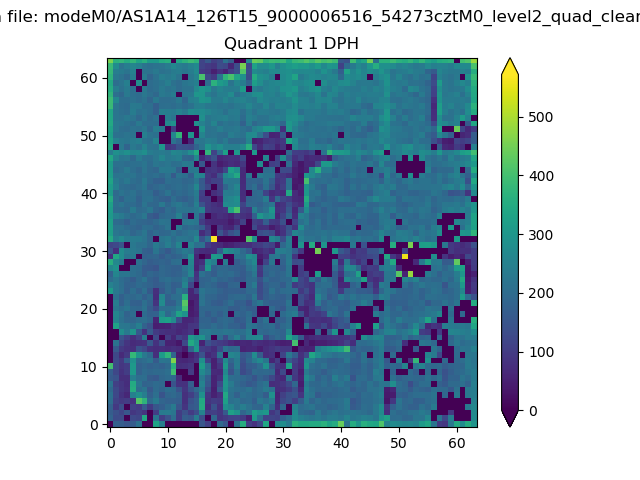 |
Quadrant B |
|---|---|---|---|
| Quadrant D | 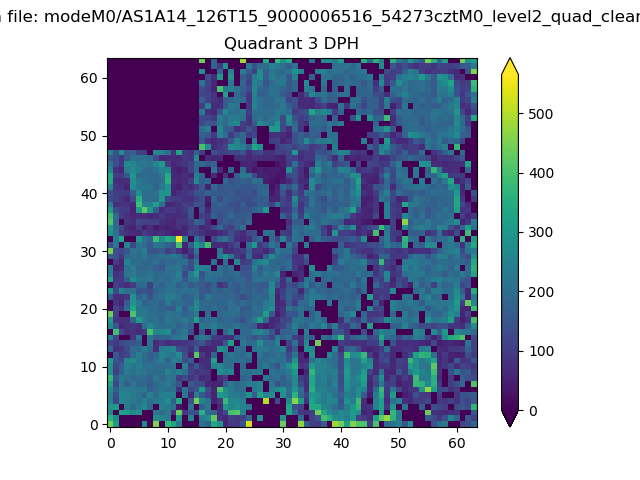 |
 |
Quadrant C |
| Plot type | Count rate plots | Images |
|---|---|---|
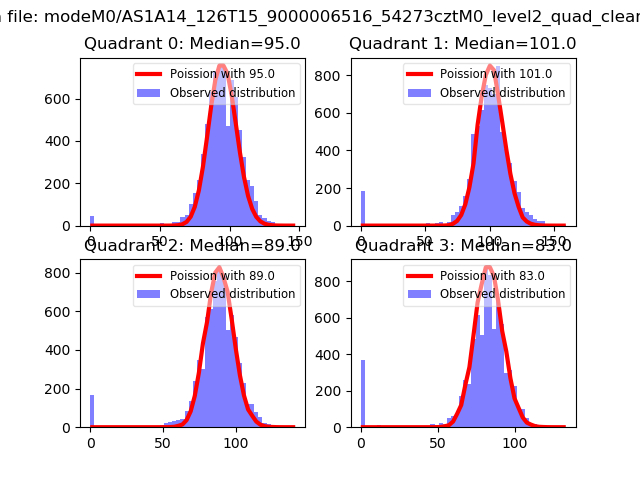
| Comparison with Poisson distribution Blue bars denote a histogram of data divided into 1 sec bins. Red curve is a Poisson curve with rate = median count rate of data. |
 |
 |
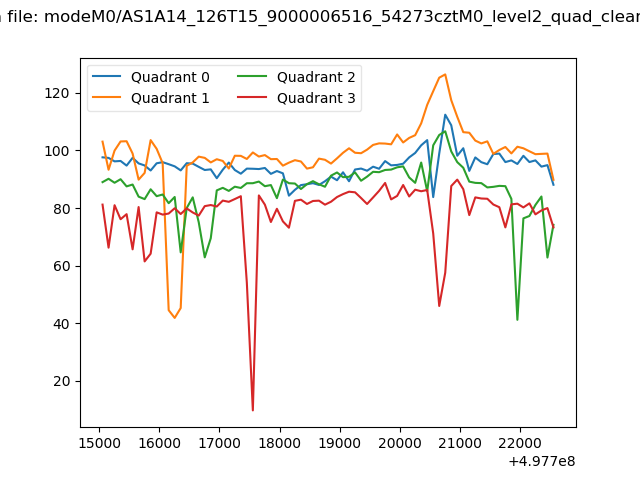
| Quadrant-wise count rates Data is divided into 100 sec bins |
 |
|
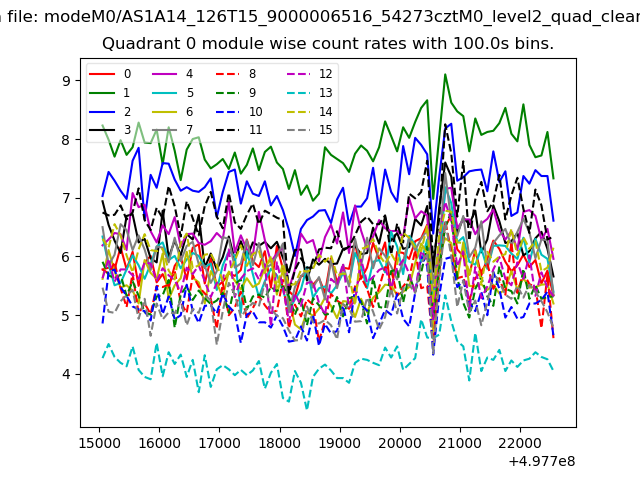
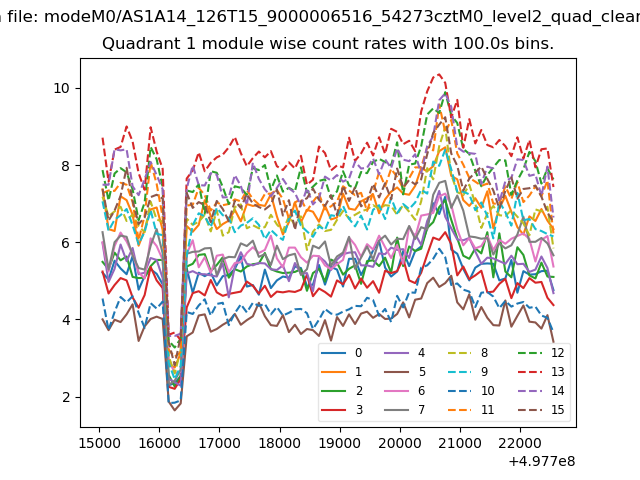
| Module-wise count rates for Quadrant A Data is divided into 100 sec bins |
 |
 |
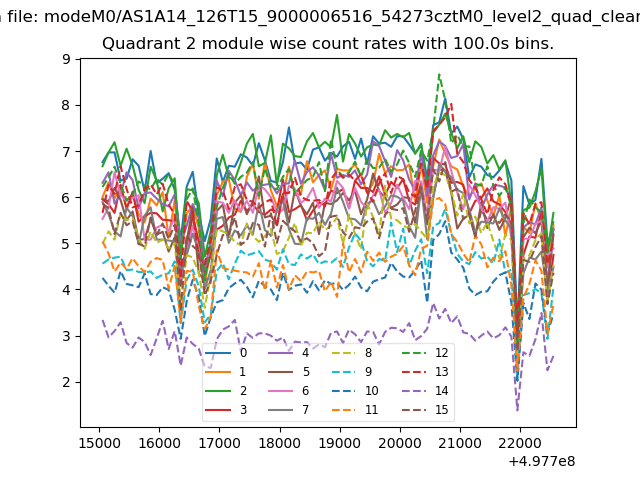
| Module-wise count rates for Quadrant B Data is divided into 100 sec bins |
 |
 |
| Module-wise count rates for Quadrant C Data is divided into 100 sec bins |
 |
 |
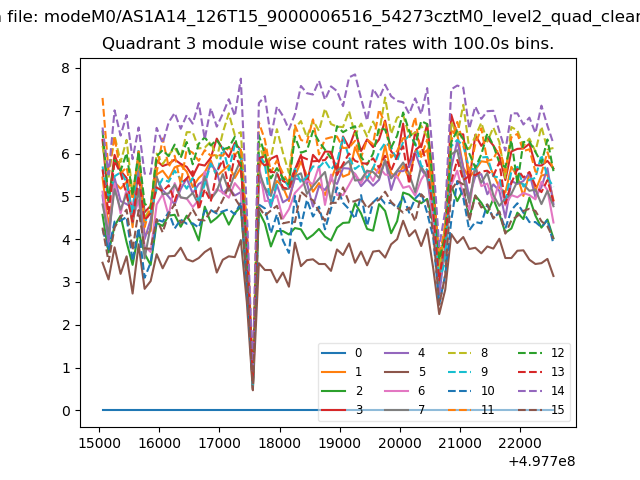
| Module-wise count rates for Quadrant D Data is divided into 100 sec bins |
 |
 |
| Parameter | Plot |
|---|---|
| CZT HV Monitor |  |
| D_VDD | 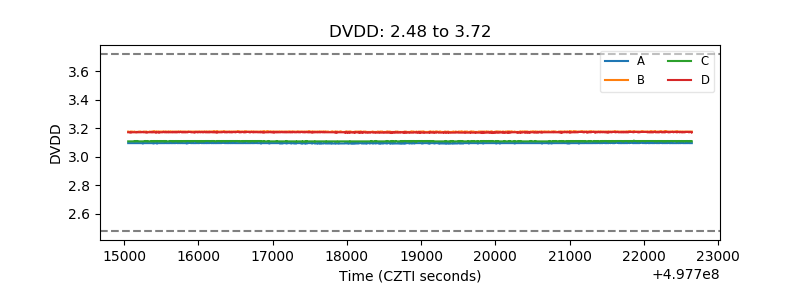 |
| Temperature 1 | 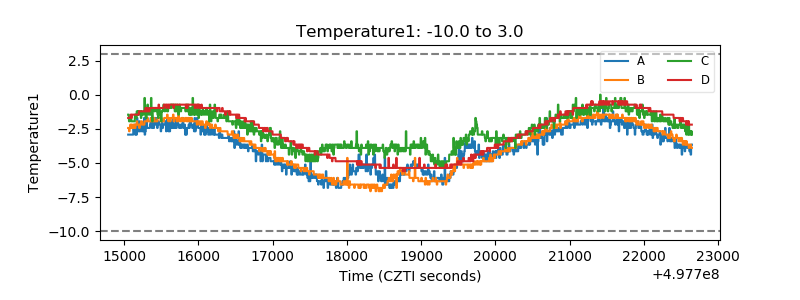 |
| Veto HV Monitor | 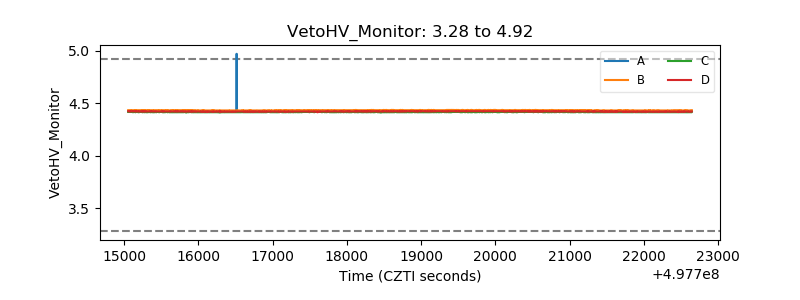 |
| Veto LLD | 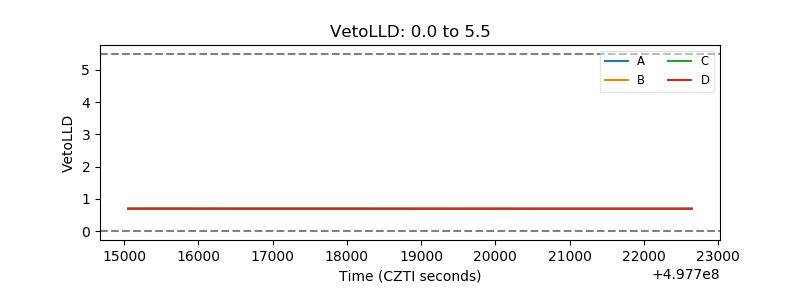 |
| Alpha Counter | 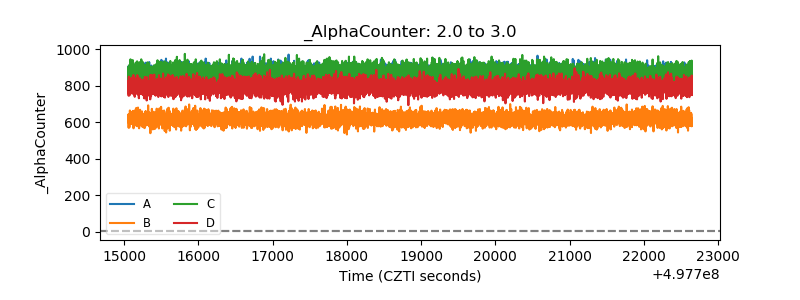 |
| _CPM_Rate |  |
| CZT Counter | 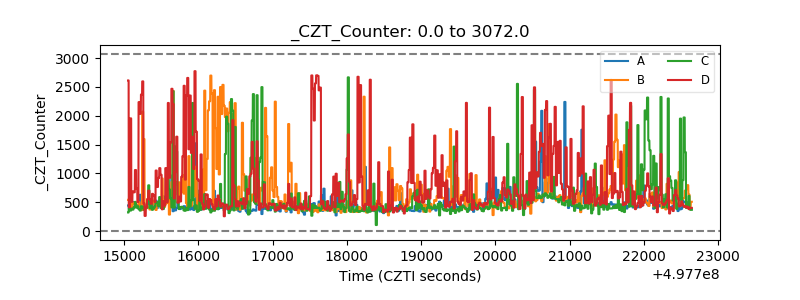 |
| +2.5 Volts monitor |  |
| +5 Volts monitor |  |
| _ROLL_ROT | 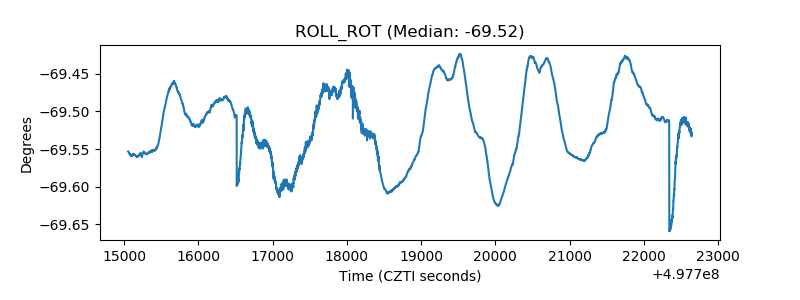 |
| _Roll_DEC | 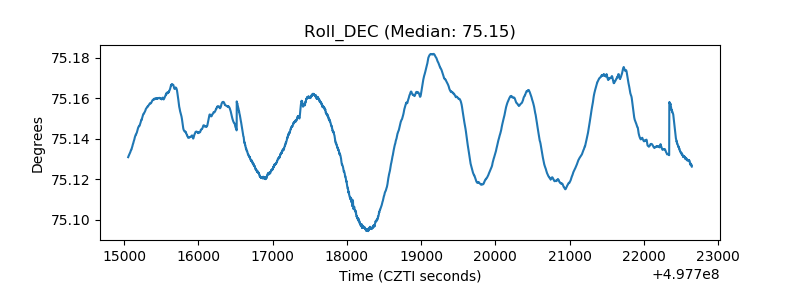 |
| _Roll_RA | 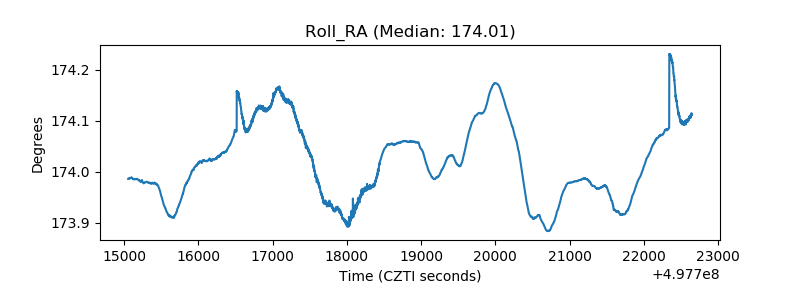 |
| Veto Counter | 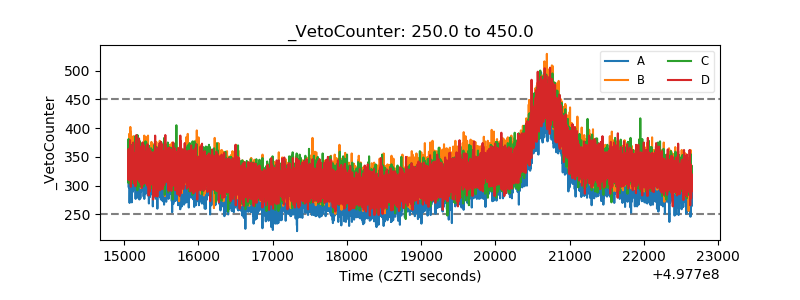 |