| Param | Original file | Final file |
|---|---|---|
| Filename | modeM0/AS1A14_126T15_9000006516_54274cztM0_level2.fits | modeM0/AS1A14_126T15_9000006516_54274cztM0_level2_quad_clean.evt |
| Size (bytes) | 514,598,400 | 92,626,560 |
| Size | 490.8 MB | 88.3 MB |
| Events in quadrant A | 3,187,262 | 638,660 |
| Events in quadrant B | 4,297,462 | 651,685 |
| Events in quadrant C | 3,792,585 | 575,059 |
| Events in quadrant D | 7,247,613 | 469,015 |
| Mode SS | |||
|---|---|---|---|
| Quadrant | BADHDUFLAG | Total packets | Discarded packets |
| A | 0 | 136 | 0 |
| B | 0 | 136 | 0 |
| C | 0 | 136 | 0 |
| D | 0 | 136 | 0 |
| Mode M0 | |||
|---|---|---|---|
| Quadrant | BADHDUFLAG | Total packets | Discarded packets |
| A | 0 | 14396 | 82 |
| B | 0 | 17383 | 102 |
| C | 0 | 16718 | 400 |
| D | 0 | 26314 | 160 |
| Quadrant | Total seconds | Saturated seconds | Saturation percentage |
|---|---|---|---|
| A | 6750 | 15 | 0.222222% |
| B | 6750 | 299 | 4.429630% |
| C | 6719 | 277 | 4.122637% |
| D | 6735 | 1202 | 17.847068% |
Noise dominated data is calculated using 1-second bins in cleaned event files. If a bin has >2000 counts, and if more than 50% of those come from <1% of pixels, then it is considered to be noise-dominated and hence unusable.
| Quadrant | # 1 sec bins | Bins with >0 counts | Bins with >2000 counts | High rate bins dominated by noise | Noise dominated (total time) | Noise dominated (detector-on time) | Marked lightcurve |
|---|---|---|---|---|---|---|---|
| A | 6794 | 6781 | 15 | 15 | 0.22% | 0.22% | 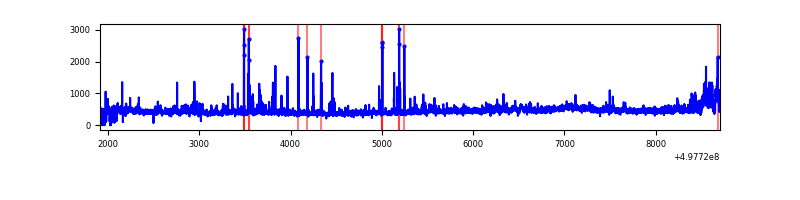 |
| B | 6794 | 6786 | 254 | 254 | 3.74% | 3.74% | 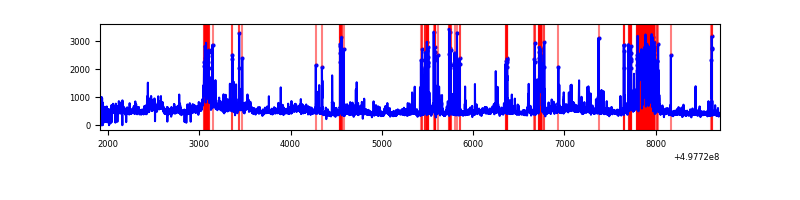 |
| C | 6793 | 6752 | 237 | 237 | 3.49% | 3.51% | 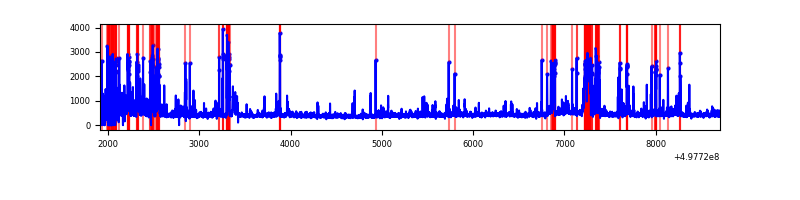 |
| D | 6792 | 6775 | 1253 | 1253 | 18.45% | 18.49% | 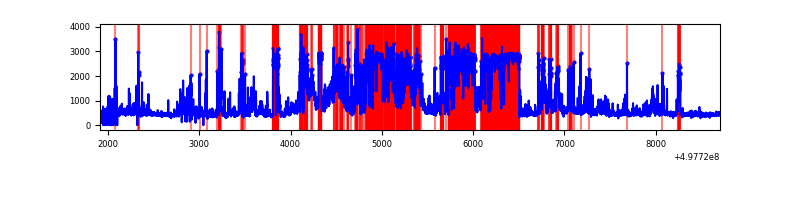 |
Top three noisy pixels from each quadrant. If the there are fewer than three noisy pixels in the level2.evt file, extra rows are filled as -1
| Pixel properties | Quadrant properties | ||||||
|---|---|---|---|---|---|---|---|
| Quadrant | DetID | PixID | Counts | Sigma | Mean | Median | Sigma |
| A | 4 | 5 | 152165 | 876.94 | 699 | 683 | 172.7 |
| A | 11 | 3 | 54549 | 311.83 | 699 | 683 | 172.7 |
| A | 8 | 6 | 42494 | 242.05 | 699 | 683 | 172.7 |
| B | 5 | 185 | 507827 | 3448.97 | 680 | 654 | 147.1 |
| B | 5 | 236 | 318939 | 2164.46 | 680 | 654 | 147.1 |
| B | 7 | 0 | 265887 | 1803.69 | 680 | 654 | 147.1 |
| C | 1 | 29 | 380312 | 2099.54 | 662 | 655 | 180.8 |
| C | 12 | 249 | 258039 | 1423.36 | 662 | 655 | 180.8 |
| C | 15 | 189 | 115816 | 636.85 | 662 | 655 | 180.8 |
| D | 3 | 12 | 3945664 | 22435.22 | 617 | 589 | 175.8 |
| D | 8 | 176 | 433573 | 2462.33 | 617 | 589 | 175.8 |
| D | 2 | 153 | 111236 | 629.24 | 617 | 589 | 175.8 |
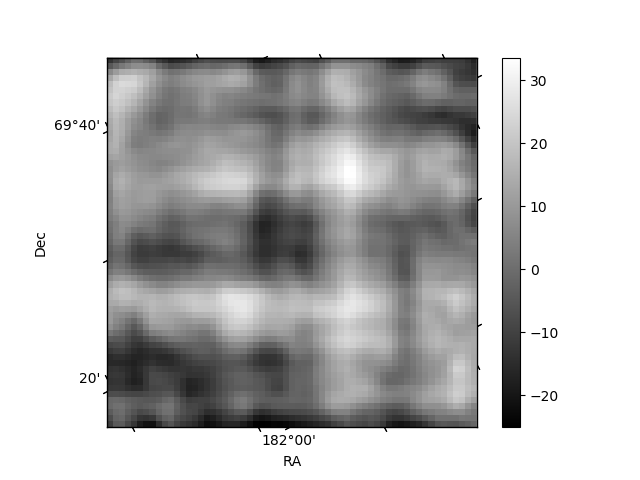
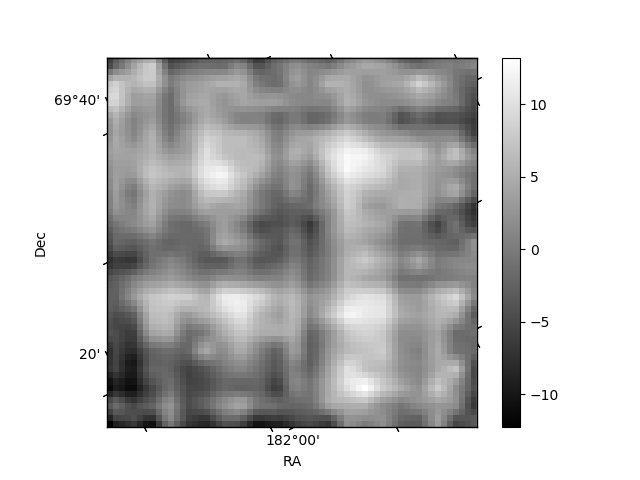
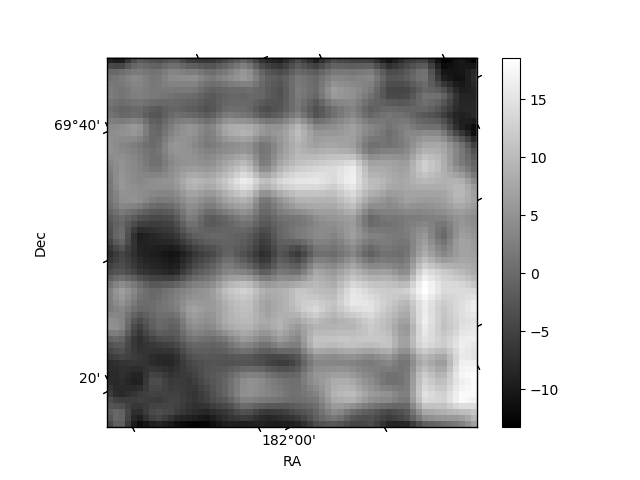
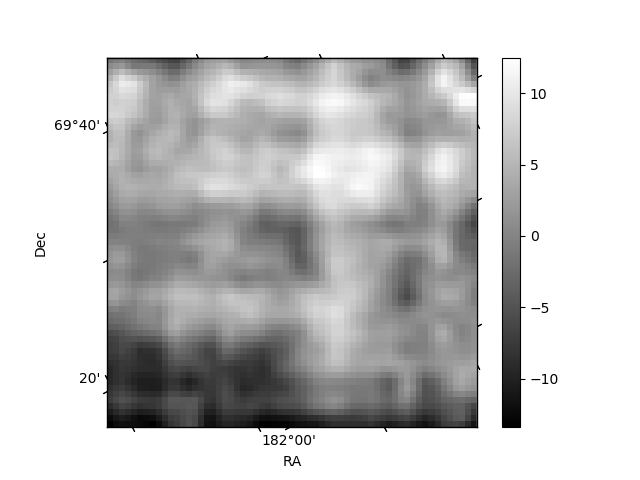
Histogram calculated using DETX and DETY for each event in the final _common_clean file
| Quadrant A | 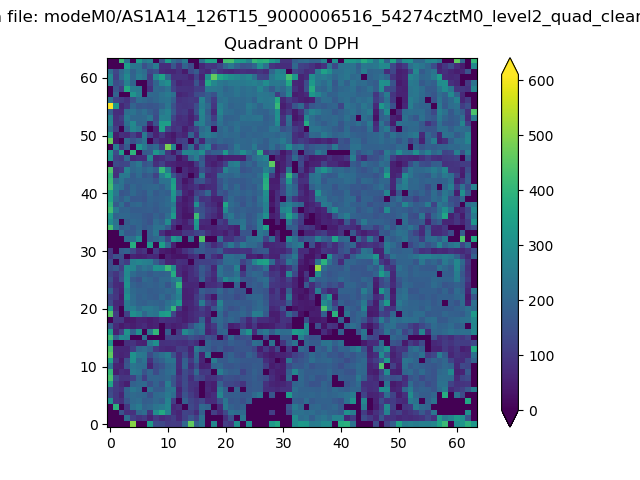 |
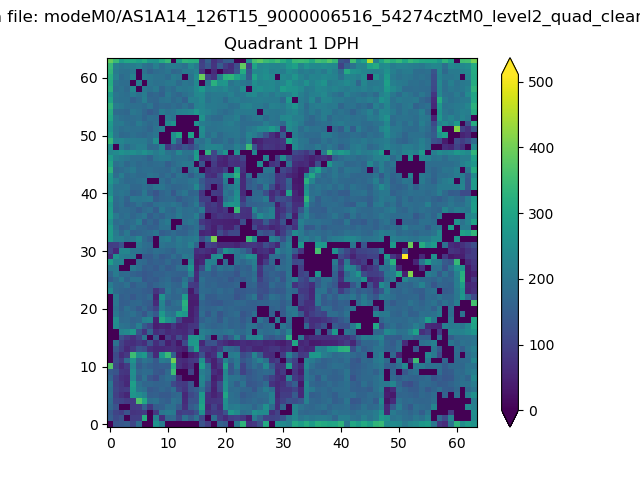 |
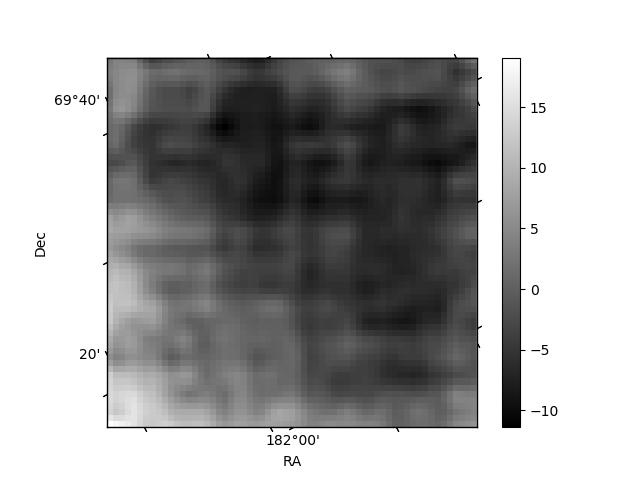
Quadrant B |
|---|---|---|---|
| Quadrant D | 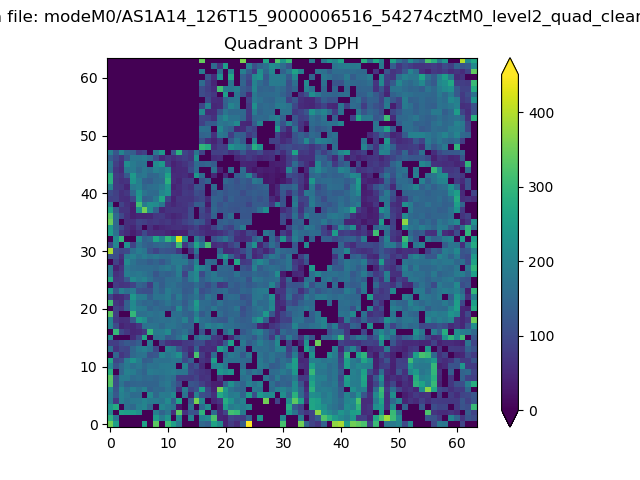 |
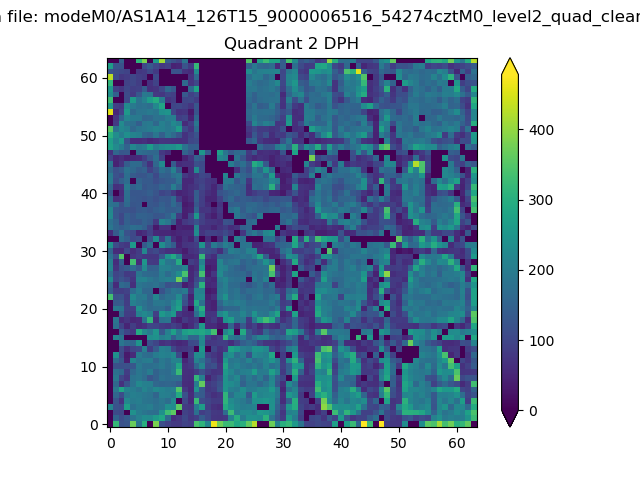 |
Quadrant C |
| Plot type | Count rate plots | Images |
|---|---|---|
| Comparison with Poisson distribution Blue bars denote a histogram of data divided into 1 sec bins. Red curve is a Poisson curve with rate = median count rate of data. |
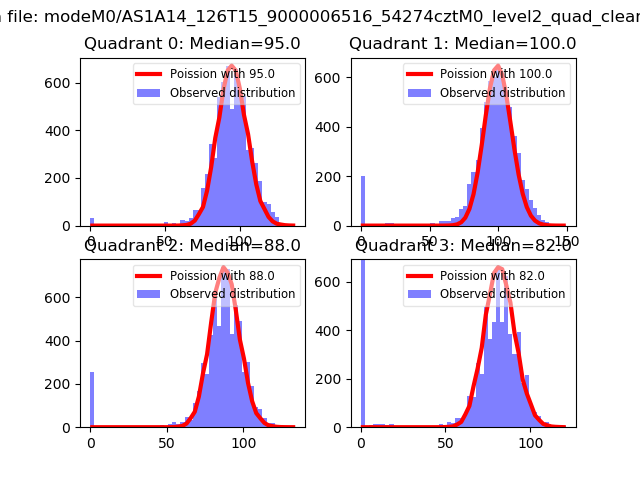 |
 |
| Quadrant-wise count rates Data is divided into 100 sec bins |
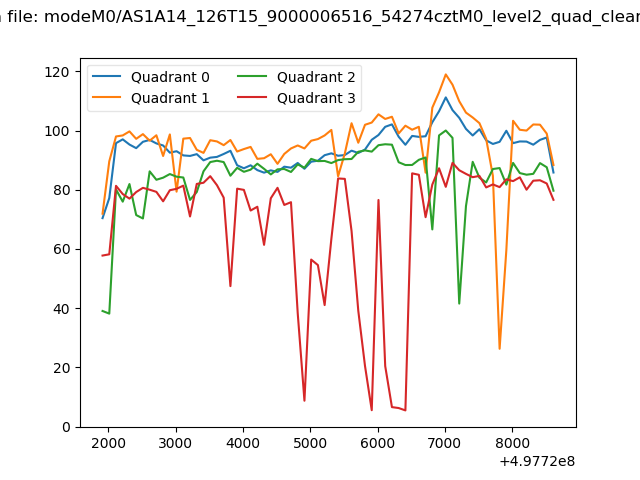 |
|
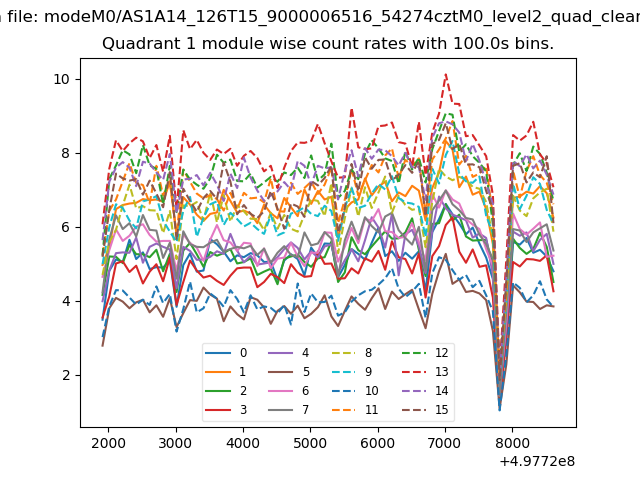
| Module-wise count rates for Quadrant A Data is divided into 100 sec bins |
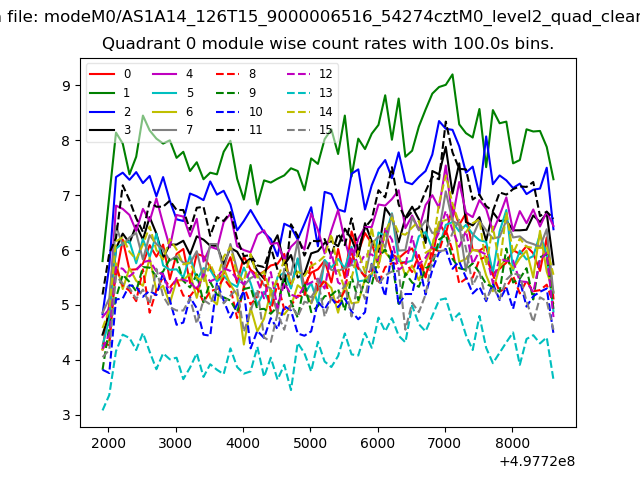 |
 |
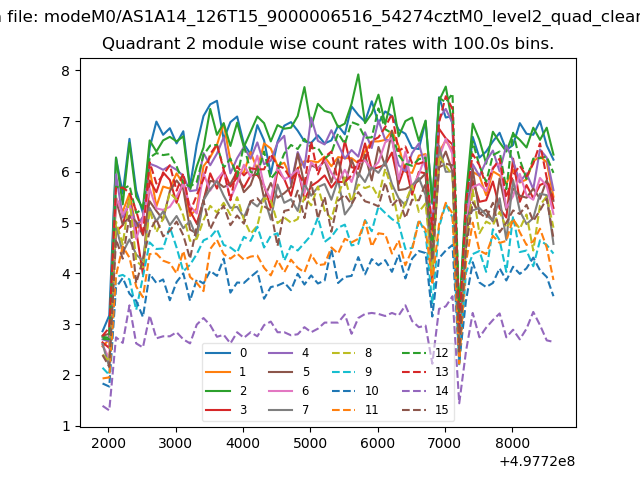
| Module-wise count rates for Quadrant B Data is divided into 100 sec bins |
 |
 |
| Module-wise count rates for Quadrant C Data is divided into 100 sec bins |
 |
 |
| Module-wise count rates for Quadrant D Data is divided into 100 sec bins |
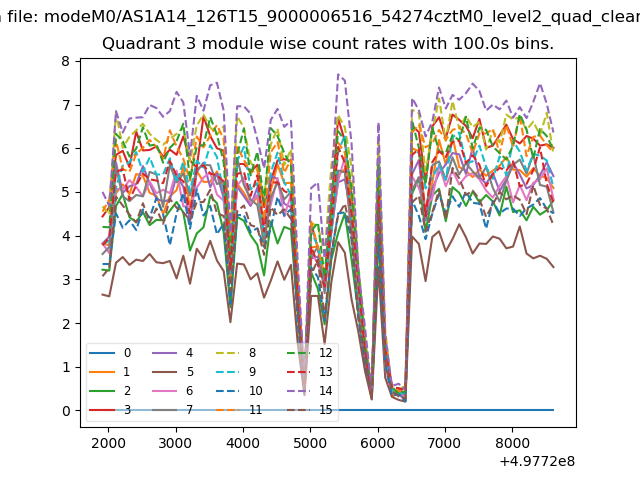 |
 |
| Parameter | Plot |
|---|---|
| CZT HV Monitor |  |
| D_VDD | 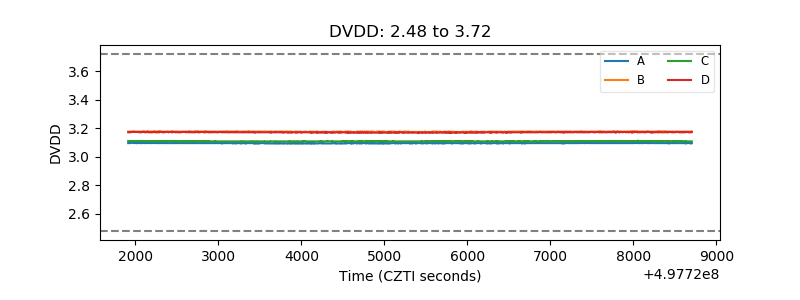 |
| Temperature 1 | 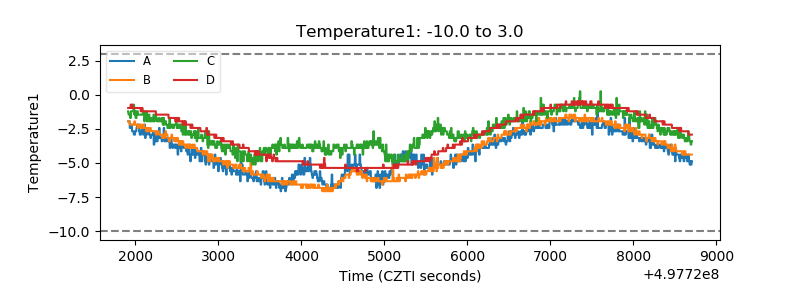 |
| Veto HV Monitor | 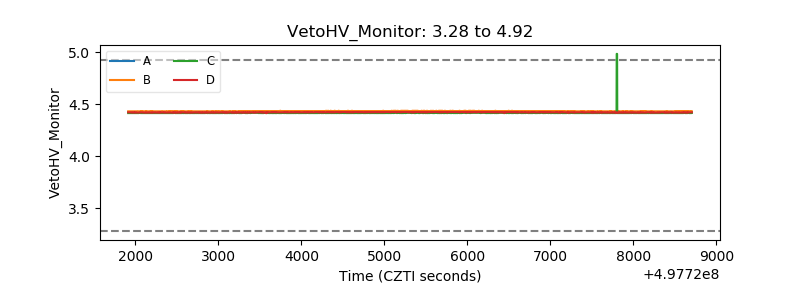 |
| Veto LLD | 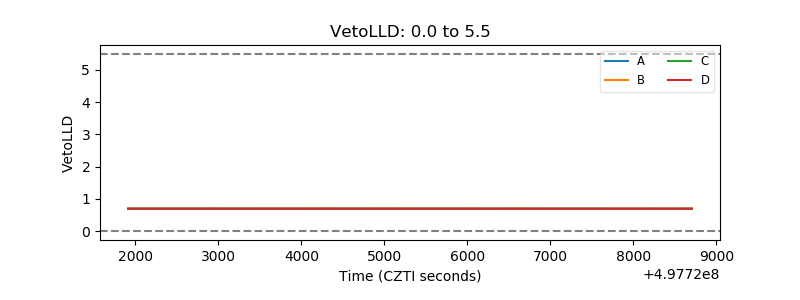 |
| Alpha Counter | 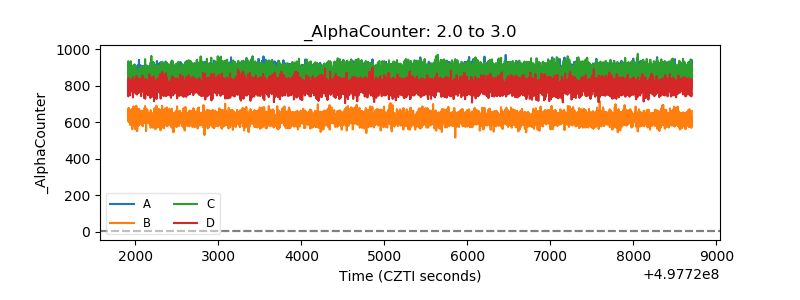 |
| _CPM_Rate | 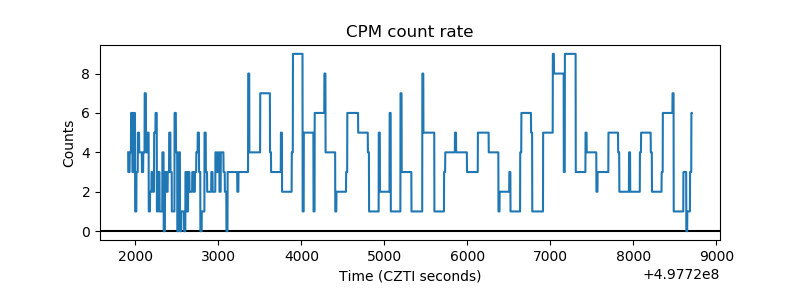 |
| CZT Counter | 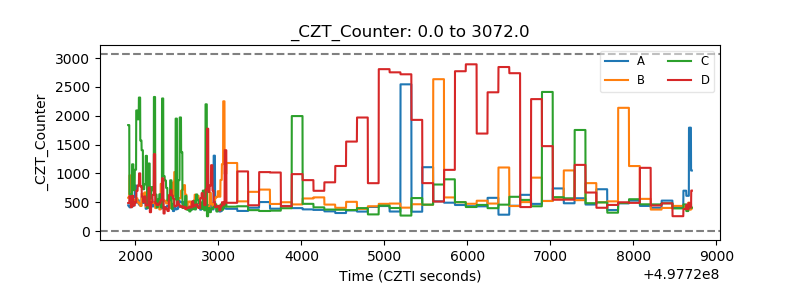 |
| +2.5 Volts monitor |  |
| +5 Volts monitor |  |
| _ROLL_ROT | 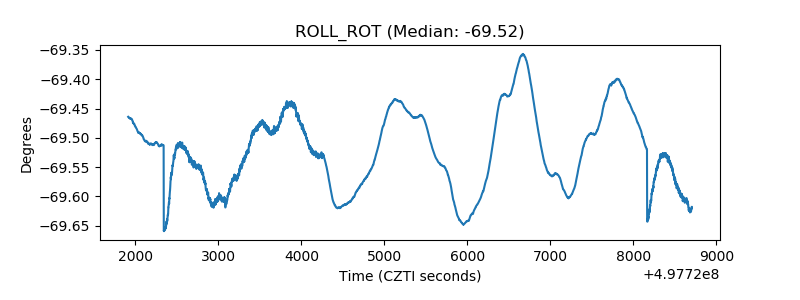 |
| _Roll_DEC | 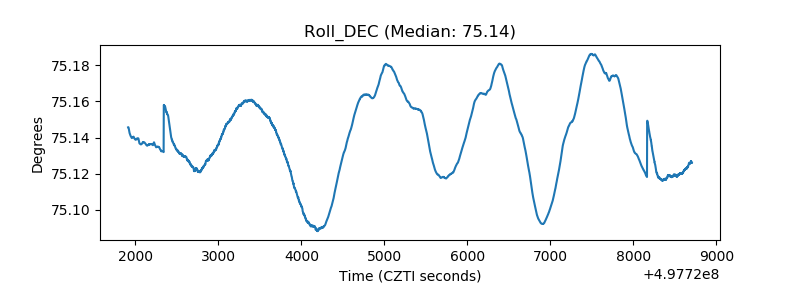 |
| _Roll_RA | 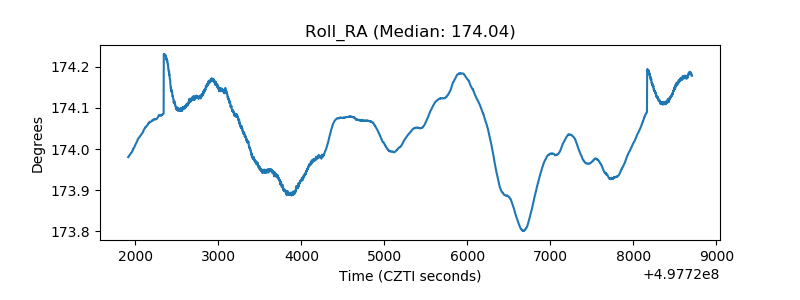 |
| Veto Counter | 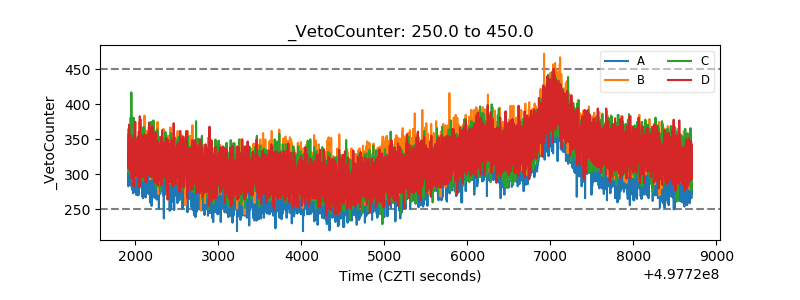 |